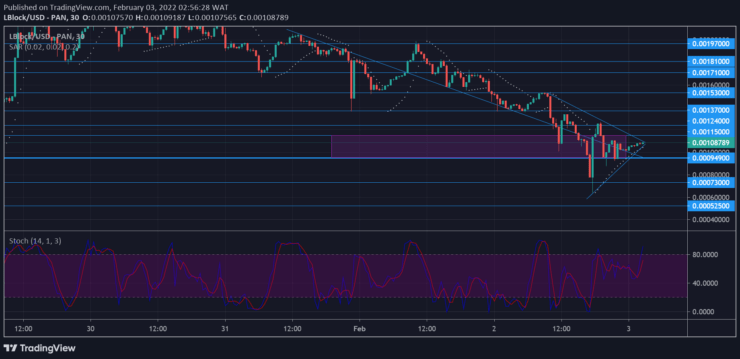
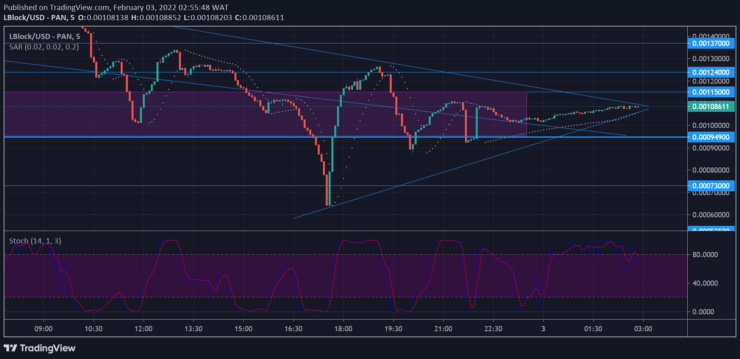
The Lucky Block market forecast points towards a breakout to the upside after the market conforms to a triangle pattern.

Lucky Block Market Forecast – February 3
LBLOCK/USD Long-term Trend: Bullish (Daily Chart)
Key Levels:
Resistance Levels: $0.0011500, $0.001370
Support Levels: $0.0009490, $0.0007300
 LBLOCK/USD bulls are leveraging on a strong and significant price level to halt the activity of the bears. Furthermore, the price is expected to rise further in favor of buyers as it follows a symmetrical triangle pattern. Hence, the market can be seen making consistent lower highs and higher lows as it tapers through the triangle pattern. From yesterday into today, the market has become quiet as it waits for market forces to push it in an upward direction.
Lucky Block Price Prediction: LBlock Market Anticipation
The market has been in decline since hitting a strong resistance level at $0.001970. The price is seen gyrating downward above the downtrend line. The fall in the price of Lucky Block is an opportunity for buyers as they set themselves up in an array to gazump the market at a lower price.
The $0.0009490 key level is the reversal point at which the bulls chose to enter the market. Bears were unrelenting nevertheless, and they dragged the market below the strong support level. However, the price is now recoiling into a triangle pattern as it prepares for a push-up.
LBLOCK has climbed back above the strong support at $0.0009490 as it tapers through the symmetrical triangle. The Parabolic SAR (Stop and Reverse) already infers a change of direction upwards with multiple dots below the daily candles. The Stochastic, meanwhile, has risen to midlevel, from where it has crossed upward to the overbought region. A slight pullback may precede a market breakout.
LBLOCK/USD Medium-Term Trend: Bearish (5-minute chart)
The 5-minute chart helps us see the silence in the market as bulls get ready to swoop into the market. LBLOCK/USD is currently ranging between $0.001150 as resistance and $0.0009490 as support, and the price is set to take a definite direction.
 Like the daily chart, the Parabolic SAR has multiple dots below the 5-minute candles to signal a switch in an upward direction. The Stochastic on the 5-minute chart is currently hovering around the overbought region. The price is likely to touch down at $0.0009490 before breaking out upward towards $0.001370.
Source: https://learn2.trade

 Hot Features


