Key Resistance Levels: $1,900, $1,950, $2000
Key Support Levels: $1,750, $1, 700,$1,650

Gold (XAUUSD) Long-term Trend: Bullish
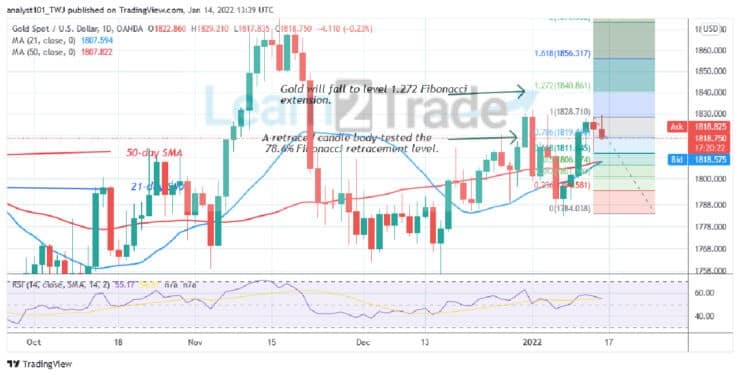
Gold (XAUUSD) is in a sideways move but may slump to $1,800 low. Gold is retracing as it faces rejection at the high of $1,830. However, if price breaks the resistance level, the market will rise and retest the previous high of $1,860. Meanwhile, on January 14 uptrend; a retraced candle body tested the 78.6% Fibonacci retracement level. The retracement suggests that Gold will rise but reverse at level 1.272 Fibonacci extension or $1,840.86.

Daily Chart Indicators Reading:
Gold is at level 55 of the Relative Strength Index for period 14. The market has reached the uptrend zone and further upside is likely. The 21-day SMA and the 50-day SMA are sloping upward indicating an uptrend.
Gold (XAUUSD) Medium-term bias: Ranging
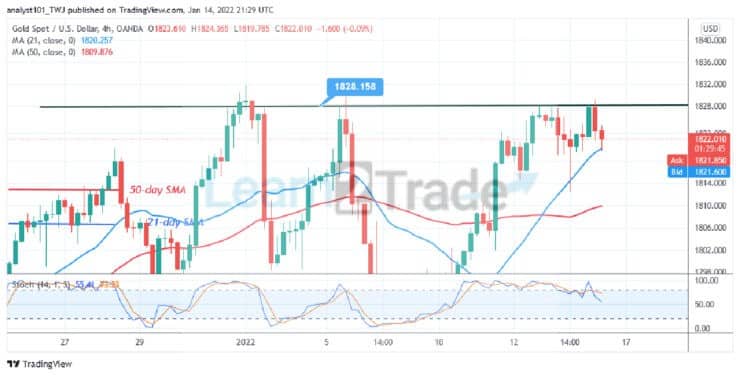
On the 4 hour chart, the Gold price is in a sideways trend. The gold price fluctuates below the $1,828 overhead resistance. The sideways trend has been ongoing since December 21. Each time the market retest the overhead resistance, the selling pressure will resume. The current downtrend is likely to extend to the low of $1,804 before upward.

4-hour Chart Indicators Reading
XAUUSD is below the 80% range of the daily stochastic. The market is in the bearish momentum. The 21-day SMA and the 50-day SMA are sloping upward indicating the uptrend.
General Outlook for Gold (XAUUSD)
Gold’s (XAUUSD) price is declining as it may slump to $1,800 low. The market is fluctuating below the $1,828 resistance zone. The Gold price is falling to the downside. The upward move will resume if price finds support above the $1,800.
Source: https://learn2.trade

 Hot Features


