ADVFN Logo ADVFN

We could not find any results for:
Make sure your spelling is correct or try broadening your search.

Trending Now

Toplists

It looks like you aren't logged in.
Click the button below to log in and view your recent history.

Hot Features

Registration Strip Icon for discussion Register to chat with like-minded investors on our interactive forums.

Polkadot (DOT) Fluctuates in a Range as Sellers Attempt to Break Current Support

Share On Facebook
share on Linkedin
Print

Key Resistance Levels: $60, $62, $64
Key Support Levels: $40,$38,$36

©
Updated: 18 December 2021

Polkadot (DOT) Price Long-term Trend: Bearish
Polkadot’s (DOT) price is hovering above the $25 price level. The cryptocurrency has been fluctuating above the current support at $23.95. During the December 4 price slump, the bears retested the current support twice but failed to sink the altcoin. Also, the bulls bought the dips as buyers pushed the altcoin upward. The upward correction was interrupted twice on December 7 and 9 as the crypto fell and resumed the range-bound move. Polkadot has already fallen to the oversold region on December 4. Therefore, a further downward move is unlikely. Buyers are expected to emerge in the oversold region.

DOT/USD – Daily Chart

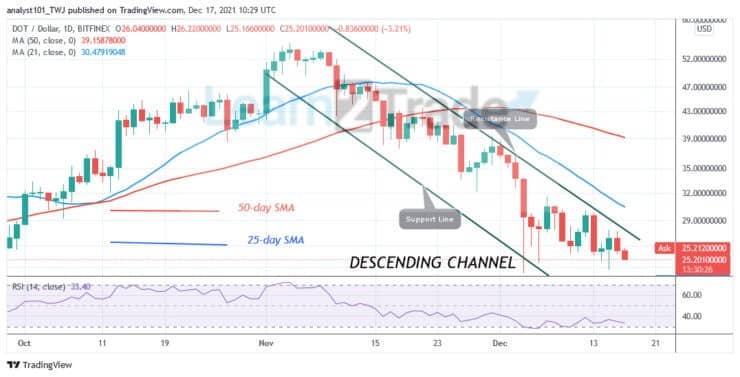
Daily Chart Indicators Reading:
Polkadot is at level 33 of the Relative Strength Index period 14. The market is in the downtrend zone and below the centerline 50. The crypto’s price bars are below the moving averages which indicate a further downward move. The altcoin will rise if price breaks above the moving averages.

Polkadot (DOT) Medium-term Trend: Ranging
On the 4-hour chart, Polkadot is in a range-bound move. The cryptocurrency is fluctuating between $24 and $30 price levels. Polkadot will resume trending when price breaks the range-bound levels. For instance, if price breaks the $30 resistance and the bullish momentum is sustained, the uptrend will resume.

DOT/USD – 4 hour

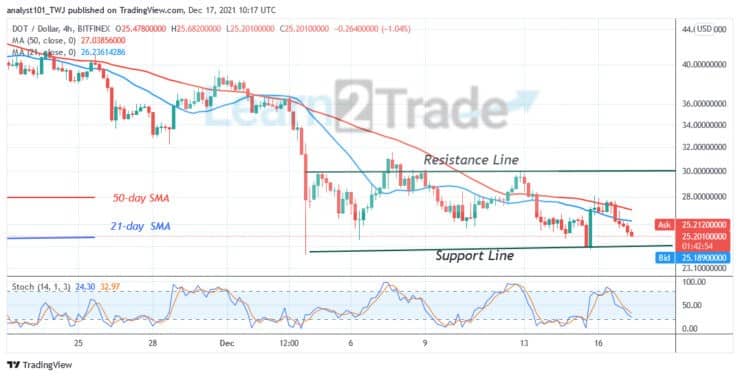
4-hour Chart Indicators Reading
DOT price is above the 25% area of the daily stochastic indicating a bullish momentum. The altcoin is rising after falling to the lower price range. The 21-day SMA and the 50-day SMA are sloping southward indicating the downtrend.

General Outlook for Polkadot (DOT)
DOT/USD is now in a range-bound move. The bearish trend has subsided above the $23.95 support. The altcoin will resume an uptrend if price rebounds above the current support.

Source: https://learn2.trade

CLICK HERE TO REGISTER FOR FREE ON ADVFN, the world's leading stocks and shares information website, provides the private investor with all the latest high-tech trading tools and includes live price data streaming, stock quotes and the option to access 'Level 2' data on all of the world's key exchanges (LSE, NYSE, NASDAQ, Euronext etc).

This area of the ADVFN.com site is for independent financial commentary. These blogs are provided by independent authors via a common carrier platform and do not represent the opinions of ADVFN Plc. ADVFN Plc does not monitor, approve, endorse or exert editorial control over these articles and does not therefore accept responsibility for or make any warranties in connection with or recommend that you or any third party rely on such information. The information available at ADVFN.com is for your general information and use and is not intended to address your particular requirements. In particular, the information does not constitute any form of advice or recommendation by ADVFN.COM and is not intended to be relied upon by users in making (or refraining from making) any investment decisions. Authors may or may not have positions in stocks that they are discussing but it should be considered very likely that their opinions are aligned with their trading and that they hold positions in companies, forex, commodities and other instruments they discuss.

Leave A Reply

 
Do you want to write for our Newspaper? Get in touch: newspaper@advfn.com