Key Resistance Levels: $1,900, $1,950, $2000
Key Support Levels: $1,750, $1, 700,$1,650

Gold (XAUUSD) Long-term Trend: Bullish
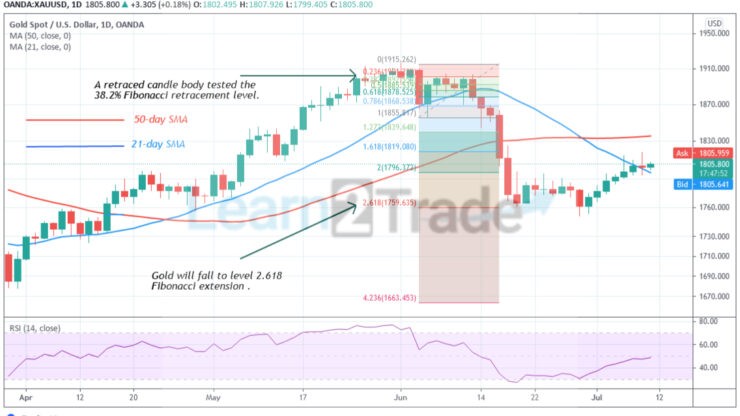
XAUUSD has resumed an upward move after falling to the low of level $1,760 on June 18. On June 29, the bears retested the support as Gold resumed upward. The implication is that the uptrend has resumed as price fails to break the current support the second time. From the Fibonacci tool, Gold has reached bearish exhaustion at the 2.618 Fibonacci extensions as price resumes upward.

Daily Chart Indicators Reading:
Gold has risen to level 48 of the Relative Strength Index period 14. It indicates that Gold is in the downtrend zone and below the centerline 50. The 21-day SMA and 50-day SMA are sloping downward indicating the downtrend. The Gold price has broken above the 21-day SMA. A break above the 50-day SMA will propel Gold to rise.
Gold (XAUUSD) Medium-term bias: Bullish
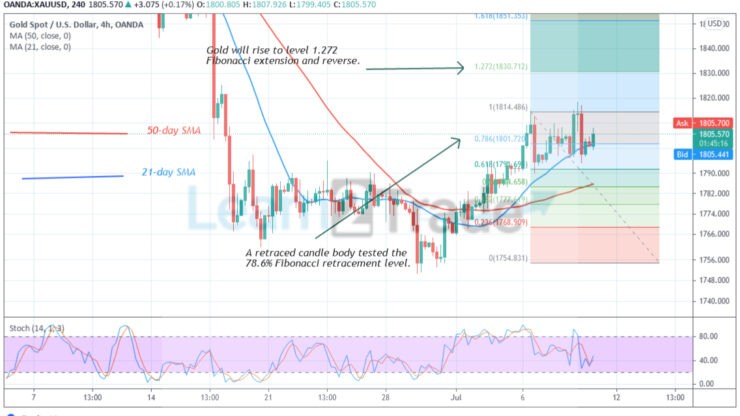
On the 4 hour chart, the Gold price has resumed its upward move. Meanwhile, on July 6 uptrend, a retraced candle body tested the 78.6% Fibonacci retracement level. The retracement indicates that Gold will rise to level 1.272 Fibonacci extension and reverse. From the price action, the Gold price is rising to reach the Fibonacci level.

4-hour Chart Indicators Reading
Gold is above the 40% range of the daily stochastic. It indicates that the market has reached bullish momentum. The 21-day SMA and the 50-day SMA are sloping upward indicating the uptrend.
General Outlook for Gold (XAUUSD)
XAUUSD’s price has recovered above $1,760 support. Gold price is rising as the 21-day SMA crosses above the 50-day SMA. According to the Fibonacci tool, Gold will rise to level 1.272 Fibonacci extension and reverse. That is at level $1,830.71.
Source: https://learn2.trade


