Key Resistance Levels: 1.4200, 1.4400, 1.4600
Key Support Levels: 1.3400, 1.3200, 1.3000

GBP/USD Continues Downtrend After Rejection at Level 1.3900
GBP/USD Price Long-term Trend: Bearish
GBP/USD has been in a downward move after its rejection from level 1.4200. After the initial fall, the Pound is making a series of lower highs and lower lows. On March 5, a retraced candle body tested the 61.8% Fibonacci retracement level. The retracement implies that the pound will fall to level 1.618 Fibonacci extensions or level 1.3493.

Daily Chart Indicators Reading:
The 21-day and 50-SMAs are sloping horizontally. The pair has fallen to level 44 of the Relative Strength Index period 14. This indicates that the Pound is in the downtrend zone and capable of falling on the downside.
GBP/USD Medium-term Trend: Bearish
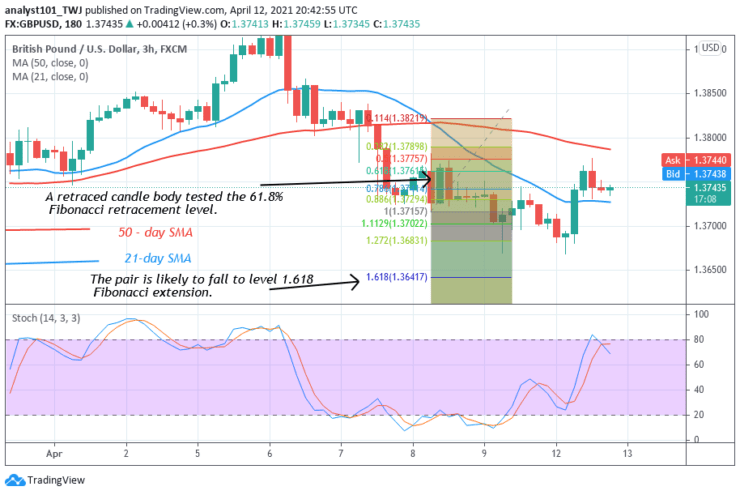
On the 4-hour chart, the pair has resumed a downward move. On April 8 downtrend; a retraced candle body tested the 61.8% Fibonacci retracement level. The retracement indicates that the pair is likely to fall to level 1.618 Fibonacci extension or level 1.3641.

4-hour Chart Indicators Reading
The GBP/USD pair is currently below the 80% range of the daily stochastic. It indicates that the pair is in a bearish momentum. The SMAs are sloping southward indicating the downtrend.
General Outlook for GBP/USD
The GBP/USD is in a downward ward move. The recent downtrend was a result of rejection from level 1.3900. According to the Fibonacci tool, the Pound will fall to level 1.3493.
Source: https://learn2.trade


