Key Support Zones: 11200, 10800, 10400

Germany 30 (DE30EUR) Long-term Trend: Bullish
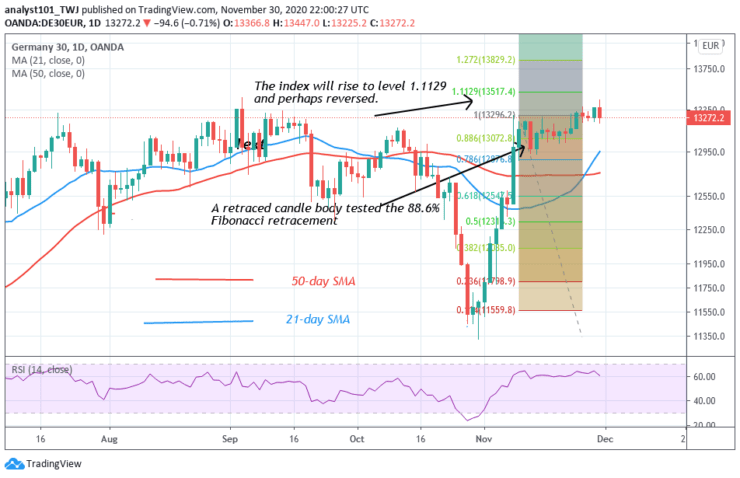
The index is an upward move but it is facing resistance at level 13200. It must have reached bullish exhaustion as it faces rejection. On November 10, a retraced candle body tested the 88.6% Fibonacci retracement. This indicates that the index will rise to level 1.1129 and perhaps reversed.

Daily Chart Indicators Reading:
Presently, the SMAs are sloping upward indicating the uptrend. The index is at level 64 of the Relative Strength Index period 14. This indicates that it is in the uptrend zone and above the centerline 50.
Germany 30 (DE30EUR) Medium-term Trend: Bullish
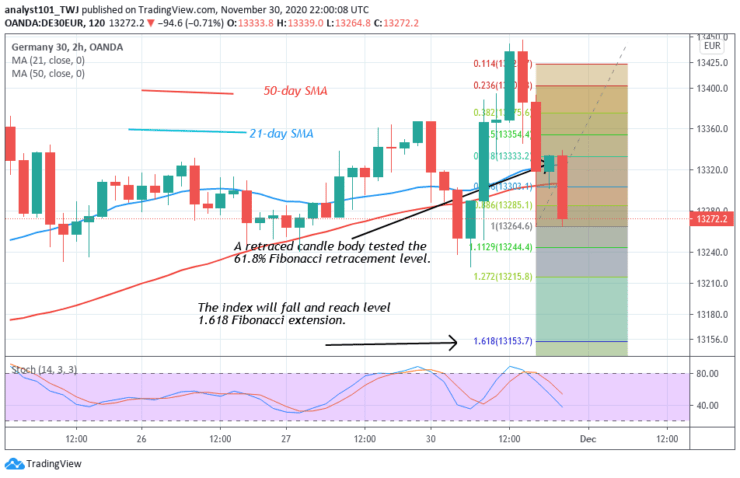
On the 4- hour chart, the index is in a downward move. On November 30 downtrend, a retraced candle body tested the 61.8% Fibonacci retracement level. This implies that the index will fall and reach level 1.618 Fibonacci extension.

4-hour Chart Indicators Reading
The market is below the 80% range of the daily stochastic. It indicates that the index is in a bearish momentum. Meanwhile, the 50-day SMA and the 21-day SMA are sloping upward indicating the uptrend.
General Outlook for Germany 30 (DE30EUR)
DE30EUR is likely to take a downward movement. The index has been trading in the overbought region. Sellers may emerge to push prices down. However, in a trending market, the overbought condition may not hold. That is the pair will continue to riseG
Source: https://learn2.trade


