Key Support Levels: 104.000, 103.000, 102.000

USD/JPY Price Long-term Trend: Bearish
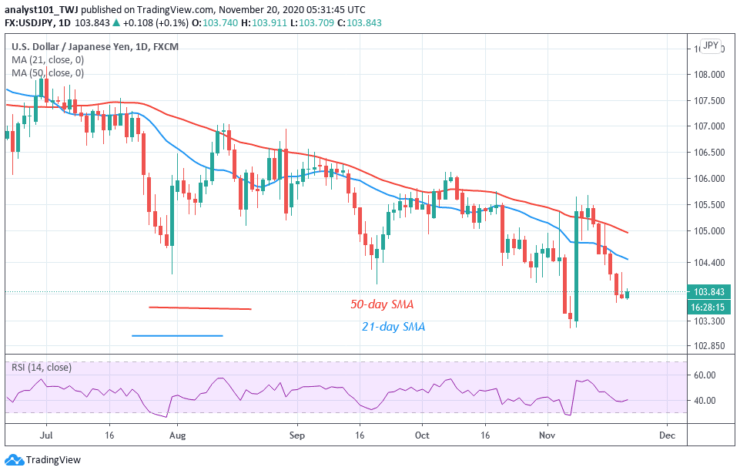
The USD/JPY pair has been in a downward move since November 12 after a rebound above level 103.30. The pair is approaching the previous support at level 103.30. The selling pressure will resume if the current is broken. The Yen will resume an upward move if the support holds.

Daily Chart Indicators Reading:
The 21-day SMA and the 50-day SMA are sloping downward indicating the downtrend. The pair has fallen to level 40 of the Relative Strength Index period 14. The pair is in the downtrend zone and capable of falling.
USD/JPY Medium-term Trend: Bearish
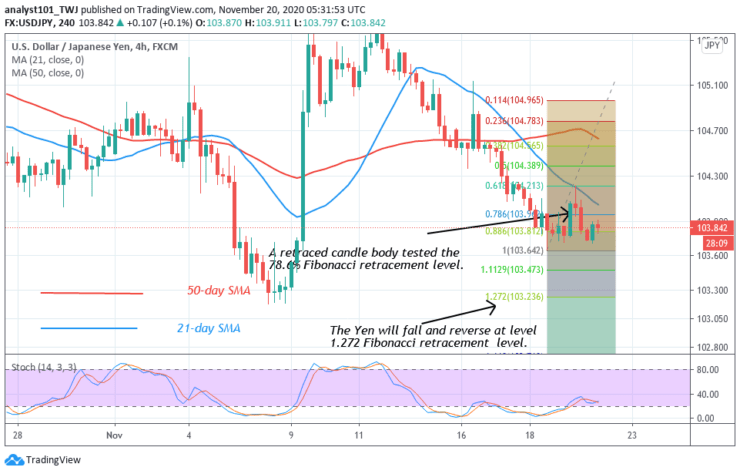
On the 4-hour chart, the pair has been in a downward move after rejection at 105.00. On November 18 downtrend; a retraced candle body tested the 78.6% Fibonacci retracement level. This indicates that the market will fall to level 1.272 Fibonacci extensions. That is the Yen will reach the low of level 103.23 and reverse.

4-hour Chart Indicators Reading
The USD/JPY pair is currently above the 25% range of the daily stochastic. It indicates that the pair is in a bullish momentum. The SMAs are sloping downward indicating the downtrend.
General Outlook for USD/JPY
USD/JPY has been on a downward move but the selling pressure is reaching bearish exhaustion. According to the Fibonacci tool analysis, the Yen will fall and reverse at level 103.23.
Source: https://learn2.trade

 Hot Features


