The stock-to-flow model and other existing variations are some of the most used BTC prediction tools within the cryptocurrency community.

The first version of S2FX, known as the original stock-to-flow ratio, outlined the stock of existing reserves and the flow (the annual supply of BTC in the market). The ensuing version provided more complex and comprehensive Bitcoin information. Apart from stock and flow, it also showed the different phases BTC has passed through since its creation in 2009. These phases include proof-of-concept, the payment phase, e-gold, and financial assets.
The Bitcoin halving, which occurs automatically every four years, is arguably the most crucial part of the models because it cuts BTC supply in half, which decreases the flow. That said, PlanB and S2FX supporters monitor Bitcoin’s price performance assiduously after every halving.
The analyst asserted that the benchmark cryptocurrency is moving like clockwork since its third halving in May. already, Bitcoin is showing some similarities with the price dynamics in 2012.

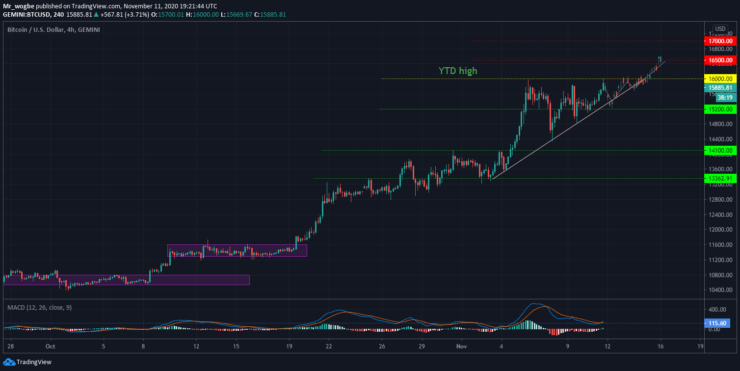
Key BTC Levels to Watch in the Near-Term — November 11
Bitcoin remains on a strong bullish trajectory, despite many projections that bullish steam might be running out. The cryptocurrency has renewed its 2020 high, after hitting $16,000 just a few hours ago. This is a good sign that the bullish momentum is still intact. That said, we could see BTC hit the $16,500 – $17,000 area soon.
However, we could see a mild pullback towards the mid-$15,000 in the coming hours.
Total market capital: $453 billion
Bitcoin market capital: $291 billion
Bitcoin dominance: 64%
Source: https://learn2.trade

 Hot Features


