Key Resistance Levels: 1.4200, 1.4400, 1.4600
Key Support Levels: 1.3400, 1.3200, 1.3000

USD/CAD Price Long-term Trend: Bearish
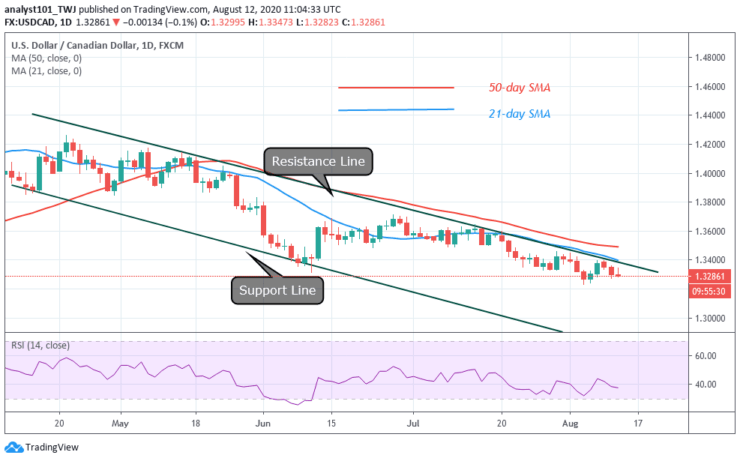
The Loonie is in a downward move. The price is retesting the resistance line of the descending channel. A downward move will follow if price faces rejection at the resistance level. The pair is trading at level 1.3290 at the time of writing.

Daily Chart Indicators Reading:
The 50-day SMA and the 21-day SMA are sloping downward indicating that the market is falling. The Loonie has fallen to level 38 of the Relative Strength Index. The pair is approaching the oversold region of the market. The price is in a bearish momentum.
USD/CAD Medium-term Trend: Bearish
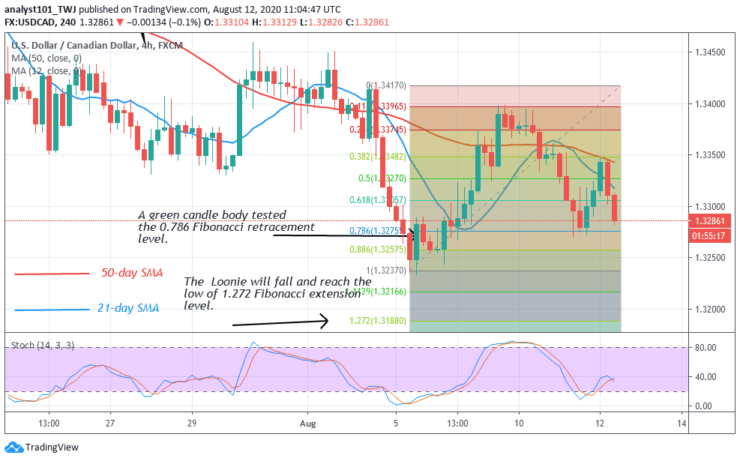
On the 4-hour chart, the pair is in a bearish trend. The Loonie is falling after facing rejection at level 1.3350. A green candle body tested the 0.786 Fibonacci retracement level. The Loonie will fall and reach a low of 1.272 Fibonacci extension level or level 1.3200 price level. At that level, the market will reverse and return to level 0.786 retracement level where it originated.

4-hour Chart Indicators Reading
Presently, the SMAs are slowing downward indicating that the market is falling. The Loonie is below 40% range of the daily stochastic. It indicates that the market is in a bearish momentum. The Loonie is approaching the oversold region.
General Outlook for USD/CAD
The USD/CAD pair is falling. According to the Fibonacci tool, the market will fall and reach a low of 1.3200. At that low, price will resume an upward move. However, the reversal will not be immediate.
Source: https://learn2.trade


