


Key Support Levels: $200, $160, $120

Key Resistance Levels: $275, $300, $325
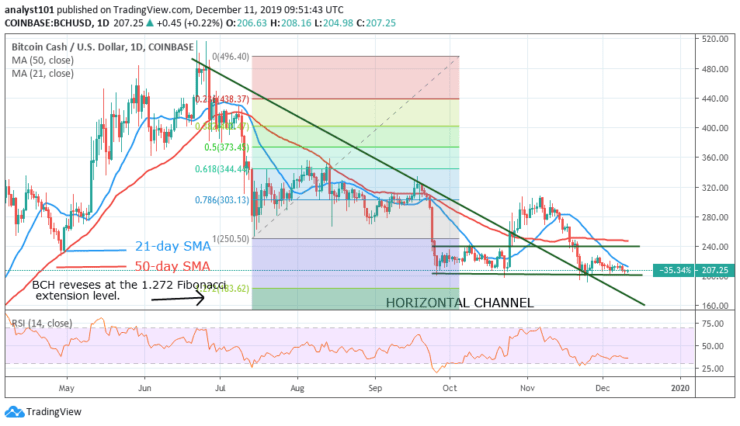
BCH/USD Price Long-term Trend: Ranging
Bitcoin Cash had been trading in the large price range between the levels of $200 and $240. Presently, the coin is now fluctuating at the bottom of the chart. In retrospect, the bulls break the $240 resistance line and reached a high of $310. The coin was resisted as BSH drops back to a range-bound zone.
The bears tested the low at $200 but there was a pulled back. The pullback was a correction as the upward move was stopped at $227. BCH is trading between the low at $200 and $227. The bulls are now having difficulty to move upward because of the resistance at $227. Conversely, the bears have failed to break the low of $200.
Daily Chart Indicators Reading:
The Fibonacci tool indicates that the coin reverses at the 1.272 extension level. BCH will resume the downtrend if the downtrend line or the support line is broken below. The RSI period 14 level 35 is indicating that the price is falling.
BCH/USD Medium-term bias: Ranging
On the 4-hour chart, the coin is fluctuating between the levels of $200 and $220. The bulls tested and broke the $220 price level but fell back to the range-bound zone. The price is trading below the $227 resistance level; a break is being expected shortly.
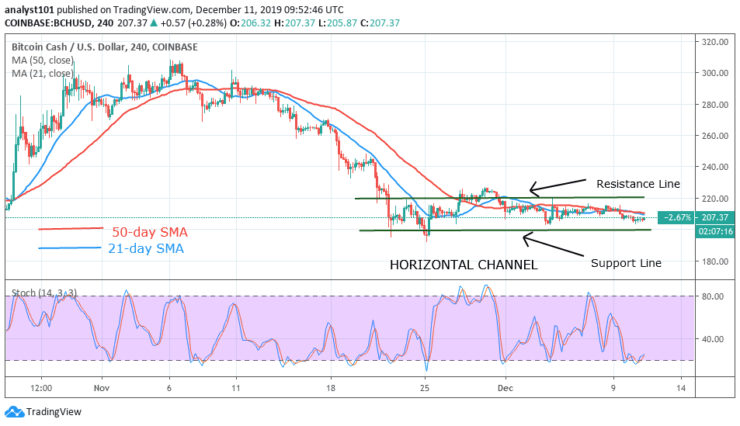
4-hour Chart Indicators Reading
The market is trading above the 20% range of the daily stochastic. This signifies that BCH is in a bullish momentum. The blue and red lines are trending horizontally indicating that price is fluctuating.
General Outlook for Bitcoin Cash (BCH)
Bitcoin Cash is still confined within the price range of $200 and $240. Presently, BCH is in a tight range; a break above $227 will move price to the high of $240. Nevertheless, a break below $200 may weaken the coin to a low of $160.
Bitcoin Cash Trade Signal
Instrument: BCHUSD
Order: buy
Entry price: $203
Stop: $175
Target: $241
Source: https://learn2.trade


