Hot Features
After every rain comes a rainbow. Have you ever heard of the proverb? When it comes to trading, a similar phenomenon tends to occur. In practice, no bear market lasts forever, and the trends are bound to reverse themselves at some point down the line. In general, bullish chart patterns signal the end of a bear market, meaning you can interpret them as a signal it’s time to buy.
Below, we will discuss 6 bullish chart patterns that you should learn to recognize and utilize to their fullest:
- Hammer
When a downtrend reaches its lowest point and a dramatic reversal takes place, we’re talking about a hammer pattern. This is a bullish shape that is characterized by both open and low prices being roughly the same. Notice how the lower shadow tends to have twice the size as the body? This is characteristic of a hammer pattern. Keep in mind that one of the criteria for it to be recognized as such is the presence of a downtrend in the market. The dramatic swing tends to occur due to sellers putting pressure on the price, but ultimately failing to push it down enough so that the bullish force can be in full swing.
Source: ThinkMarkets
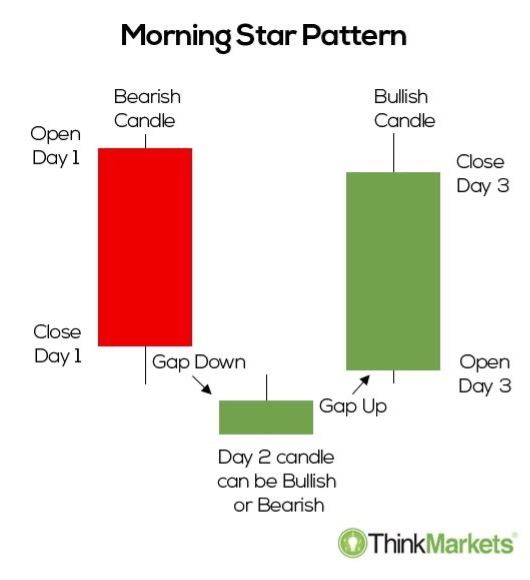
- The morning star
A famous American financial services company Morningstar was supposedly named after this bullish chart pattern. When you see three candlesticks at the end of a downtrend, you’re likely dealing with the morning star pattern. These candlesticks tend to come in the following order:
– A bearish candlestick
– Either a bullish or a bearish candlestick
– A bullish candlestick
As soon as you spot it, this can be a valuable clue that the current downtrend is going to make a u-turn and become an uptrend.
Source: ThinkMarkets
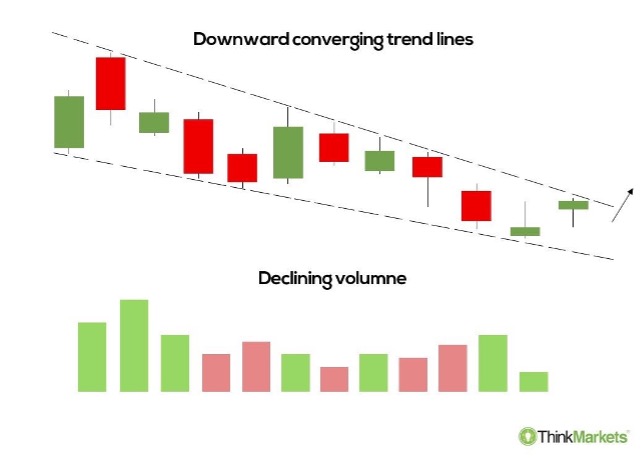
- Falling wedge
The falling wedge is a powerful reversal pattern. ThinkMarkets describes it as a series of downward converging trend lines with a decisive price burst at the end, hence the name “falling wedge”. Its three key elements are:
– A temporary downtrend
– Two converging trend lines
– The volume decreases as the channel progresses
The first two are mandatory, while the last one can be an additional indicator to look for as you attempt to identify one of these bullish chart patterns.
Source: ThinkMarkets
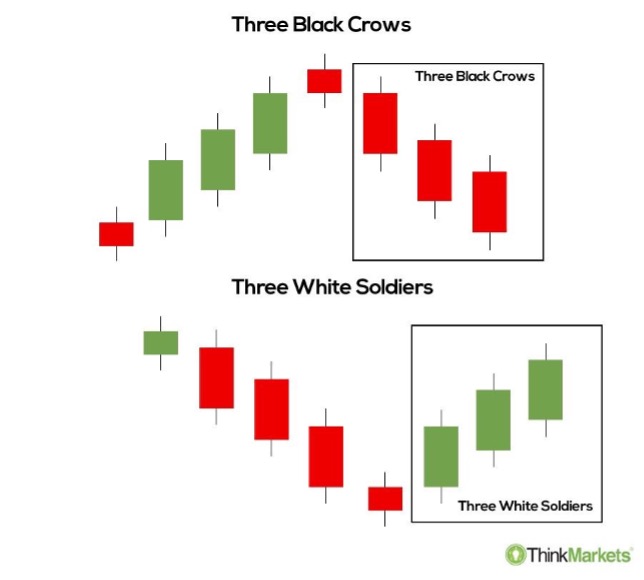
- The three white soldiers
If you believe you’ve spotted the three white soldiers pattern, a bullish reversal is likely to be just around the corner. As the name suggests, this pattern consists of three green candlesticks, all of which are decisively bullish in nature. It’s important to note that these tend to not have long shadows to accompany them. The phenomenon occurs due to the buyers that are making the price jump.
Source: ThinkMarkets
- The piercing pattern
This candlestick pattern comes together near the support levels after a market downtrend is about to start nearing an end. It’s a powerful bullish reversal that consists of two candlesticks, with the first one being bearish in nature and the second – bullish. It’s important to note that the bearish one is supposed to be accompanied by a large body.
As you’re about to make a judgment call whether you’re in fact dealing with a piercing pattern, be on the lookout for the following:
– A general market downtrend
– The length of the candlestick (this has an effect on the force of the reversal)
– The gap between the two candlesticks should be examined as a basis to forecast the strength of the reversal upon
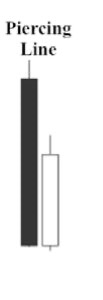
Source: ThinkMarkets
- Bullish engulfing
As the rise in the buying pressure gradually intensifies, a bullish engulfing may form. This phenomenon can be explained as something that occurs when an increasing number of buyers start entering the market, thus gradually causing it to shift its trend from downward to upward. When trying to determine whether you’re indeed dealing with a bullish engulfing pattern, be on the lookout for two candles. The second one in the series will be green and have a key characteristic of engulfing the body of the previous one that is red.
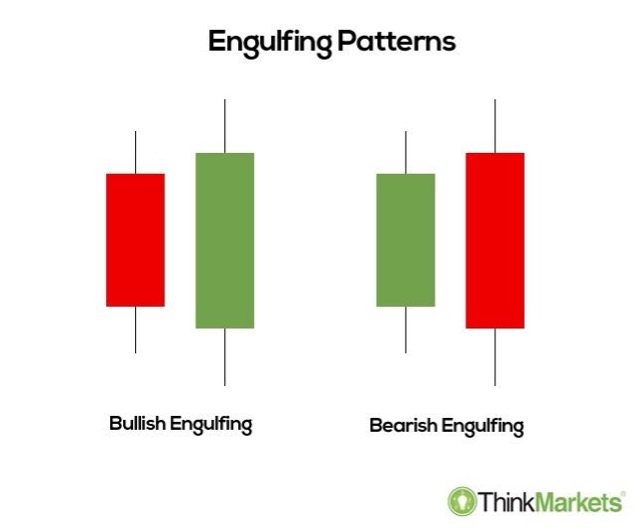
Source: ThinkMarkets
Conclusion
By internalizing the bullish chart patterns you’ve learned today, you’ll be better positioned to make more accurate trading decisions in the future. As always, remember that there are no certainties in the world of trading – only likelihoods. Your task is to make an educated guess on where the market is about to be headed, and having the knowledge necessary to recognize these patterns can help you determine the right move to make.