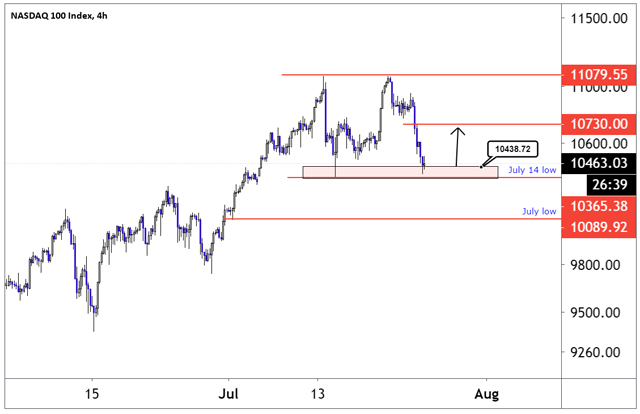
The Nasdaq 100 mega bull trend looks to have hit a roadblock. The move higher in the index, but also crude oil, gold, silver, and the EURUSD is driven by aggressive monetary policy and fiscal stimulus. The individual companies within the Nasdaq 100 have also enjoyed a nice boost on their own merits. However, from its 2020 low, the Nasdaq 100 has risen by 67.54%, and it looks like traders have used the rally to cash out in some of their holdings.
Higher daily deaths in the US because of Covid-19, and the job losses that followed have further suppressed the mood. However, there is no high quality and mature pattern to suggest that it is time to aggressively sell the index.
I don’t have the data for the Nasdaq 100, but the average CFD retail trader has been short the S&P 500 from around the 2020 low. It is the same in the Dow Jones. It is therefore likely that the average retail investors have been short for most of the move higher in the Nasdaq 100 as they believed that the Nasdaq 100 had risen too high and too soon. I am a strict trend follower and was bearish on the way down, and bullish on the way up.
Today, the price index has settled into the 10365 to 11079 range. If the index manages to rise to 11730, it will have created a classic double bottom, and a break to this low might confirm that the trend has indeed turned lower. But we are not there yet. The index could easily bounce to the top side of the range.
What is the next step for me? There are two options, the way I see it, one is to place a very small bet that the range will hold. The second option will be to wait until next week, to see if there is a better pattern to trade. I prefer the latter option.
One could also trade a break to the July 14 low, but given the sharp fall this week, it might prove to be a false breakdown as the risk-reward ratio will be poor.
Nasdaq 100 Four-hour Chart

By Alejandro Zambrano, Editor In Chief at Investingcube.com, and Chief Market Strategist at ATFX.

 Hot Features


