ADVFN Logo ADVFN

We could not find any results for:
Make sure your spelling is correct or try broadening your search.

Trending Now

Toplists

It looks like you aren't logged in.
Click the button below to log in and view your recent history.

Hot Features

Registration Strip Icon for default Register for Free to get streaming real-time quotes, interactive charts, live options flow, and more.

CBH Virtus Convertible and Income 2024 Target Term Fund

8.95
0.01 (0.11%)
15 Jun 2024 - Closed
Delayed by 15 minutes
Share Name Share Symbol Market Type
Virtus Convertible and Income 2024 Target Term Fund NYSE:CBH NYSE Common Stock
  Price Change % Change Share Price High Price Low Price Open Price Shares Traded Last Trade
  0.01 0.11% 8.95 8.97 8.94 8.94 22,480 01:00:00

/FIRST AND FINAL ADD -- PHM005 -- Commerce Bancorp Deposits Up 21%/

16/10/2006 2:39pm

PR Newswire (US)


Virtus Convertible and I... (NYSE:CBH)
Historical Stock Chart


From Jun 2019 to Jun 2024
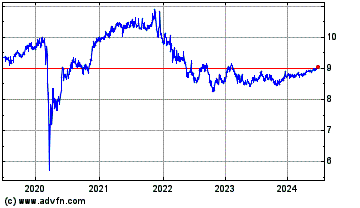
Click Here for more Virtus Convertible and I... Charts.
Commerce Bancorp, Inc. and Subsidiaries Consolidated Balance Sheets (unaudited) -------------------------------------------------------------------------- September 30, December 31, ------------------------------- (dollars in thousands) 2006 2005 -------------------------------------------------------------------------- Assets Cash and due from banks $1,291,070 $1,284,064 Federal funds sold 6,800 12,700 ------------------------------- Cash and cash equivalents 1,297,870 1,296,764 Loans held for sale 79,854 30,091 Trading securities 92,622 143,016 Securities available for sale 10,800,173 9,518,821 Securities held to maturity 14,245,638 13,005,364 (market value 9/06- $13,974,804; 2005- $12,758,552) Loans 14,697,495 12,658,652 Less allowance for loan losses 146,791 133,664 ------------------------------- 14,550,704 12,524,988 Bank premises and equipment, net 1,577,738 1,378,786 Goodwill and other intangible assets 147,653 106,926 Other assets 511,258 461,281 ------------------------------- Total assets $43,303,510 $38,466,037 =============================== Liabil- ities Deposits: Demand: Noninterest-bearing $8,649,757 $8,019,878 Interest-bearing 15,692,939 13,286,678 Savings 10,646,687 9,486,712 Time 5,152,278 3,933,445 ------------------------------- Total deposits 40,141,661 34,726,713 Other borrowed money 118,400 1,106,443 Other liabilities 328,088 323,708 Long-term debt 0 0 ------------------------------- 40,588,149 36,156,864 Stock- Common stock, 188,135,291 holders' shares issued (179,498,717 Equity shares in 2005) 188,135 179,499 Capital in excess of par value 1,689,262 1,450,843 Retained earnings 920,450 750,710 Accumulated other comprehensive (loss) income (63,829) (59,169) ------------------------------- 2,734,018 2,321,883 Less treasury stock, at cost, 1,006,804 shares (837,338 shares in 2005) 18,657 12,710 ------------------------------- Total stockholders' equity 2,715,361 2,309,173 ------------------------------- Total liabilities and stockholders' equity $43,303,510 $38,466,037 =============================== Commerce Bancorp, Inc. and Subsidiaries Consolidated Statements of Income (unaudited) -------------------------------------------------------------------------- Three Months Ended September 30, --------------------------------- (dollars in thousands, except per share amounts) 2006 2005 % Change -------------------------------------------------------------------------- Interest Interest and fees on loans $255,663 $178,878 43 % income Interest on investments 339,825 243,187 40 Other interest 1,918 1,774 8 --------------------------------- Total interest income 597,406 423,839 41 --------------------------------- Interest Interest on deposits: expense Demand 132,349 68,100 94 Savings 70,320 35,215 100 Time 52,375 26,114 101 --------------------------------- Total interest on deposits 255,044 129,429 97 Interest on other borrowed money 20,392 4,697 334 Interest on long-term debt 0 2,339 (100) --------------------------------- Total interest expense 275,436 136,465 102 --------------------------------- Net interest income 321,970 287,374 12 Provision for credit losses 9,499 3,000 217 --------------------------------- Net interest income after provision for credit losses 312,471 284,374 10 Noninterest Deposit charges and service income fees 97,436 72,302 35 Other operating income 53,121 46,763 14 Net investment securities (losses) gains 0 5,714 (100) --------------------------------- Total noninterest income 150,557 124,779 21 --------------------------------- Total Revenues 472,527 412,153 15 Noninterest Salaries and benefits 156,105 134,149 16 expense Occupancy 49,534 41,873 18 Furniture and equipment 41,543 32,371 28 Office 15,213 14,871 2 Marketing 10,712 12,460 (14) Other 70,362 52,858 33 --------------------------------- Total noninterest expenses 343,469 288,582 19 --------------------------------- Income before income taxes 119,559 120,571 (1) Provision for federal and state income taxes 39,890 41,116 (3) --------------------------------- Net income $79,669 $79,455 0 % ================================= Net income per common and common equivalent share: Basic $0.43 $0.48 (10)% --------------------------------- Diluted $0.41 $0.45 (9) --------------------------------- Average common and common equivalent shares outstanding: Basic 186,527 165,701 13 --------------------------------- Diluted 194,754 180,360 8 --------------------------------- Cash dividends, common stock $0.12 $0.11 9 % ================================= -------------------------------------------------------------------------- Nine Months Ended September 30, ---------------------------------- (dollars in thousands, except per share amounts) 2006 2005 % Change -------------------------------------------------------------------------- Interest Interest and fees on loans $707,527 $485,935 46 % income Interest on investments 959,923 703,103 37 Other interest 2,581 2,979 (13) ---------------------------------- Total interest income 1,670,031 1,192,017 40 ---------------------------------- Interest Interest on deposits: expense Demand 348,374 168,526 107 Savings 188,481 77,553 143 Time 129,810 66,793 94 ---------------------------------- Total interest on deposits 666,665 312,872 113 Interest on other borrowed money 54,529 16,024 240 Interest on long-term debt 0 8,379 (100) ---------------------------------- Total interest expense 721,194 337,275 114 ---------------------------------- Net interest income 948,837 854,742 11 Provision for credit losses 23,500 13,750 71 ---------------------------------- Net interest income after provision for credit losses 925,337 840,992 10 Noninterest Deposit charges and service income fees 271,370 201,068 35 Other operating income 153,145 131,532 16 Net investment securities (losses) gains 0 11,511 (100) ---------------------------------- Total noninterest income 424,515 344,111 23 ---------------------------------- Total Revenues 1,373,352 1,198,853 15 Noninterest Salaries and benefits 451,560 381,002 19 expense Occupancy 141,261 118,976 19 Furniture and equipment 117,159 90,192 30 Office 45,084 40,125 12 Marketing 30,222 26,717 13 Other 207,301 168,475 23 ---------------------------------- Total noninterest expenses 992,587 825,487 20 ---------------------------------- Income before income taxes 357,265 359,616 (1) Provision for federal and state income taxes 120,779 123,615 (2) ---------------------------------- Net income $236,486 $236,001 0 % ================================== Net income per common and common equivalent share: Basic $1.29 $1.45 (11)% ---------------------------------- Diluted $1.23 $1.36 (10) ---------------------------------- Average common and common equivalent shares outstanding: Basic 183,981 162,947 13 ---------------------------------- Diluted 192,872 177,951 8 ---------------------------------- Cash dividends, common stock $0.36 $0.33 9 % ================================== Commerce Bancorp, Inc. and Subsidiaries Consolidated Statements of Income (unaudited) -------------------------------------------------------------------------- Three Months Ended ------------------------------------------------ (dollars in Sept. 30, June 30, Sept. 30, thousands, except ------------------------------------------------ per share amounts) 2006 2006 % Change 2005 % Change -------------------------------------------------------------------------- Interest Interest and fees income on loans $255,663 $236,890 8 % $178,878 43 % Interest on investments 339,825 325,022 5 243,187 40 Other interest 1,918 250 667 1,774 8 ------------------------------------------------ Total interest income 597,406 562,162 6 423,839 41 ------------------------------------------------ Interest Interest on expense deposits: Demand 132,349 118,085 12 68,100 94 Savings 70,320 64,157 10 35,215 100 Time 52,375 41,174 27 26,114 101 ------------------------------------------------ Total interest on deposits 255,044 223,416 14 129,429 97 Interest on other borrowed money 20,392 19,809 3 4,697 334 Interest on long- term debt 0 0 0 2,339 (100) ------------------------------------------------ Total interest expense 275,436 243,225 13 136,465 102 ------------------------------------------------ Net interest income 321,970 318,937 1 287,374 12 Provision for credit losses 9,499 7,500 27 3,000 217 ------------------------------------------------ Net interest income after provision for credit losses 312,471 311,437 0 284,374 10 Non- Deposit charges interest and service fees 97,436 91,653 6 72,302 35 income Other operating income 53,121 51,303 4 46,763 14 Net investment securities (losses) gains 0 0 0 5,714 (100) ------------------------------------------------ Total noninterest income 150,557 142,956 5 124,779 21 ------------------------------------------------ Total Revenues 472,527 461,893 2 412,153 15 Non- Salaries and interest benefits 156,105 150,630 4 134,149 16 expense Occupancy 49,534 45,487 9 41,873 18 Furniture and equipment 41,543 39,656 5 32,371 28 Office 15,213 14,398 6 14,871 2 Marketing 10,712 11,699 (8) 12,460 (14) Other 70,362 71,914 (2) 52,858 33 ------------------------------------------------ Total noninterest expenses 343,469 333,784 3 288,582 19 ------------------------------------------------ Income before income taxes 119,559 120,609 (1) 120,571 (1) Provision for federal and state income taxes 39,890 41,089 (3) 41,116 (3) ------------------------------------------------ Net income $79,669 $79,520 0 % $79,455 0 % ================================================ Net income per common and common equivalent share: Basic $0.43 $0.43 0 % $0.48 (10)% ------------------------------------------------ Diluted $0.41 $0.41 0 $0.45 (9) ------------------------------------------------ Average common and common equivalent shares outstanding: Basic 186,527 184,437 1 165,701 13 ------------------------------------------------ Diluted 194,754 193,842 0 180,360 8 ------------------------------------------------ Cash dividends, common stock $0.12 $0.12 0 % $0.11 9 % ================================================ Return on average assets 0.74 % 0.76 % 0.92 % Return on average equity 12.06 12.83 16.62 Commerce Bancorp, Inc. Selected Consolidated Financial Data (unaudited) Three Months Ended September 30, ------------------------------------ % 2006 2005 Change -------------- ------------- ------ (dollars and shares in thousands) Income Statement Data: Net interest income $321,970 $287,374 12 % Provision for credit losses 9,499 3,000 217 Noninterest income 150,557 124,779 21 Total revenues 472,527 412,153 15 Noninterest expense 343,469 288,582 19 Net income 79,669 79,455 0 Per Share Data: Net income - Basic $0.43 $0.48 (10)% Net income - Diluted 0.41 0.45 (9) Book value - Basic Book value - Diluted Revenue per share - Diluted $9.71 $9.14 6 % Weighted Average Shares Outstanding: Basic 186,527 165,701 Diluted 194,754 180,360 Balance Sheet Data: Total assets Loans (net) Allowance for credit losses Securities available for sale Securities held to maturity Total deposits Core deposits Stockholders' equity Capital: Stockholders' equity to total assets Risk-based capital ratios: Tier I Total capital Leverage ratio Performance Ratios: Cost of funds 2.74 % 1.71 % Net interest margin 3.27 3.67 Return on average assets 0.74 0.92 Return on average total stockholders' equity 12.06 16.62 Nine Months Ended September 30, ------------------------------------ % 2006 2005 Change -------------- ------------- ------ (dollars and shares in thousands) Income Statement Data: Net interest income $948,837 $854,742 11 % Provision for credit losses 23,500 13,750 71 Noninterest income 424,515 344,111 23 Total revenues 1,373,352 1,198,853 15 Noninterest expense 992,587 825,487 20 Net income 236,486 236,001 0 Per Share Data: Net income - Basic $1.29 $1.45 (11)% Net income - Diluted 1.23 1.36 (10) Book value - Basic $14.51 $12.23 19 % Book value - Diluted 13.85 11.69 18 Revenue per share - Diluted $9.49 $8.98 6 % Weighted Average Shares Outstanding: Basic 183,981 162,947 Diluted 192,872 177,951 Balance Sheet Data: Total assets $43,303,510 $36,293,540 19 % Loans (net) 14,550,704 11,150,520 30 Allowance for credit losses 154,572 138,903 11 Securities available for sale 10,800,173 8,965,121 20 Securities held to maturity 14,245,638 12,961,900 10 Total deposits 40,141,661 33,243,686 21 Core deposits 38,538,568 32,370,994 19 Stockholders' equity 2,715,361 2,114,361 28 Capital: Stockholders' equity to total assets 6.27 % 5.83 % Risk-based capital ratios: Tier I 12.01 12.18 Total capital 12.73 13.01 Leverage ratio 6.08 6.17 Performance Ratios: Cost of funds 2.53 % 1.50 % Net interest margin 3.39 3.87 Return on average assets 0.76 0.96 Return on average total stockholders' equity 12.61 17.40 The following summary presents information regarding non-performing loans and assets as of September 30, 2006 and the preceding four quarters (dollar amounts in thousands). Sept. 30, June 30, March 31, Dec. 31, Sept. 30, 2006 2006 2006 2005 2005 --------- -------- --------- -------- --------- Non-accrual loans: Commercial $33,658 $34,904 $16,975 $16,712 $16,926 Consumer 9,325 8,927 9,285 8,834 8,559 Commercial real estate: Construction 496 1,708 1,726 1,763 1,882 Mortgage 1,828 2,523 2,096 4,329 3,353 --------- -------- --------- -------- --------- Total non-accrual loans 45,307 48,062 30,082 31,638 30,720 --------- -------- --------- -------- --------- Restructured loans: Commercial - 2,941 3,037 3,133 3,230 Consumer - - - - - Commercial real estate: Construction - - - - - Mortgage - - - - - --------- -------- --------- -------- --------- Total restructured loans - 2,941 3,037 3,133 3,230 --------- -------- --------- -------- --------- Total non-performing loans 45,307 51,003 33,119 34,771 33,950 --------- -------- --------- -------- --------- Other real estate/ foreclosed assets 2,022 1,369 435 279 310 --------- -------- --------- -------- --------- Total non-performing assets 47,329 52,372 33,554 35,050 34,260 --------- -------- --------- -------- --------- Loans past due 90 days or more and still accruing 441 583 332 248 177 --------- -------- --------- -------- --------- Total non-performing assets and loans past due 90 days or more $47,770 $52,955 $33,886 $35,298 $34,437 ========= ======== ======== ======== ========= Total non-performing loans as a percentage of total period-end loans 0.31% 0.36% 0.25% 0.27% 0.30% Total non-performing assets as a percentage of total period-end assets 0.11% 0.12% 0.08% 0.09% 0.09% Total non-performing assets and loans past due 90 days or more as a percentage of total period-end assets 0.11% 0.12% 0.08% 0.09% 0.09% Allowance for credit losses as a percentage of total non-performing loans 341% 291% 432% 407% 409% Allowance for credit losses as a percentage of total period-end loans 1.05% 1.04% 1.06% 1.12% 1.23% Total non-performing assets and loans past due 90 days or more as a percentage of stockholders' equity and allowance for credit losses 2% 2% 1% 1% 2% The following table presents, for the periods indicated, an analysis of the allowance for credit losses and other related data: (dollar amounts in thousands) Year Three Months Ended Nine Months Ended Ended --------------------- -------------------- -------- 09/30/06 09/30/05 09/30/06 09/30/05 12/31/05 Balance at beginning of period $148,383 $141,325 $141,464 $135,620 $135,620 Provisions charged to operating expenses 9,499 3,000 23,500 13,750 19,150 --------- --------- --------- --------- -------- 157,882 144,325 164,964 149,370 154,770 Recoveries on loans charged-off: Commercial 1,707 930 4,335 1,920 2,546 Consumer 237 245 1,372 1,332 2,566 Commercial real estate 57 30 375 80 80 --------- --------- --------- --------- -------- Total recoveries 2,001 1,205 6,082 3,332 5,192 Loans charged-off: Commercial (2,968) (5,287) (10,182) (9,102) (13,944) Consumer (2,119) (1,318) (5,803) (3,720) (5,912) Commercial real estate (224) (22) (489) (977) (1,136) --------- --------- --------- --------- -------- Total charge-offs (5,311) (6,627) (16,474) (13,799) (20,992) --------- --------- --------- --------- -------- Net charge-offs (3,310) (5,422) (10,392) (10,467) (15,800) --------- --------- --------- --------- -------- Allowance for credit loss acquired bank 2,494 --------- Balance at end of period $154,572 $138,903 $154,572 $138,903 $141,464 ========= ========= ========= ========= ========= Net charge-offs as a percentage of average loans outstanding 0.09 % 0.20 % 0.10 % 0.13 % 0.15 % Net Allowance Additions $6,189 ($2,422) $13,108 $3,283 $5,844 Commerce Bancorp, Inc. and Subsidiaries Average Balances and Net Interest Income (unaudited) -------------------------------------------------------------------------- --------------------------------- September 2006 --------------------------------- Average Average Balance Interest Rate --------------------------------- (dollars in thousands) Earning Assets --------------------------------------- Investment securities Taxable $24,566,553 $334,250 5.40 % Tax-exempt 530,542 7,641 5.71 Trading 78,103 934 4.74 ------------ --------- ------ Total investment securities 25,175,198 342,825 5.40 Federal funds sold 145,897 1,918 5.22 Loans Commercial mortgages 5,001,608 90,050 7.14 Commercial 3,603,790 72,606 7.99 Consumer 5,407,721 87,077 6.39 Tax-exempt 510,950 9,123 7.08 ------------ --------- ------ Total loans 14,524,069 258,856 7.07 ------------ --------- ------ Total earning assets $39,845,164 $603,599 6.01 % ============ Sources of Funds --------------------------------------- Interest-bearing liabilities Savings $10,592,676 $70,320 2.63 % Interest bearing demand 14,975,663 132,349 3.51 Time deposits 3,344,257 32,667 3.88 Public funds 1,470,116 19,708 5.32 ------------ --------- ------ Total deposits 30,382,712 255,044 3.33 Other borrowed money 1,543,210 20,392 5.24 Long-term debt 0 0 0.00 ------------ --------- ------ Total deposits and interest-bearing liabilities 31,925,922 275,436 3.42 Noninterest-bearing funds (net) 7,919,242 ------------ --------- ------ Total sources to fund earning assets $39,845,164 275,436 2.74 ============ Net interest income and margin tax-equivalent basis $328,163 3.27 % ========= ====== Other Balances --------------------------------------- Cash and due from banks $1,219,806 Other assets 2,359,885 Total assets 43,279,878 Total deposits 38,772,316 Demand deposits (noninterest-bearing) 8,389,604 Other liabilities 321,225 Stockholders' equity 2,643,127 Allowance for loan losses 144,977 Notes - Weighted average yields on tax-exempt obligations have been computed on a tax-equivalent basis assuming a federal tax rate of 35%. - Non-accrual loans have been included in the average loan balance. - Consumer loans include loans held for sale. --------------------------------- June 2006 --------------------------------- Average Average Balance Interest Rate --------------------------------- (dollars in thousands) Earning Assets --------------------------------------- Investment securities Taxable $23,851,645 $319,271 5.37 % Tax-exempt 559,733 7,322 5.25 Trading 113,049 1,525 5.41 ------------ --------- ------ Total investment securities 24,524,427 328,118 5.37 Federal funds sold 19,898 250 5.04 Loans Commercial mortgages 4,784,584 83,903 7.03 Commercial 3,492,946 66,879 7.68 Consumer 5,115,609 80,560 6.32 Tax-exempt 498,492 8,535 6.87 ------------ --------- ------ Total loans 13,891,631 239,877 6.93 ------------ --------- ------ Total earning assets $38,435,956 $568,245 5.93 % ============ Sources of Funds --------------------------------------- Interest-bearing liabilities Savings $10,344,463 $64,157 2.49 % Interest bearing demand 14,597,277 118,085 3.24 Time deposits 3,088,653 25,949 3.37 Public funds 1,224,298 15,225 4.99 ------------ --------- ------ Total deposits 29,254,691 223,416 3.06 Other borrowed money 1,624,229 19,809 4.89 Long-term debt 0 0 0.00 ------------ --------- ------ Total deposits and interest-bearing liabilities 30,878,920 243,225 3.16 Noninterest-bearing funds (net) 7,557,036 ------------ --------- ------ Total sources to fund earning assets $38,435,956 243,225 2.54 ============ Net interest income and margin tax-equivalent basis $325,020 3.39 % ========= ====== Other Balances --------------------------------------- Cash and due from banks $1,278,137 Other assets 2,314,307 Total assets 41,888,789 Total deposits 37,486,585 Demand deposits (noninterest-bearing) 8,231,894 Other liabilities 299,622 Stockholders' equity 2,478,353 Allowance for loan losses 139,611 Notes - Weighted average yields on tax-exempt obligations have been computed on a tax-equivalent basis assuming a federal tax rate of 35%. - Non-accrual loans have been included in the average loan balance. - Consumer loans include loans held for sale. --------------------------------- September 2005 --------------------------------- Average Average Balance Interest Rate --------------------------------- (dollars in thousands) Earning Assets --------------------------------------- Investment securities Taxable $19,732,946 $239,481 4.81 % Tax-exempt 397,351 4,366 4.36 Trading 96,344 1,335 5.50 ------------ --------- ------ Total investment securities 20,226,641 245,182 4.81 Federal funds sold 198,260 1,774 3.55 Loans Commercial mortgages 3,865,284 63,300 6.50 Commercial 2,760,625 47,117 6.77 Consumer 4,087,665 62,720 6.09 Tax-exempt 498,211 8,831 7.03 ------------ --------- ------ Total loans 11,211,785 181,968 6.44 ------------ --------- ------ Total earning assets $31,636,686 $428,924 5.38 % =========== Sources of Funds --------------------------------------- Interest-bearing liabilities Savings $8,127,451 $35,215 1.72 % Interest bearing demand 12,638,411 68,100 2.14 Time deposits 2,734,408 18,760 2.72 Public funds 842,894 7,354 3.46 ------------ --------- ------ Total deposits 24,343,164 129,429 2.11 Other borrowed money 541,119 4,697 3.44 Long-term debt 163,043 2,339 5.69 ------------ --------- ------ Total deposits and interest-bearing liabilities 25,047,326 136,465 2.16 Noninterest-bearing funds (net) 6,589,360 ------------ --------- ------ Total sources to fund earning assets $31,636,686 136,465 1.71 Net interest income and margin tax-equivalent basis $292,459 3.67 % ========= ====== Other Balances --------------------------------------- Cash and due from banks $1,306,848 Other assets 1,845,602 Total assets 34,644,396 Total deposits 31,788,250 Demand deposits (noninterest-bearing) 7,445,086 Other liabilities 240,177 Stockholders' equity 1,911,807 Allowance for loan losses 144,740 Notes - Weighted average yields on tax-exempt obligations have been computed on a tax-equivalent basis assuming a federal tax rate of 35%. - Non-accrual loans have been included in the average loan balance. - Consumer loans include loans held for sale. Commerce Bancorp, Inc. and Subsidiaries Computation of Net Income Per Share (dollars in thousands, except per share amounts) Three Months Ended Nine Months Ended September 30, September 30, ------------------ ----------------- 2006 2005 2006 2005 -------- -------- -------- -------- Basic: Net income applicable to common stock $79,669 $79,455 $236,486 $236,001 ======== ======== ======== ======== Average common shares outstanding 186,527 165,701 183,981 162,947 ======== ======== ======== ======== Net income per common share $0.43 $0.48 $1.29 $1.45 ======== ======== ======== ======== Diluted: Net income applicable to common stock on a diluted basis $79,669 $79,455 $236,486 $236,001 Interest expense on trust preferred securities 1,520 5,446 -------- -------- -------- -------- $79,669 $80,975 $236,486 $241,447 ======== ======== ======== ======== Average common shares outstanding 186,527 165,701 183,981 162,947 Additional shares considered in diluted computation assuming: Exercise of stock options 8,227 8,478 8,891 7,894 Conversion of trust preferred securities 6,181 7,110 -------- -------- -------- -------- Average common and common equivalent shares outstanding 194,754 180,360 192,872 177,951 ======== ======== ======== ======== Net income per common and common equivalent share $0.41 $0.45 $1.23 $1.36 ======== ======== ======== ======== DATASOURCE: Commerce Bancorp, Inc.

Copyright

1 Year Virtus Convertible and I... Chart

1 Year Virtus Convertible and I... Chart

1 Month Virtus Convertible and I... Chart

1 Month Virtus Convertible and I... Chart

Your Recent History