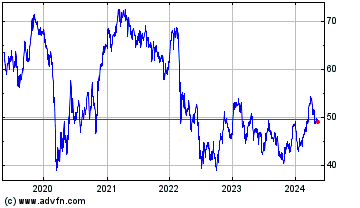
BASF (TG:BAS)
Historical Stock Chart
From Dec 2019 to Dec 2024
MIDLAND, Texas, Feb. 23 /PRNewswire-FirstCall/ -- Basic Energy Services, Inc. (NYSE:BAS) ("Basic") today announced its financial and operating results for the fourth quarter and twelve months ended December 31, 2009.
Basic generated revenue of $128.1 million during the fourth quarter of 2009, up 3% from $125.0 million in the third quarter of 2009, and down from the $246.0 million reported in the fourth quarter of 2008. For the fourth quarter of 2009, Basic reported a net loss of $24.2 million, or $0.61 per diluted share. In the comparable quarter last year, Basic reported net income of $3.9 million, or $0.10 per diluted share, which included $12.2 million of after-tax income related to the terminated merger break-up fee payment and a non-cash goodwill impairment charge of $22.5 million.
Adjusted EBITDA for the 2009 fourth quarter was $8.7 million, or 7% of revenue, compared to $6.7 million, or 5% of revenue, in the third quarter of 2009, and $61.8 million, or 25% of revenue, in the comparable quarter of 2008. Adjusted EBITDA is defined as net income before interest, taxes, depreciation, amortization and the net gain or loss from the disposal of assets. The 2008 fourth quarter results also exclude the pre-tax goodwill impairment charge and terminated merger income. Adjusted EBITDA, which is not a measure determined in accordance with generally accepted accounting principles ("GAAP"), is defined and reconciled in note 2 under the accompanying financial tables.
Ken Huseman, Basic's President and Chief Executive Officer, stated, "We capitalized on improving market conditions during the fourth quarter to more than offset weaker seasonal factors and generated the second consecutive sequential increase in revenue. Oil driven drilling activity in particular drove substantial sequential improvements in our pressure pumping and drilling segments of 13% and 11%, respectively, along with a more modest sequential increase of 2% in our fluid services segment. Our well servicing segment, which is more dependent on maintenance-related work, felt the impact of the seasonally shorter workdays with a sequential decline in rig hours of 3% and a decline in revenue of 4%.
"Rates were generally stable with the exception of our fluids services segments where several competitors were heavily discounting frac tank rentals and other auxiliary charges early in the quarter. While that competitive pressure moderated by the end of the quarter, margins in the segment suffered as a result. Instances of labor shortages began appearing in the busier markets at the end of the quarter so margins were pressured with slightly higher labor and fuel costs with no room for rate increases at year end.
"It was an extremely difficult year as the comparison to 2008 confirms. Despite the unprecedented drop in spending for oilfield services by the E&P companies and substantial excess capacity in the industry, we generated modest cash flow from operations while protecting our ability to offer a broad range of services from our large network of service points throughout our footprint.
"Our expectations are much improved for the new year. Activity levels have continued to build on the momentum we saw develop in the fourth quarter even with unfavorable weather in most markets. Expectations for oil prices well above the $60 threshold are driving capital spending plans for drilling, enhanced oil recovery (EOR) and workover projects across the range of our customer base. Despite uncertain gas prices, our customers indicate increased levels of spending for workover and drilling projects in anticipation of improving prices later in the year.
"I'd like to thank our employees for making the most of the challenging business conditions we faced throughout 2009. Those dedicated and experienced people in combination with our quality fleet, market coverage and substantial liquidity provide the foundation upon which we expect to build much stronger results in 2010."
In 2009, Basic generated a net loss of $84.5 million for the year, or $2.13 per diluted share, excluding the impact of a $166.9 million after-tax ($204.0 million pre-tax) non-cash goodwill impairment charge and a $2.2 million after-tax ($3.5 million pre-tax) loss on the early extinguishment of debt. Net loss as reported for 2009 was $253.5 million, or $6.39 per diluted share. During the comparable period in 2008, Basic generated net income of $83.4 million, or $2.00 per diluted share, before merger and goodwill-related items. Including those items, net income reported for the 2008 year was $68.2 million, or $1.64 per diluted share. Revenues declined 48% to $526.6 million in 2009, compared to $1.0 billion in 2008.
Business Segment Results
Well Servicing
Sequentially, well servicing revenues declined approximately 4% to $37.0 million during the fourth quarter of 2009 compared to $38.4 million in the prior quarter. Last year's fourth quarter revenues were $76.2 million. At December 31, 2009, the well servicing rig count was 405, down nine net rigs from the prior quarter end, as Basic added four newbuild well servicing rigs and retired 13 rigs. The weighted average number of well servicing rigs was 410 during the fourth quarter of 2009 compared to 414 during both the third quarter of 2009 and the fourth quarter of 2008.
Well servicing rig utilization of 41% in the fourth quarter of 2009 was down slightly from 42% in the third quarter reflecting the impact of shorter daylight hours as well as the holidays that fall in fourth quarter. Last year in the comparable quarter, the rig utilization rate was 62%. Revenue per well servicing rig hour declined 1% sequentially to $309 during the fourth quarter of 2009 compared to $313 in the prior quarter. During the fourth quarter of 2008, revenue per well servicing hour was $418.
Well servicing segment profit in the fourth quarter of 2009 was $9.1 million compared to $9.4 million in the prior quarter and $25.8 million in the same period in 2008. Continued focus on cost control produced segment profit margins of 25% in the fourth quarter of 2009, up from 24% in the third quarter of 2009, but down from 34% in the fourth quarter of 2008.
Fluid Services
Fluid services revenue in the fourth quarter of 2009 increased by 2% to $51.0 million compared to $49.8 million in the prior quarter. During the comparable quarter of 2008, this segment produced $89.1 million in revenue. Weighted average number of fluid services trucks declined to 794 trucks during the fourth quarter of 2009, down eleven trucks from the average truck count of 805 during the third quarter of 2009. During the fourth quarter of 2008 the average number of fluid services trucks was 804.
Average revenue per fluid services truck was $64,000 in the fourth quarter of 2009, up slightly from $62,000 in the prior quarter and down 42% compared to $111,000 in the same period in 2008. Segment profit in the fourth quarter of 2009 was $10.3 million, or 20% of revenue, compared to $11.3 million, or 23% of revenue, in the prior quarter and $33.9 million, or 38% of revenue, in the same period in 2008. Segment profit margins were down sequentially due to higher diesel and other operating costs. Additionally, weather-related and environmental slowdowns significantly decreased margins in the construction segment.
Completion & Remedial Services
Sequentially, completion and remedial services revenues increased 9% to $35.6 million in the fourth quarter of 2009 from $32.6 million in the prior quarter. Last year, this segment generated $70.7 million in revenue. Segment profit in the fourth quarter of 2009 rose sequentially to $10.8 million, or 30% of revenue, compared to $9.5 million, or 29% of revenue, in the prior quarter. During the fourth quarter of 2008, segment profit was $30.4 million, or 43% of revenue. The sequential rise in revenue was mainly due to the improved revenues from the pressure pumping service line. As of December 31, 2009, Basic had approximately 139,000 hydraulic horsepower, the same as at September 30, 2009, and December 31, 2008.
Contract Drilling
Contract drilling revenues rose sequentially 11% to $4.6 million during the fourth quarter of 2009 compared to $4.1 million in the prior quarter. During the comparable quarter of 2008, this segment produced revenue of $9.9 million. Segment profit in the fourth quarter of 2009 was $905,000 compared to $845,000 in the prior quarter and $3.6 million during the fourth quarter of 2008. The sequential rise in segment profit was primarily a result of a 7% increase in drilling rig operating days and a 4% rise in revenue per day partially offset by a 5% increase in operating expenses per day. Basic operated nine drilling rigs during the fourth quarter of 2009, the same as in the prior quarter and in the same period in 2008.
G&A Expense
G&A expense in the fourth quarter of 2009 decreased by 10% to $22.6 million from $25.1 million in the prior quarter mainly as a result of continued cost saving measures, lower bad debt expense and an insurance settlement. During the fourth quarter of 2008, G&A expense was $32.1 million.
Capital Expenditures
During 2009, Basic's total capital expenditures, including capital leases, were approximately $61 million, comprised of $29 million for sustaining and replacement projects, $21 million for expansion projects and $11 million for other projects. Expansion capital spending included approximately $11 million for the fluid services segment, $8 million for the completion and remedial services segment, and $2 million for the well servicing segment. Other capital expenditures of $11 million were mainly for facilities and IT infrastructure.
In 2010, the minimum capital requirements planned for sustaining Basic's existing fleet is approximately $35 million. Capital expenditures for expansion and other replacements will be made as the operating environment improves.
Basic Energy Services provides well site services essential to maintaining production of oil and gas wells within its operating area. The Company employs approximately 3,800 employees in more than 100 service points throughout the major oil and gas producing regions in Texas, Louisiana, Oklahoma, New Mexico, Arkansas, Kansas and the Rocky Mountain states.
For more information, please visit Basic's website at http://www.basicenergyservices.com/.
Conference Call
Basic will host a conference call to discuss its fourth quarter 2009 results on Wednesday, February 24, 2010, at 9:00 a.m. Eastern Time (8:00 a.m. Central). To access the call, please dial (480) 629-9835 and ask for the "Basic Energy Services" call at least 10 minutes prior to the start time. The conference call will also be broadcast live via the Internet and can be accessed through the investor relations section of Basic's corporate website, http:/// http://www.basicenergyservices.com/.
A telephonic replay of the conference call will be available until March 4, 2010 and may be accessed by calling (303) 590-3030 and using the pass code 4206151#. A webcast archive will be available at http://www.basicenergyservices.com/ shortly after the call and will be accessible for approximately 30 days. For more information, please contact Donna Washburn at DRG&E at (713) 529-6600 or email at .
Safe Harbor Statement
This release includes forward-looking statements and projections, made in reliance on the safe harbor provisions of the Private Securities Litigation Reform Act of 1995. Basic has made every reasonable effort to ensure that the information and assumptions on which these statements and projections are based are current, reasonable, and complete. However, a variety of factors could cause actual results to differ materially from the projections, anticipated results or other expectations expressed in this release, including (i) changes in demand for our services and any related material impact on our pricing and utilizations rates, (ii) Basic's ability to execute, manage and integrate acquisitions successfully and (iii) changes in our expenses, including labor or fuel costs and financing costs. Additional important risk factors that could cause actual results to differ materially from expectations are disclosed in Item 1A of Basic's Form 10-K for the year ended December 31, 2008 and subsequent Form 10-Qs filed with the SEC. While Basic makes these statements and projections in good faith, neither Basic nor its management can guarantee that anticipated future results will be achieved. Basic assumes no obligation to publicly update or revise any forward-looking statements made herein or any other forward-looking statements made by Basic, whether as a result of new information, future events, or otherwise.
Contacts: Alan Krenek, Chief Financial Officer
Basic Energy Services, Inc.
432-620-5510
Jack Lascar/Sheila Stuewe
DRG&E / 713-529-6600
-Tables to Follow-
Basic Energy Services, Inc.
Consolidated Statements of Operations, Comprehensive Income
and Other Financial Data
(in thousands, except per share amounts)
Three Months Twelve Months
Ended Ended
December 31, December 31,
---------------- ----------------
2009 2008 2009 2008
------ ------ ------ ------
Income Statement Data: (Unaudited)(Unaudited)(Unaudited)(Audited)
Revenues:
Well servicing $36,967 $76,194 $160,614 $343,113
Fluid services 50,975 89,128 214,822 315,768
Completion and remedial
services 35,594 70,748 134,818 304,326
Contract drilling 4,597 9,902 16,373 41,735
----- ----- ------ ------
Total revenues 128,133 245,972 526,627 1,004,942
------- ------- ------- ---------
Expenses:
Well servicing 27,825 50,437 121,618 215,243
Fluid services 40,640 55,190 159,079 203,205
Completion and remedial
services 24,803 40,335 95,287 165,574
Contract drilling 3,692 6,318 13,604 28,629
General and administrative (1) 22,610 32,107 104,253 115,319
Depreciation and amortization 33,915 32,572 132,520 118,607
(Gain) loss on disposal
of assets 797 284 2,650 76
Goodwill impairment - 22,522 204,014 22,522
--- ------ ------- ------
Total expenses 154,282 239,765 833,025 869,175
------- ------- ------- -------
Operating income
(loss) (26,149) 6,207 (306,398) 135,767
Other income (expense):
Interest expense (11,479) (6,649) (32,949) (26,766)
Interest income 35 311 563 2,136
Loss on early extinguishment
of debt - - (3,481) -
Other income (expense) 127 19,939 1,198 12,235
--- ------ ----- ------
Income (loss) from continuing
operations before income
taxes (37,466) 19,808 (341,067) 123,372
Income tax benefit (expense) 13,314 (15,881) 87,529 (55,134)
------ ------ ------ ------
Net income (loss) $(24,152) $3,927 $(253,538) $68,238
======== ====== ========= =======
Earnings (loss) per share of
common stock:
Basic $(0.61) $0.10 $(6.39) $1.67
====== ===== ====== =====
Diluted $(0.61) $0.10 $(6.39) $1.64
====== ===== ====== =====
Other Financial Data:
EBITDA (2) $8,690 $59,002 $(173,501) $266,685
Adjusted EBITDA (2) 8,690 61,824 33,984 277,377
Capital expenditures:
Acquisitions, net of cash
acquired 6,626 95 7,816 110,913
Property and equipment 8,568 23,022 43,367 91,890
As of
December December
31, 31,
2009 2008
(unaudited) (audited)
--------------------
Balance Sheet Data:
Cash and cash equivalents $125,357 $111,135
Restricted cash 14,123 -
Net property and equipment 666,642 740,879
Total assets 1,039,541 1,310,711
Total long-term debt 475,845 454,260
Total stockholders' equity 340,149 595,004
Three months Twelve months
Ended Ended
December 31, December 31,
Segment Data: 2009 2008 2009 2008
Well Servicing
Weighted average number of rigs 410 414 413 405
Rig hours (000's) 119.5 182.4 485.2 840.2
Rig utilization rate 40.8% 61.6% 41.1% 72.5%
Revenue per rig hour $309 $418 $331 $408
Well servicing rig profit
per rig hour $77 $141 $80 $152
Segment profits as a percent
of revenue 24.7% 33.8% 24.3% 37.3%
Fluid Services
Weighted average number
of fluid services trucks 794 804 805 699
Revenue per fluid services
truck (000's) $64 $111 $267 $452
Segment profits per fluid
services truck (000's) $13 $42 $69 $161
Segment profits as a percent
of revenue 20.3% 38.1% 26.0% 35.6%
Completion and Remedial Services
Segment profits as a percent
of revenue 30.3% 43.0% 29.3% 45.6%
Contract Drilling
Weighted average number of rigs 9 9 9 9
Rig operating days 417 666 1,370 2,777
Revenue per day $11,000 $14,900 $12,000 $15,000
Drilling rig profit per day $2,200 $5,400 $2,000 $4,700
Segment profits as a percent
of revenue 19.7% 36.2% 16.9% 31.4%
(1) Includes approximately $1,224,000 and $725,000 of non-cash
compensation expense for the three months ended December 31, 2009 and
2008, respectively. For the twelve months ended December 31, 2009 and
2008, it includes approximately $5,152,000 and $4,149,000 of non-cash
compensation expense, respectively.
(2) This earnings release contains references to the non-GAAP financial
measure of earnings (net income) before interest, taxes, depreciation
and amortization, or "EBITDA." EBITDA should not be considered in
isolation or as a substitute for operating income, net income or
loss, cash flows provided by operating, investing and financing
activities, or other income or cash flow statement data prepared in
accordance with GAAP. However, Basic believes EBITDA is a useful
supplemental financial measure used by its management and directors
and by external users of its financial statements, such as investors,
to assess:
-- The financial performance of its assets without regard to financing
methods, capital structure or historical cost basis;
-- The ability of its assets to generate cash sufficient to pay interest
on our indebtedness; and
-- Its operating performance and return on invested capital as compared
to those of other companies in the well servicing industry, without
regard to financing methods and capital structure.
EBITDA has limitations as an analytical tool and should not be considered an alternative to net income, operating income, cash flow from operating activities or any other measure of financial performance or liquidity presented in accordance with GAAP. EBITDA excludes some, but not all, items that affect net income and operating income, and these measures may vary among other companies. Limitations to using EBITDA as an analytical tool include:
-- EBITDA does not reflect its current or future requirements for capital
expenditures or capital commitments;
-- EBITDA does not reflect changes in, or cash requirements necessary to
service interest or principal payments on, its debt;
-- EBITDA does not reflect income taxes;
-- Although depreciation and amortization are non-cash charges, the
assets being depreciated and amortized will often have to be replaced
in the future, and EBITDA does not reflect any cash requirements for
such replacements; and
-- Other companies in its industry may calculate EBITDA differently than
Basic does, limiting its usefulness as a comparative measure.
The following table presents a reconciliation of net income to EBITDA, which is the most comparable GAAP performance measure, for each of the periods indicated:
Three months Twelve months
Ended Ended
December 31, December 31,
Reconciliation of Net 2009 2008 2009 2008
Income (Loss) to EBITDA: (Unaudited) (Unaudited)
Net income (loss) $(24,152) $3,927 $(253,528) $68,238
Income taxes (13,314) 15,881 (87,529) 55,134
Net interest expense 11,444 6,338 32,386 24,630
(Gain) loss on disposal of
assets 797 284 2,650 76
Depreciation and amortization 33,915 32,572 132,520 118,607
------ ------ ------- -------
EBITDA $8,690 $59,002 $(173,501) $266,685
====== ======= ========= ========
The following table presents a reconciliation of net income to "Adjusted EBITDA," which means our EBITDA excluding the goodwill impairment charge and deferred debt costs write-off in 2009:
Three months Twelve months
Ended Ended
Reconciliation of Net December 31, December 31,
Income (Loss) to Adjusted 2009 2008 2009 2008
EBITDA: (Unaudited) (Unaudited)
Net income (loss) $(24,152) $3,927 $(253,538) $68,238
Goodwill impairment - 22,522 204,014 22,522
Merger-related income - (19,700) - (11,830)
Loss on early extinguishment
of debt - - 3,481 -
Income taxes (13,314) 15,881 (87,529) 55,134
Net interest expense 11,444 6,338 32,386 24,630
(Gain) loss on disposal of
assets 797 284 2,650 76
Depreciation and amortization 33,915 32,572 132,520 118,607
------ ------ ------- -------
Adjusted EBITDA $8,690 $61,824 $33,984 $277,377
====== ======= ======= ========
We believe Adjusted EBITDA is useful for management and investors in connection with comparisons of EBITDA excluding the items represented by the goodwill impairment charges and deferred debt costs write-offs in 2009.
DATASOURCE: Basic Energy Services, Inc.
CONTACT: Alan Krenek, Chief Financial Officer of Basic Energy Services,
Inc., +1-432-620-5510; or Jack Lascar or Sheila Stuewe, both of DRG&E,
+1-713-529-6600, for Basic Energy Services, Inc.
Web Site: http://basicenergyservices.com/