Think of the Linear Regression for a graph as the 'line of best fit'. This line is fitted for the on-screen data at any one time, including any date ahead of it, and so does not take into account any data not shown on the graph, in the past. The way in which the Linear Regression line is calculated, is by the method of least squares. It calculates the relationship between our two variables, time and price level.
No Parameters.
Linear Regression

Here is an example of the Linear Regression chart study (on a London Stock Exchange graph)
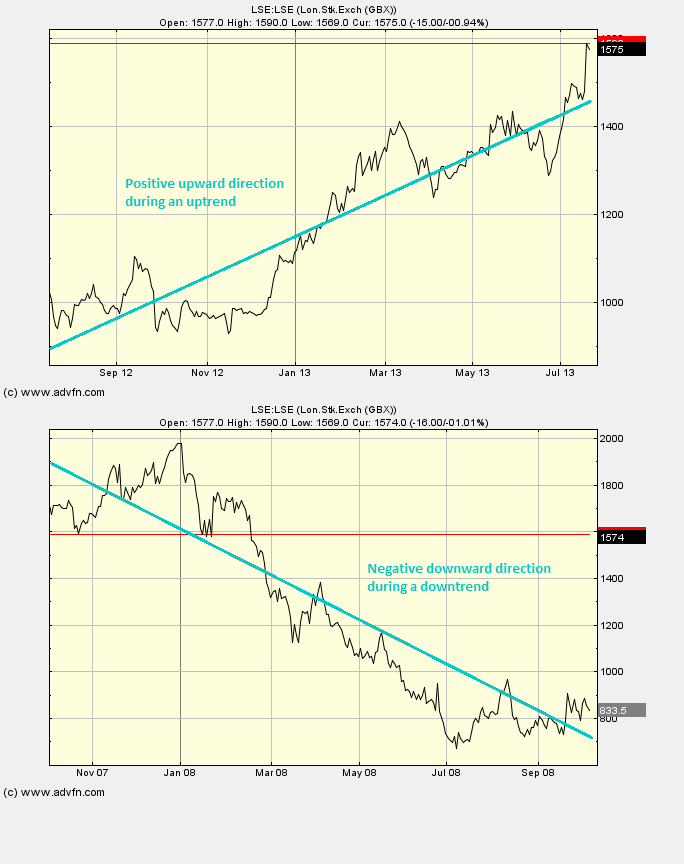
If there is an uptrend, then the linear regression line will be seen to move in a positive, upward direction. Conversely for a downtrend. The gradient of the line is an indication of how positive/negative the trend is.
Linear Regression uptrend and downtrend

Here is an example of a Linear Regression with the price line (of the London Stock Exchange), and what it may indicate

It looks like you are not logged in. Click the button below to log in and keep track of your recent history.
Support: +44 (0) 203 8794 460 | support@advfn.com
By accessing the services available at ADVFN you are agreeing to be bound by ADVFN's Terms & Conditions