Click here to read about Moving Averages.
It can sometimes be useful to plot multiple Simple Moving Averages with varying time periods, and offsets. This is because buy/sell indicators can come about when SMAs, with different time periods, crossover. Furthermore a crossover can happen either when a faster moving (i.e. shorter time period) SMA crosses a slower SMA from above, or from below.
A SMA with a longer time period will be smoother than a SMA with a shorter time period, and will show the long(er)-term trend, whether this be upward or downward.
3 SMAs can be used for even more confirmation, again looking at the crossovers. For example, there may be an uptrend in the market, so when a short-term SMA crosses a medium-term SMA from above, this could be a warning that prices may be turning. Then when the medium-term SMA crosses the long-term SMA from above, you sell.
Parameters: Period & Offset for 3 variables. Choice between SMA and Exponential Moving Average (EMA).
For additional help on what the different parameters mean, that isn't included on this page, click here.
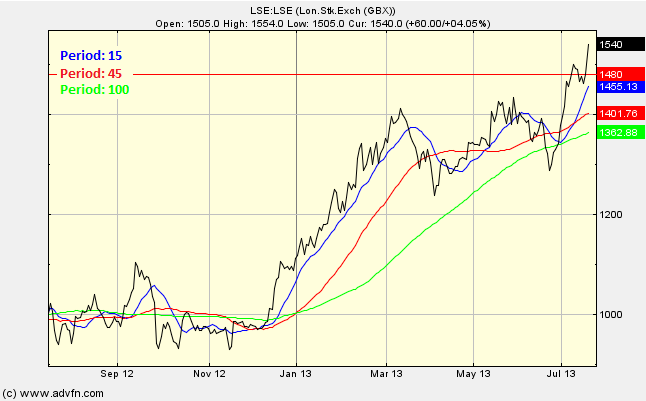
Multiple Moving Averages

Here is an example of Multiple Moving Averages chart study (on a London Stock Exchange graph)
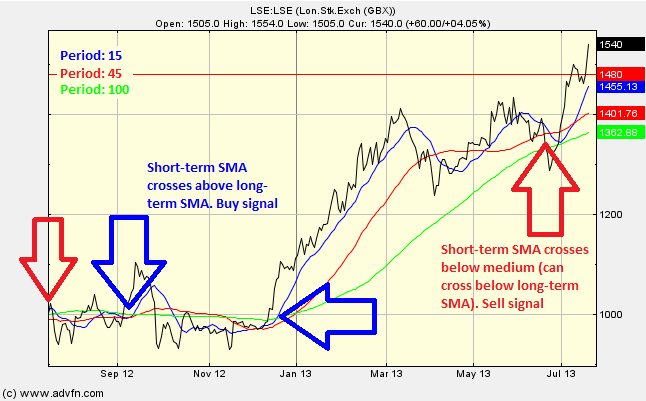
If an uptrend is prevalent, then typically when a shorter-term SMA crosses above a longer-term SMA then this is a buy signal. Conversely when a shorter-term SMA crosses below a longer-term SMA. Vice versa for a downtrend. For example you could have a long-term 200 day SMA, and a short-term 50 day SMA.
Multiple Moving Averages Crossings

Here is an example of Multiple Moving Averages crossing the price line (of the London Stock Exchange), and what it may indicate

It looks like you are not logged in. Click the button below to log in and keep track of your recent history.
Support: +44 (0) 203 8794 460 | support@advfn.com
By accessing the services available at ADVFN you are agreeing to be bound by ADVFN's Terms & Conditions