ADVFN Logo ADVFN

We could not find any results for:
Make sure your spelling is correct or try broadening your search.

Trending Now

Toplists

It looks like you aren't logged in.
Click the button below to log in and view your recent history.

Hot Features

Registration Strip Icon for default Register for Free to get streaming real-time quotes, interactive charts, live options flow, and more.

SCH Safecharge International Group Limited

435.00
0.00 (0.00%)
07 Jun 2024 - Closed
Delayed by 15 minutes
Share Name Share Symbol Market Type Share ISIN Share Description
Safecharge International Group Limited LSE:SCH London Ordinary Share GG00BYMK4250 ORD USD0.0001
  Price Change % Change Share Price Bid Price Offer Price High Price Low Price Open Price Shares Traded Last Trade
  0.00 0.00% 435.00 0.00 01:00:00
Industry Sector Turnover Profit EPS - Basic PE Ratio Market Cap
0 0 N/A 0

Schwab Equity Ratings Research Finds Surprise Anticipation Strategy Can Increase Chances of Investment Success

13/10/2005 7:37pm

PR Newswire (US)


Safecharge (LSE:SCH)
Historical Stock Chart


From Jun 2019 to Jun 2024
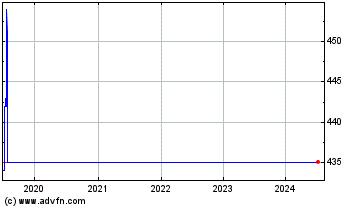
Click Here for more Safecharge Charts.
Why analysts can miss the mark by focusing on earnings-per-share growth SAN FRANCISCO, Oct. 13 /PRNewswire-FirstCall/ -- As earnings reporting season returns, the research team for Schwab Equity Ratings(R), Charles Schwab & Co.'s proven approach to stock selection, is highlighting "surprise anticipation" as a key factor investors should consider when evaluating potential investment strategies. According to Greg Forsythe, senior vice president and director of Schwab Equity Ratings, focusing on a stock's likelihood to post future earnings surprises can provide an edge when evaluating which stocks to buy or sell. "Individual investors and even professional equity analysts often get sub- par performance when they mistakenly place too much emphasis in their equity research on factors like high earnings-per-share growth," said Forsythe. "The problem is that stocks with high historical EPS growth rates and the highest forecasts of future EPS growth are the most likely to report negative earnings surprises." How to find stocks that may surprise the street The goods news is that "surprise anticipation" is not an oxymoron. To find stocks most likely to report positive surprises, the secret is to look for signs of low, but rising expectations. As a first step, Forsythe recommends investors consider the following factors to identify stocks with low expectations: -- Low price multiples, as measured by metrics such as price-to-earnings, price-to-book and price-to-sales -- Management returning cash to investors in the form of dividends, share buybacks or debt repayment -- Insiders or short sellers buying shares -- Visible company problems or issues The next step is to examine the low expectation stocks for signs of improving expectations, including recent positive analyst forecast revisions, recent stock price outperformance, growing free cash flow, and improving earnings quality. Comerica (CMA), Norfolk Southern (NSC), Raytheon (RTN), and VF Corp (VFC) are examples of companies that, in Forsythe's view, have a good chance of posting a positive surprise in coming days. For Important Disclosures and Regulation Analyst Certification, see end of News Release. On the opposite end of the spectrum, stocks with high but falling expectations should be avoided. Forsythe says the following signs of high expectations may warn of a negative earnings surprise: -- High one-year and five-year EPS growth forecasts -- High price multiples, especially when EPS is negative -- Management expanding capital base by issuing shares or debt, and heavily reinvesting through acquisitions, research and development and capital expenditures -- Consensus analyst rating of "buy," especially when supported by an exciting story -- Company has great reputation Among high expectation stocks meeting these criteria, Forsythe points to those with negative analyst forecast revisions, recent price underperformance, falling or negative free cash flow, and declining earnings quality as having the greatest chance for a negative surprise. He cites Arch Coal (ACI), Expeditors International (EXPD), JetBlue Airways (JBLU), and Regal Entertainment (RGC) as examples. "By determining a company's likelihood to surprise and evaluating other predictive factors, Schwab Equity Ratings have been successful at identifying stocks with the highest potential for growth or decline," said Forsythe. About Schwab Equity Ratings Schwab Equity Ratings are objective ratings on approximately 3,000 U.S. headquartered stocks, more stocks than are rated by any other major brokerage firm. Stocks are assigned ratings of A, B, C, D, or F, with A's and B's considered "buys," D's and F's "sells," and C's holds. Ratings are generally updated each week to reflect new financial data and other information. On average, for all complete 52-week periods since Schwab Equity Ratings' inception (May 6, 2002) through September 19, 2005, A-rated stocks as a group have outperformed the average of all stocks as a group rated by Schwab Equity Ratings by 6.2 percentage points and outperformed the Dow Jones Wilshire 5000 Index by 18.1 percentage points. For more information on Schwab Equity Ratings, including performance details, how performance was calculated, comparison of performance to benchmarks and limitations of model performance, visit http://www.schwab.com/serperformance. About Charles Schwab The Charles Schwab Corporation (NYSE / Nasdaq: SCH), through its operating subsidiaries, provides securities brokerage and financial services to individual investors and the independent investment advisors who work with them. With over 7 million individual investor accounts and more than $1 trillion in client assets, The Charles Schwab Corporation is one of the nation's largest financial services firms. Its subsidiary Charles Schwab & Co., Inc. (member SIPC) provides a complete range of investment services and products, including an extensive selection of mutual funds; financial planning and investment advice; retirement plans; referrals to independent fee-based investment advisors; and custodial, operational and trading support for independent fee-based investment advisors. Its subsidiary Charles Schwab Bank, N.A. (member FDIC) provides banking and mortgage services and products. The Corporation's other operating subsidiaries include U.S. Trust Corporation (member FDIC) and CyberTrader(R), Inc. (member SIPC) .These companies' Web sites can be reached at http://www.schwab.com/, http://www.schwabbank.com/, http://www.ustrust.com/ and http://www.cybertrader.com/. (0005-4348) For important research disclosures on the companies listed in these materials, please write to Charles Schwab & Co, Inc. 101 Montgomery Street, Mail code 120 KNY-27-227, San Francisco CA 94104. Analyst Certification The views expressed in these materials accurately reflect Greg Forsythe's personal views about the applicable subject securities and issuers and no part of my compensation was, is or will be related to the specific recommendations or views contained in these materials. Limitations of Model Performance For all model performance results, there are inherent limitations which investors should understand. Unlike an actual performance record, simulated results do not represent actual investment performance or trading. Since the trades have not actually been executed, the results may not reflect the impact of certain market factors, including limited trading liquidity. No representation is being made that any investor will or is likely to achieve results similar to those shown. The results presented reflect past performance and should not and cannot be viewed as an indicator of future performance. The results shown are not an indicator of the returns a Schwab client would have realized or will realize in relying on Schwab Equity Ratings or any stock list or model mentioned. The Schwab Equity Ratings and stock lists or models are not personal recommendations for any particular investor and do not take into account the financial, investment, or other objectives, and may not be suitable for any particular investor. Before buying, investors should consider whether the investment is suitable for themselves and their portfolio. Additionally, investors should consider any recent market or company news. Stocks can be volatile and entail risk, and individual stocks may not be suitable for an investor. Indices are unmanaged, do not incur management fees and expenses, and cannot be invested in directly. Since ratings are generally updated weekly, new performance numbers are also calculated on a weekly basis but may be presented less frequently. Fifty- two week time periods were selected for tracking performance because Schwab Equity Ratings are meant to identify those stocks that will most likely outperform or underperform the broader market over the next 12 months. Over time, the model upon which ratings are based may be altered. How Performance Is Calculated Schwab calculates the total return for each stock in each A, B, C, D and F rating cohort by dividing the ending price plus dividends paid during the period, if any, by the starting price for a particular holding period, minus one. Returns are calculated based on the market closing prices on the Holding Period Start Date and the market closing prices on the Holding Period End Date. All stocks within a Schwab Equity Rating cohort are equal-weighted at the beginning of the performance calculation period, meaning each stock has the same value relative to any other stock. Performance is calculated assuming stocks are held for the entire holding period. After individual stock returns are calculated, Schwab averages the total returns for all of the stocks within a cohort during that time period to find the average return. Transaction costs such as brokerage commissions, fees or other expenses have not been deducted from the total return calculations. Results would have been lower if such costs were deducted. The amount of the actual commissions and other fees you may pay will vary depending on, among other things, the number of shares you buy and the way you execute the trade (such as via schwab.com or through a Schwab Investment Consultant). DATASOURCE: Charles Schwab CONTACT: Sondra Harris of Charles Schwab, +1-415-636-3292 or Web site: http://www.schwab.com/

Copyright

1 Year Safecharge Chart

1 Year Safecharge Chart

1 Month Safecharge Chart

1 Month Safecharge Chart