ADVFN Logo ADVFN

We could not find any results for:
Make sure your spelling is correct or try broadening your search.

Trending Now

Toplists

It looks like you aren't logged in.
Click the button below to log in and view your recent history.

Hot Features

Registration Strip Icon for charts Register for streaming realtime charts, analysis tools, and prices.

AEG Active Energy Group Plc

0.055
0.00 (0.00%)
26 Jul 2024 - Closed
Delayed by 15 minutes
Share Name Share Symbol Market Type Share ISIN Share Description
Active Energy Group Plc LSE:AEG London Ordinary Share GB00BPG7NS80 ORD GBP0.0035
  Price Change % Change Share Price Bid Price Offer Price High Price Low Price Open Price Shares Traded Last Trade
  0.00 0.00% 0.055 0.00 01:00:00
Industry Sector Turnover Profit EPS - Basic PE Ratio Market Cap
Business Services, Nec 0 -1.34M -0.0083 -0.06 89.02k

/FIRST AND FINAL ADD -- LNTH001 -- AEGON N.V. Earnings/

06/11/2008 10:06am

PR Newswire (US)


Active Energy (LSE:AEG)
Historical Stock Chart


From Jul 2019 to Jul 2024
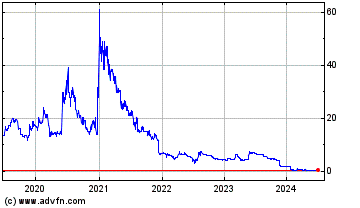
Click Here for more Active Energy Charts.
United Kingdom - Underlying earnings before tax declined 39% on lower fund related charges in the pension business - New life sales in line with last year; sales of annuities rise to record levels, up 4% at GBP 49 million - Higher margins lead to further increase in UK's value of new business Overview Lower corporate bond and equity markets led to a decline in earnings from the United Kingdom. New life sales held up well with annuities enjoying a record quarter. Value of new business also continued its recent strong growth, helped by a further improvement in margins during the third quarter. Underlying earnings before tax Underlying earnings before tax declined 39% in the third quarter to GBP 28 million, due primarily to the impact of lower equity and corporate bond markets on fund related charges in AEGON's unit linked pension business. - Earnings from Life & Protection decreased 25% to GBP 9 million as strong underlying growth was offset by an increase in expenses. - Earnings from Pensions & Asset Management were 34% lower, the result mainly of lower fund related charges. - Distribution activities saw a decline in earnings because of lower income from investment products and housing related sales. Net income Net income declined 61% to GBP 15 million in the third quarter, as a result of investment losses on bond sales and impairment charges arising from the collapse of US investment bank Lehman Brothers. AEGON did, however, benefit from a tax credit related to previous impairment charges. Commissions and expenses Total commissions and expenses were down 2%. Operating expenses meanwhile increased by 5% to GBP 100 million, due to investment in the business and higher employee pension expenses. Sales and deposits Overall, new life sales were broadly in line with the third quarter 2007, up 1% at GBP 303 million. Sales of annuities and group pensions were strong, though individual pensions weakened from their year-earlier levels. - Sales of annuities reached a record level, rising 4% in the third quarter to GBP 49 million annualized premium production, as AEGON continued its focus on the rapidly-growing at-retirement market. - Individual pensions saw a decline following strong sales last year - the result of exceptional activity following the UK's 'Pension A-day' in May 2006. Group pensions, meanwhile continued the growth trend. - Recent difficult conditions in world financial markets resulted in lower sales of retail mutual funds and third party managed assets as investors delayed investment decisions. Value of new business Value of new business increased 13% to GBP 45 million, as margins showed further improvement in the third quarter. AEGON's strategy in the United Kingdom is to move more of its business to high-margin areas, such as annuities. As a result, the internal rate of return on new business in the United Kingdom rose during the quarter from 12.8% to 13.6%. Please refer to page 29 for more detailed information on VNB. Revenue generating investments At the end of September 2008, revenue generating investments totaled GBP 47.6 billion, a decline of 6% from GBP 50.5 billion three months earlier. The decrease reflects the recent weakness in world financial markets. UNITED KINGDOM - EARNINGS Q3 Q3 Ytd Ytd GBP millions Notes 2008 2007 % 2008 2007 % Underlying earnings before tax by line of business *) Life 9 12 (25) 28 32 (13) Life and protection 9 12 (25) 28 32 (13) Pensions and asset management 21 32 (34) 76 102 (25) Distribution (2) 1 N.M. (4) 3 N.M. Share in net results of associates 0 1 N.M. 0 1 N.M. Underlying earnings before tax 28 46 (39) 100 138 (28) Gains/(losses) on investments (3) (1) (200) (1) (6) 83 Impairment charges (11) (1) N.M. (20) (1) N.M. Other income/(charges) 9 (7) 8 N.M. (42) 23 N.M. Income before tax 7 52 (87) 37 154 (76) Income tax attributable to policyholder return 7 (8) N.M. 42 (23) N.M. Income before income tax on shareholders return 14 44 (68) 79 131 (40) Income tax on shareholders return 1 (6) N.M. (7) 8 N.M. Net income 15 38 (61) 72 139 (48) Net underlying earnings 26 40 (35) 87 145 (40) Net operating earnings 26 40 (35) 87 145 (40) Commissions and expenses 160 164 (2) 489 470 4 of which operating expenses 100 95 5 300 282 6 *) In the United Kingdom, underlying earnings equals operating earnings. For the amounts in euro see the Financial Supplement. UNITED KINGDOM - SALES Q3 Q3 Ytd Ytd GBP millions Notes 2008 2007 % 2008 2007 % New life sales 10 Life single premiums 1,696 1,838 (8) 4,922 5,429 (9) Life recurring premiums annualized 134 118 14 441 364 21 Total recurring plus 1/10 single 303 302 0 933 907 3 Life 71 67 6 185 161 15 Pensions 232 235 (1) 748 746 0 Total recurring plus 1/10 single 303 302 0 933 907 3 Gross deposits (on and off balance) by line of business Pensions and asset management 86 183 (53) 390 560 (30) Total gross deposits 86 183 (53) 390 560 (30) Net deposits (on and off balance) by line of business Pensions and asset management (85) 20 N.M. (333) 138 N.M. Total net deposits (85) 20 N.M. (333) 138 N.M. REVENUE GENERATING INVESTMENTS At Sep. At June 30 30 Notes 2008 2008 % Revenue generating investments (total) 6 47,565 50,508 (6) Investments general account 4,678 4,406 6 Investments for account of policyholders 40,587 43,592 (7) Off balance sheet investments third parties 2,300 2,510 (8) For the amounts in euro see the Financial Supplement. Other Countries - Underlying earnings before tax declined 24% to EUR 42 million - Core businesses perform well, despite troubled financial environment - Pension business in Central & Eastern Europe shows continued growth; pension fund members top 2 million - Deposits up strongly on new asset management joint venture in China Overview Other countries' core businesses - Pensions & Asset Management and Life & Protection - performed well in the third quarter, but earnings were affected by continued volatility in world financial markets. Deposits rose sharply as a result of the inclusion of AEGON's new asset management joint venture in China, an increase in variable annuity deposits in Taiwan as well as continued strong growth in the company's pension business in Central & Eastern Europe. Life sales were 47% lower, primarily because of uncertainty over equity markets and a shift in business mix in Taiwan. As a result, value of new business was also down. Underlying earnings before tax Underlying earnings before tax from Other countries declined 24% to EUR 42 million in the third quarter. - Earnings from Other countries' two core businesses - Pensions & Asset Management and Life & Protection - held up well, despite the difficult financial environment. - The inclusion of AEGON's new asset management joint venture in China boosted earnings from mutual funds. - Earnings from General Insurance, however, were lower because of higher claims payments and reserve strengthening in Hungary following severe storms during the summer. - Earnings from associate companies also declined as a result of: - Impairment charges at CAM, AEGON's Spanish associate, related to the bankruptcy of US investment bank Lehman Brothers. - Additional start-up costs at AEGON's new life insurance joint venture in India. - Lower contribution from La Mondiale, AEGON's French partner. Net income Net income was sharply lower in the third quarter, down 80% at EUR 9 million. This was primarily the result of impairments related to Lehman Brothers and Washington Mutual, as well as losses on certain derivative products. Commissions and expenses Commission and expenses rose 38% in the third quarter to EUR 112 million. - Operating expenses increased 20% as a result of continued growth in AEGON's pension business in Central & Eastern Europe and further Investment in the company's bank distribution operations in Spain. - Commissions, meanwhile, were down 9%. - Amortization of DAC - deferred acquisition costs - rose mainly as a result of higher surrenders in Poland and the introduction of DAC in the life business in Slovakia. - Deferred expenses declined, primarily because of lower production in Poland. Sales New life sales in the third quarter declined 47% to EUR 52 million. - In Central & Eastern Europe, sales of recurring premium life insurance rose 53% thanks to particularly strong performances in Poland, the Czech Republic and Slovakia. Single premium sales in Poland were sharply lower, however, because of increased equity market volatility. Total new life sales in Central & Eastern Europe amounted to EUR 27 million, down 21%. - In Spain, sales of life insurance rose to EUR 14 million, due primarily to the extraordinary activity in AEGON's Spanish life business, following changes in pension legislation. - AEGON's largest bank partner in Spain, which is an associate and therefore not consolidated, also enjoyed a particularly strong quarter, with sales of EUR 41 million (on a 100% basis), up 57% compared to last year. - In Asia, new life sales decreased to EUR 12 million as a result of significantly lower equity markets and the ongoing shift in sales from traditional to unit-linked products. In China, sales declined because of the adverse impact of last summer's Olympic Games and continued equity market volatility. General insurance Non-life sales in Hungary more than doubled from their year-ago levels to EUR 13 million. Deposits Gross deposits rose 132% in the third quarter to EUR 474 million. Net deposits were down 17% at EUR 113 million. The increase in deposits reflects: - The inclusion of AEGON's new asset management joint venture in China. - Strong growth in the company's pension business in Central & Eastern Europe. The number of pension fund members across the region at the end Of the quarter is over 2 million. - Higher variable annuity deposits in Taiwan. Value of new business VNB from Other countries decreased to EUR 32 million primarily as a result of lower sales. In Asia, the decrease in VNB was due largely to lower production and a change in product mix in Taiwan. In Central & Eastern Europe, VNB was down 5% as sales of single premium unit-linked policies in Poland continued to be adversely affected by weak equity markets. In Spain, VNB decreased mainly to lower margins. Please refer to page 29 for more detailed VNB information. Revenue generating investments At the end of September, revenue generating investments totaled EUR 14.2 billion, up from EUR 14.0 billion three months before. OTHER COUNTRIES - EARNINGS Q3 Q3 Ytd Ytd EUR millions Notes 2008 2007 % 2008 2007 % Underlying earnings before tax by line of business *) Life 29 30 (3) 52 48 8 Accident and health 1 2 (50) 4 4 0 Life and protection 30 32 (6) 56 52 8 Variable annuities 0 0 N.M. (1) 0 N.M. Saving products (1) 0 N.M. 0 (1) N.M. Retail mutual funds 5 1 N.M. 10 2 N.M. Individual savings and retirement products 4 1 N.M 9 1 N.M. Pensions and asset management 4 3 33 10 12 (17) General insurance 7 11 (36) 25 31 (19) Share in net results of associates (3) 8 N.M. 10 24 (58) Underlying earnings before tax 42 55 (24) 110 120 (8) Gains/(losses) on investments (5) 8 N.M. 0 13 N.M. Impairment charges (18) 0 N.M. (19) 0 N.M. Other income/(charges) 0 (1) N.M. 0 (1) N.M. Income before tax 19 62 (69) 91 132 (31) Income tax (10) (16) 38 (34) (51) 33 Net income 9 46 (80) 57 81 (30) Net underlying earnings 30 39 (23) 74 70 6 Net operating earnings 30 39 (23) 74 70 6 Commissions and expenses 112 81 38 319 251 27 of which operating expenses 53 44 20 145 125 16 *) In Other countries, underlying earnings equals operating earnings. OTHER COUNTRIES - SALES Q3 Q3 Ytd Ytd EUR millions Notes 2008 2007 % 2008 2007 % New life sales 10 Life single premiums 83 293 (72) 376 814 (54) Life recurring premiums annualized 43 69 (38) 137 183 (25) Total recurring plus 1/10 single 52 99 (47) 175 265 (34) Life 52 99 (47) 174 264 (34) Saving products 0 0 N.M. 1 1 0 Total recurring plus 1/10 single 52 99 (47) 175 265 (34) New premium production accident and health insurance 1 2 (50) 4 5 (20) New premium production general insurance 13 6 117 30 17 76 Gross deposits (on and off balance) Variable annuities 34 1 N.M. 116 4 N.M. Retail mutual funds 218 50 N.M. 606 111 N.M. Pensions and asset management 222 153 45 526 417 26 Total gross deposits 474 204 132 1,248 532 135 Net deposits (on and off balance) Variable annuities 31 1 N.M. 108 3 N.M. Retail mutual funds (1) 37 N.M. 115 75 53 Pensions and asset management 83 98 (15) 256 285 (10) Total net deposits 113 136 (17) 479 363 32 REVENUE GENERATING INVESTMENTS At Sep. At June 30 30 Notes 2008 2008 % Revenue generating investments (total) 6 14,154 13,995 1 Investments general account 5,399 5,086 6 Investments for account of policyholders 2,600 2,732 (5) Off balance sheet investments third parties 6,155 6,177 (0) Appendix II - Tables NET UNDERLYING EARNINGS GEOGRAPHICALLY Q3 Q3 Ytd Ytd EUR millions Notes 2008 2007 % 2008 2007 % Americas 266 357 (25) 935 1,077 (13) The Netherlands 62 94 (34) 246 243 1 United Kingdom 33 58 (43) 112 214 (48) Other countries 30 39 (23) 74 70 6 Holding and other (28) (17) (65) (64) (87) 26 Net underlying earnings 363 531 (32) 1,303 1,517 (14) OVER/UNDER PERFORMANCE OF FAIR VALUE ITEMS EUR millions Operating earnings before tax 116 673 (83) 1,116 2,056 (46) (Over)/under performance of fair value items - Americas 453 (9) N.M. 727 (106) N.M. (Over)/under performance of fair value items - The Netherlands 54 27 100 106 22 N.M. (Over)/under performance of fair value items - Holding and other (123) - N.M. (195) - N.M. Underlying earnings before tax 500 691 (28) 1,754 1,972 (11) Net underlying earnings 363 531 (32) 1,303 1,517 (14) AMERICAS - OVER/UNDER PERFORMANCE OF FAIR VALUE ITEMS USD millions Over/(under) performance of fair value items by line of business Life and protection (96) 14 N.M. (104) 43 N.M. Individual savings and retirement products (235) 27 N.M. (466) 53 N.M. Pensions and asset management (22) 3 N.M. (25) 11 N.M. Institutional products (204) (33) N.M. (368) 12 N.M. Life reinsurance (128) 2 N.M. (141) 23 N.M. Total over/(under) performance of fair value items (685) 13 N.M.(1,104) 142 N.M. Total over/(under) performance of fair value items in EUR (453) 9 N.M. (727) 106 N.M. THE NETHERLANDS - OVER/UNDER PERFORMANCE OF FAIR VALUE ITEMS EUR millions Over/(under) performance of fair value items by line of business Pensions and asset management (54) (27) (100) (106) (22) N.M. Total over/(under) performance of fair value items (54) (27) (100) (106) (22) N.M. EXPLANATION Certain assets held by AEGON Americas and AEGON The Netherlands are carried at fair value, and managed on a total return basis, with no offsetting changes in the valuation of related liabilities. These include assets such as hedge funds, private equities, real estate limited partnerships, convertible bonds and structured products. Underlying earnings exclude any over- or underperformance compared to management's long-term expected return on these assets. Based on current holdings and asset class returns, the long-term expected return on an annual basis is 8-10%, depending on the asset class, including cash income and market value changes. The expected earnings from these assets classes are net of DPAC where applicable. In addition, certain products offered by AEGON Americas contain guarantees and are reported on a fair value basis, including the segregated funds offered by AEGON Canada and the total return annuities and guarantees on variable annuities of AEGON USA. The earnings on these products are impacted by movements in equity markets and risk free interest rates. Short-term developments in the financial markets may therefore cause volatility in earnings. Included in underlying earnings is a long-term expected return on these products and any over- or underperformance compared to management's expected return is excluded from underlying earnings. The Holding includes certain issued bonds that are held at fair value through profit or loss. The interest rate risk on these bonds is hedged using swaps. The change in AEGON's credit spread resulted in a gain of EUR 123 mln in Q3 2008 on the fair value movement on these bonds. SALES Q3 Q3 Ytd Ytd EUR millions 2008 2007 % 2008 2007 % New life sales 618 847 (27) 2,033 2,474 (18) Gross deposits (on and off balance) 11,051 12,056 (8) 28,818 34,934 (18) New life sales Life single premiums 2,568 3,794 (32) 8,205 10,967 (25) Life recurring premiums annualized 361 467 (23) 1,212 1,377 (12) Total recurring plus 1/10 single 618 847 (27) 2,033 2,474 (18) Life 272 357 (24) 836 972 (14) Saving products 0 0 N.M. 1 1 0 Pensions 308 396 (22) 1,058 1,221 (13) BOLI/COLI 1 29 (97) 14 87 (84) Life reinsurance 37 65 (43) 124 193 (36) Total recurring plus 1/10 single 618 847 (27) 2,033 2,474 (18) New premium production accident and health insurance 146 166 (12) 453 502 (10) New premium production general insurance 19 12 58 51 37 38 Gross deposits (on and off balance) Fixed annuities 1,200 363 N.M. 2,381 712 N.M. Variable annuities 644 679 (5) 2,046 2,103 (3) Saving products 547 647 (15) 1,883 1,944 (3) Retail mutual funds 725 512 42 2,197 1,650 33 Pensions and asset management 2,248 2,861 (21) 7,892 8,946 (12) Institutional guaranteed products 5,687 6,992 (19) 12,417 19,577 (37) Life reinsurance 0 2 N.M. 2 2 0 Total gross deposits 11,051 12,056 (8) 28,818 34,934 (18) Net deposits (on and off balance) by line of business Fixed annuities 297 (979) N.M. (522) (3,629) 86 Variable annuities (73) (123) 41 (327) (439) 26 Saving deposits (206) 22 N.M. (164) 137 N.M. Retail mutual funds 185 141 31 772 531 45 Pensions and asset management 162 690 (77) 1,512 1,446 5 Institutional guaranteed products 1,300 2,965 (56) 506 4,306 (88) Life reinsurance (13) 0 N.M. (42) 0 N.M. Total net deposits 1,652 2,716 (39) 1,735 2,352 (26) EMPLOYEE NUMBERS At At At Sep. 30 At Dec. 31 2008 2007 Number of employees 31,888 30,414 VALUE OF NEW BUSINESS AND IRR VNB VNB VNB VNB EUR EUR EUR EUR EUR millions, Q3 Q3 Ytd Ytd after tax Notes 2008 2007 % 2008 2007 % Americas 109 109 0 288 321 (10) The Netherlands 8 11 (27) 31 41 (24) United Kingdom 57 58 (2) 174 174 0 Asia 1 24 (96) 15 58 (74) Central and Eastern Europe 19 20 (5) 60 53 13 Other European Countries 11 13 (15) 36 55 (35) Total 206 235 (12) 604 702 (14) IRR % IRR% Americas 12.3 13.7 The Netherlands 11.5 9.8 United Kingdom 13.6 12.8 Asia 15.6 14.7 Central and Eastern Europe 46.8 49.6 Other European Countries 47.3 37.1 Total 17.7 17.8 MODELED NEW BUSINESS, APE AND DEPOSITS Premium business Premium business APE APE EUR millions Notes Q3 2008 Q3 2007 % Ytd 2008 Ytd 2007 % 11 Americas 255 355 (28) 817 977 (16) The Netherlands 55 78 (29) 225 201 12 United Kingdom 371 441 (16) 1,173 1,318 (11) Asia 12 53 (77) 49 127 (61) Central and Eastern Europe 30 35 (14) 83 92 (10) Other European Countries 46 49 (6) 164 171 (4) Total 769 991 (22) 2,511 2,887 (13) Deposit business Deposit business Deposits Deposits Americas 8,808 10,569 (17) 21,432 29,463 (27) Asia 6 1 N.M. 20 2 N.M. Central and Eastern Europe 16 7 129 46 18 156 Other European Countries 1 1 0 10 8 25 Total 8,832 10,578 (17) 21,507 29,491 (27) VNB/PVNBP SUMMARY Premium business Premium business VNB PVNBP VNB/ VNB/ VNB PVNBP VNB/ VNB/ PVNBP APE PVNBP APE EUR millions Notes Q3 2008 % % Ytd 2008 % % 12 Americas 42 1,248 3.3 16.4 139 4,082 3.4 17.0 The Netherlands 8 389 2.1 15.2 31 1,847 1.7 13.6 United Kingdom 57 2,621 2.2 15.4 174 8,034 2.2 14.8 Asia 2 59 4.2 20.5 15 278 5.4 30.6 Central and Eastern Europe 14 175 7.8 45.5 39 516 7.5 46.7 Other European Countries 11 347 3.2 23.6 36 1,330 2.7 22.2 Total 134 4,839 2.8 17.5 433 16,087 2.7 17.2 Deposit business Deposit business VNB PVNBP VNB/ VNB/ VNB PVNBP VNB/ VNB/ PVNBP Deposits PVNBP Deposits 12 Americas 67 9,819 0.7 0.8 149 24,108 0.6 0.7 Asia (1) 44 (2.3) (17.8) 0 156 0.2 1.7 Central and Eastern Europe 6 150 3.7 34.1 22 670 3.2 47.3 Other European Countries 0 1 3.6 3.6 0 10 3.3 3.3 Total 72 10,014 0.7 0.8 172 24,943 0.7 0.8 Notes: 1) Certain assets held by AEGON Americas and AEGON The Netherlands are carried at fair value, and managed on a total return basis, with no offsetting changes in the valuation of related liabilities. These include assets such as hedge funds, private equities, real estate limited partnerships and convertible bonds. Underlying earnings exclude any over- or underperformance compared to management's long-term expected return on these assets. In addition, certain products offered by AEGON Americas contain guarantees and are reported on a fair value basis, including the segregated funds offered by AEGON Canada and the total return annuities and guarantees on variable annuities of AEGON USA. The earnings on these products are impacted by movements in equity markets and risk free interest rates. Short-term developments in the financial markets may therefore cause volatility in earnings. Included in underlying earnings is a long-term expected return on these products and any over- or underperformance compared to management's expected return is excluded from underlying earnings. The Holding includes certain issued bonds that are held at fair value through profit or loss. The interest rate risk on these bonds is hedged using swaps. The change in AEGON's credit spread resulted in a gain of EUR 123 million in Q3 2008 on the fair value movement on these bonds. Underlying earnings exclude this amount. 2) Net income refers to net income attributable to equity holders of AEGON N.V. 3) New life sales is defined as new recurring premiums + 1/10 of single premiums. 4) Deposits on and off balance sheet. 5) Return on equity is calculated by dividing the net underlying earnings after cost of leverage by the average shareholders' equity excluding the preferred shares and the revaluation reserve. 6) As of 2008, real estate for own use (both general account and for account of policyholders) has been reclassified from revenue generating investments to other assets. 7) Capital securities that are denominated in foreign currencies are, for purposes of calculating the capital base ratio, revalued to the period-end exchange rate. 8) All ratios exclude AEGON's revaluation reserve. Included in other non-operating income/(charges) are charges made to 9) policyholders with respect to income tax. There is an equal and opposite tax charge which is reported in the line Income tax attributable to policyholder return. Includes production on investment contracts without a discretionary 10) participation feature of which the proceeds are not recognized as revenues but are directly added to our investment contract liabilities. 11) APE = recurring premium + 1/10 single premium. 12) PVNBP: Present Value New Business Premium. Appendix III - Financial Information CONDENSED CONSOLIDATED BALANCE SHEET At Sep. 30 At Dec. 31 2008 2007 % EUR millions Investments general account 131,738 132,861 (1) Investments for account of policyholders 121,346 142,384 (15) Investments in associates 497 472 5 Deferred expenses and rebates 12,777 11,488 11 Other assets and receivables 21,435 18,484 16 Cash and cash equivalents 9,030 8,431 7 Total assets 296,823 314,120 (6) Shareholders' equity 9,412 15,151 (38) Other equity instruments 4,693 4,795 (2) Minority interest 18 16 13 Group equity 14,123 19,962 (29) Insurance contracts general account 93,070 88,496 5 Insurance contracts for account of policyholders 67,650 78,394 (14) Investment contracts general account 36,838 36,089 2 Investment contracts for account of policyholders 54,206 63,756 (15) Other liabilities 30,936 27,423 13 Total equity and liabilities 296,823 314,120 (6) CAPITAL BASE Group equity 14,123 19,962 (29) Trust pass-through securities 139 143 (3) Subordinated borrowings 34 34 0 Senior debt related to insurance activities 1,395 1,255 11 Total capital base 15,691 21,394 (27) CONDENSED CONSOLIDATED INCOME STATEMENT EUR millions (except per share data) Q3 Q3 Ytd Ytd Notes 2008 2007 % 2008 2007 % Premium income 5,274 6,573 (20) 17,181 20,222 (15) Investment income 2,463 2,648 (7) 7,321 7,824 (6) Fee and commission income 408 468 (13) 1,266 1,405 (10) Other revenues 1 7 (86) 4 12 (67) Total revenues 8,146 9,696 (16) 25,772 29,463 (13) Income from reinsurance ceded 401 350 15 1,150 1,191 (3) Results from financial transactions (9,358) 1,536 N.M. (20,566) 5,516 N.M. Other income 5 0 N.M. 5 212 (98) Total income (806) 11,582 N.M. 6,361 36,382 (83) Benefits and expenses (1,074) 10,726 N.M. 5,212 33,507 (84) Impairment charges 444 64 N.M. 579 79 N.M. Interest charges and related fees 164 118 39 370 325 14 Other charges 2 0 N.M. 2 181 (99) Total charges (464) 10,908 N.M. 6,163 34,092 (82) Share in net results of associates (1) 8 N.M. 19 25 (24) Income before tax (343) 682 N.M. 217 2,315 (91) Income tax 14 (141)N.M. (117) (412) 72 Net income attributable to equity holders of AEGON N.V. (329) 541 N.M. 100 1,903 (95) Net income per common share Basic earnings per share (0.25) 0.31 N.M. (0.10) 1.07 N.M. Dilluted earnings per share (0.25) 0.31 N.M. (0.10) 1.07 N.M. CONDENSED CONSOLIDATED STATEMENT OF CHANGES IN EQUITY At Sep. 30 At Sep. 30 At Dec. 31 2008 2007 2007 EUR millions Notes Shareholders' equity at January 1 15,151 18,605 18,605 Net income 100 1,903 2,551 Movements in foreign currency translations reserve 129 (904) (1,445) Movements in revaluation reserves (4,942) (1,571) (2,164) Total recognized net income for the period (4,713) (572) (1,058) Dividends paid on ordinary shares (548) (688) (583) Preferred dividend (112) (85) (85) Repurchased and sold own shares (217) (666) (1,438) Coupons on perpetuals (net of tax) (140) (124) (175) Other changes (9) (210) (115) Shareholders' equity at end of period 9,412 16,260 15,151 CONDENSED CONSOLIDATED CASH FLOW STATEMENT Q3 Q3 Ytd Ytd EUR millions Notes 2008 2007 % 2008 2007 % Cash flow from operating activities (3,005) (5,191) 42 1,774 (2,923) N.M. Cash flow from investing activities Purchase and disposal of intangible assets (2) (3) 33 (6) (6) 0 Purchase and disposal of equipment and other assets (14) (1) N.M. 90 (20) N.M. Purchase, disposal and dividends of subsidiaries and associates 13 63 (79) (164) (1,660) 90 (3) 59 N.M. (80) (1,686) 95 Cash flow from financing activities Issuance and purchase of share capital (142) (384) 63 (217) (666) 67 Dividends paid (258) (333) 23 (660) (773) 15 Issuance, repayment and coupons of perpetuals (178) 688 N.M. (301) 577 N.M. Issuance, repayment and finance interest on borrowings 541 (235) N.M. 720 1,085 (34) (37) (264) 86 (458) 223 N.M. Net increase/(decrease) in cash and cash equivalents (3,045) (5,396) 44 1,236 (4,386) N.M. AMOUNTS PER COMMON SHARE Q3 Q3 Ytd Ytd Notes 2008 2007 % 2008 2007 % Net income in EUR 1 (0.25) 0.31 N.M. (0.10) 1.07 N.M. Net income fully diluted in EUR 1 (0.25) 0.31 N.M. (0.10) 1.07 N.M. Net income in USD (0.38) 0.43 N.M. (0.15) 1.44 N.M. Net income fully diluted in USD (0.38) 0.43 N.M. (0.15) 1.44 N.M. Net operating earnings in EUR 1 0.03 0.30 (90) 0.40 0.86 (53) Net operating earnings fully diluted in EUR 1 0.03 0.30 (90) 0.40 0.86 (53) Net operating earnings in USD 0.04 0.42 (90) 0.61 1.16 (47) Net operating earnings fully diluted in USD 0.04 0.42 (90) 0.61 1.16 (47) At At Sep. 30 Dec. 31 2008 2007 Shareholders' equity in EUR 2 4.82 8.69 (45) Shareholders' equity in USD 2 6.89 12.79 (46) NET INCOME PER COMMON SHARE CALCULATION EUR millions (except per share data) Q3 Q3 Ytd Ytd Notes 2008 2007 % 2008 2007 % Net income (329) 541 N.M. 100 1,903 (95) Preferred dividend 0 0 N.M. (112) (85) (32) Coupons on perpetuals (49) (41) (20) (140) (124) (13) Net income attributable to ordinary shareholders (378) 500 N.M. (152) 1,694 N.M. Weighted average number of common shares outstanding 1,504 1,576 (5) 1,504 1,576 (5) Net income per share (0.25) 0.31 N.M. (0.10) 1.07 N.M. Quarterly net income per common share first quarter 0.07 0.42 (83) 0.07 0.42 (83) second quarter 0.08 0.34 (76) 0.15 0.76 (80) third quarter (0.25) 0.31 N.M. (0.10) 1.07 N.M. fourth quarter 0.40 1.47 SEGMENT REPORTING Q3 Q3 Ytd Ytd EUR millions Notes 2008 2007 % 2008 2007 % Operating earnings before tax geographically Americas (65) 517 N.M. 580 1,596 (64) The Netherlands 20 80 (75) 197 287 (31) United Kingdom 35 67 (48) 128 204 (37) Other countries 42 55 (24) 110 120 (8) Holding and other activities 78 (45) N.M. 87 (149) N.M. Eliminations 6 (1) N.M. 14 (2) N.M. Total operating earnings before tax 116 673 (83) 1,116 2,056 (46) Revenues geographically Americas 3,218 4,038 (20) 9,701 11,830 (18) The Netherlands 1,419 1,478 (4) 5,202 4,999 4 United Kingdom 2,957 3,473 (15) 9,148 10,548 (13) Other countries 524 712 (26) 1,656 2,057 (19) Holding and other activities 58 45 29 171 156 10 Eliminations (30) (50) 40 (106) (127) 17 Total revenues 8,146 9,696 (16) 25,772 29,463 (13) Revenues Life insurance gross premiums 4,664 5,934 (21) 15,205 18,130 (16) Accident and health insurance 468 515 (9) 1,494 1,647 (9) General insurance 142 124 15 482 445 8 Total gross premiums 5,274 6,573 (20) 17,181 20,222 (15) Investment income 2,463 2,648 (7) 7,321 7,824 (6) Fee and commission income 408 468 (13) 1,266 1,405 (10) Other revenues 1 7 (86) 4 12 (67) Total revenues 8,146 9,696 (16) 25,772 29,463 (13) INVESTMENTS GEOGRAPHICALLY amounts in million EUR (unless otherwise stated) United The Americas Kingdom United USD GBP At September 30, 2008 Americas Netherlands Kingdom Investments 1,848 43 Shares 1,292 1,679 55 91,368 4,630 Bonds 63,880 17,374 5,859 19,164 5 Loans 13,399 10,201 6 14,017 0 Other financial assets 9,800 108 0 733 0 Investments in real estate 512 2,093 0 127,130 4,678 Investments general account 88,883 31,455 5,920 0 18,342 Shares 0 8,010 23,209 0 12,531 Bonds 0 10,397 15,855 68,420 2,332 Separate accounts and 47,836 0 2,951 investment funds 0 6,039 Other financial assets 0 1,159 7,641 0 1,343 Investments in real estate 0 0 1,700 68,420 40,587 Investments for account of 47,836 19,566 51,356 policyholders 195,550 45,265 Investments on 136,719 51,021 57,276 balance sheet 109,156 2,300 Off balance sheet 76,317 12,289 2,911 investments third parties 304,706 47,565 Total revenue generating 213,036 63,310 60,187 investments *) Investments 99,238 4,569 Available-for-sale 69,382 18,329 5,782 19,164 5 Loans 13,399 10,201 6 0 0 Held-to-maturity 0 0 0 76,415 39,348 Financial assets at fair 53,426 20,398 49,788 value through profit or loss 733 1,343 Investments in real estate 512 2,093 1,700 195,550 45,265 Total investments 136,719 51,021 57,276 on balance sheet Table cont. INVESTMENTS GEOGRAPHICALLY amounts in million EUR (unless otherwise stated) Holding, other Other activities & Total At September 30, 2008 countries eliminations EUR Investments Shares 181 57 3,264 Bonds 4,381 24 91,518 Loans 728 0 24,334 Other financial assets 109 0 10,017 Investments in real estate 0 0 2,605 Investments general account 5,399 81 131,738 Shares 211 (12) 31,418 Bonds 327 0 26,579 Separate accounts and 1,907 0 52,694 investment funds Other financial assets 155 0 8,955 Investments in real estate 0 0 1,700 Investments for account of 2,600 (12) 121,346 policyholders Investments on 7,999 69 253,084 balance sheet Off balance sheet 6,155 0 97,672 investments third parties Total revenue generating 14,154 69 350,756 investments *) Investments Available-for-sale 2,351 84 95,928 Loans 728 0 24,334 Held-to-maturity 2,246 0 2,246 Financial assets at fair 2,674 (15) 126,271 value through profit or loss Investments in real estate 0 0 4,305 Total investments 7,999 69 253,084 on balance sheet INVESTMENTS GEOGRAPHICALLY amounts in million EUR (unless otherwise stated) United The Americas Kingdom United USD GBP At December 31, 2007 Americas Netherlands Kingdom Investments 2,386 48 Shares 1,621 1,997 66 98,834 4,104 Bonds 67,138 18,225 5,595 19,813 5 Loans 13,459 8,517 7 12,890 0 Other financial 8,756 66 0 assets 755 0 Investments in 513 2,008 0 real estate 134,678 4,157 Investments 91,487 30,813 5,668 general account 0 23,291 Shares 0 9,736 31,757 0 13,360 Bonds 0 10,628 18,216 81,663 2,820 Separate accounts 55,474 0 3,845 and investment funds 0 4,785 Other financial assets 0 990 6,525 0 1,839 Investments in 0 0 2,508 real estate 81,663 46,095 Investments for 55,474 21,354 62,851 account of policyholders 216,341 50,252 Investments on 146,961 52,167 68,519 balance sheet 109,658 2,863 Off balance sheet 74,491 13,476 3,903 investments third parties 325,999 53,115 Total revenue 221,452 65,643 72,422 generating investments *) Investments 104,391 4,080 Available-for-sale 70,913 19,163 5,563 19,813 5 Loans 13,459 8,517 7 0 0 Held-to-maturity 0 0 0 91,382 44,328 Financial assets at 62,076 22,479 60,441 fair value through profit or loss 755 1,839 Investments in real 513 2,008 2,508 estate 216,341 50,252 Total investments on 146,961 52,167 68,519 balance sheet Table Cont. INVESTMENTS GEOGRAPHICALLY amounts in million EUR (unless otherwise stated) Holding, other Other activities & Total At December 31, 2007 countries eliminations EUR Investments Shares 181 70 3,935 Bonds 3,951 22 94,931 Loans 571 0 22,554 Other financial 98 0 8,920 assets Investments in 0 0 2,521 real estate Investments 4,801 92 132,861 general account Shares 212 (24) 41,681 Bonds 248 0 29,092 Separate accounts 2,165 0 61,484 and investment funds Other financial assets 104 0 7,619 Investments in 0 0 2,508 real estate Investments for 2,729 (24) 142,384 account of policyholders Investments on 7,530 68 275,245 balance sheet Off balance sheet 3,355 0 95,225 investments third parties Total revenue 10,885 68 370,470 generating investments *) Investments Available-for-sale 2,310 98 98,047 Loans 571 0 22,554 Held-to-maturity 1,876 0 1,876 Financial assets at 2,773 (30) 147,739 fair value through profit or loss Investments in real 0 0 5,029 estate Total investments on 7,530 68 275,245 balance sheet *) As of 2008, real estate for own use (both general account and for account of policyholders) has been reclassified from revenue generating investments to other assets. The comparative 2007 information has been adjusted accordingly. ASSETS AND CAPITAL GEOGRAPHICALLY amounts in million EUR (unless otherwise stated) United Americas Kingdom The United USD GBP Americas Netherlands Kingdom At September 30, 2008 226,585 51,215 Assets business units 158,418 59,587 64,804 Other assets Total assets on balance sheet 13,090 1,497 Capital in units 9,152 2,541 1,895 Total capital base Other net liabilities Total At December 31, 2007 243,946 55,495 Assets business units 165,713 62,009 75,668 Other assets Total assets on balance sheet 19,056 2,166 Capital in units 12,945 3,079 2,954 Total capital base Other net liabilities Total Table Cont. ASSETS AND CAPITAL GEOGRAPHICALLY amounts in million EUR (unless otherwise stated) United Americas Kingdom Other Total USD GBP countries EUR At September 30, 2008 226,585 51,215 Assets business units 9,881 292,690 Other assets 4,133 Total assets on 296,823 balance sheet 13,090 1,497 Capital in units 1,602 15,190 Total capital base 15,691 Other net liabilities (501) Total 15,190 At December 31, 2007 243,946 55,495 Assets business units 9,205 312,595 Other assets 1,525 Total assets on 314,120 balance sheet 19,056 2,166 Capital in units 1,413 20,391 Total capital base 21,394 Other net liabilities (1,003) Total 20,391 RECONCILIATION NON-GAAP MEASURES TO INCOME BEFORE TAX Q3 Q3 Ytd Ytd EUR millions Notes 2008 2007 % 2008 2007 % Net operating earnings 92 509 (82) 849 1,563 (46) Income tax on operating earnings 24 164 (85) 267 493 (46) Operating earnings before tax 116 673 (83) 1,116 2,056 (46) Net gains and losses on investments (47) 61 N.M. (312) 254 N.M. Other income 5 0 N.M. 5 212 (98) Impairment charges (407) (62) N.M. (537) (59) N.M. Other charges (2) (1) (100) (2) (182) 99 Policyholder tax (8) 11 N.M. (53) 34 N.M. Income before tax (343) 682 N.M. 217 2,315 (91) Currencies Income statement items: average rate 1 EUR = USD 1.5197 (2007: USD 1.3447). Income statement items: average rate 1 EUR = GBP 0.7825 (2007: GBP 0.6758). Balance sheet items: closing rate 1 EUR = USD 1.4303 (2007: USD1.4179; year-end 2007: USD 1.4721). Balance sheet items: closing rate 1 EUR = GBP 0.7903 (2007: GBP 0.6968; year-end 2007: GBP 0.7334). Notes: 1) After deduction of preferred dividend and coupons on perpetuals. Shareholders' equity per share is calculated after deduction of the preferred 2) share capital of EUR 2.1 billion (at Dec. 31, 2007: EUR 2.1 billion) and considering the number of treasury shares. The number of common shares used in the calculation of shareholders' equity per share is 1,516 million (at Dec. 31, 2007: 1,500 million). Other Explanatory Notes The interim condensed consolidated financial statements included in Appendix III have been prepared in accordance with IAS 34 'Interim financial reporting'. It does not include all of the information required for full financial statements and should therefore be read together with the 2007 consolidated financial statements of AEGON N.V. as included in AEGON's Annual Report over 2007. As of January 1, 2008, AEGON reclassified, on the face of its balance sheet, the real estate for own use from Investments general account and Investments for account of policyholders to Other assets and receivables. In addition AEGON reclassified cash flows from real estate held for own use as cash flows from operating activities to investing activities, to the extent that they relate to real estate that is occupied by AEGON's own employees. The comparative 2007 information has been adjusted accordingly. This change reduced Investments general account by EUR 330 million and Investments for account of policyholder by EUR 141 million with an offsetting increase in Other assets and receivables of EUR 471 million. All other accounting policies and methods of computation applied in the interim financial statements are the same as those applied in the 2007 consolidated financial statements, which were prepared in accordance with the International Financial Reporting Standards (IFRS) as adopted by the European Union. For AEGON this is equal to IFRS as published by the International Accounting Standards Board. The published figures in these interim financial statements are unaudited. Condensed consolidated income statement The result from financial transactions in the first nine months of 2008 amounts to a loss of EUR 20.6 billion compared to a gain of EUR 5.5 billion in the first nine months of 2007. This decrease primarily reflects losses on investments for account of policyholders. These losses are offset by a decrease in the benefits and expenses line which decreases from an amount of EUR 33.5 billion in the third quarter of 2007 to EUR 5.2 billion in the third quarter of 2008. Capital and funding The capital management section, provided on pages 9-10, includes information on issuances, repurchases and repayments of debt and equity securities effectuated in this interim reporting period. Investment impairments Page 7 of the results release includes information on net impairments recognized in the third quarter of 2008. Condensed consolidated statement of changes in equity Page 10 of the results release includes information on the movements in shareholder's equity. Equity market sensitivities Fluctuations in the equity markets have affected AEGON's profitability, capital position and sales of equity related products in the past and may continue to do so. Exposure to equity markets exists in both assets and liabilities. Equity exposure exists through direct equity investments, guaranties on minimum return or accumulation guarantees in insurance and investment contracts and impact on fee income related to charges on policyholder account balances. A significant assumption related to estimated gross profits on variable annuities and variable life insurance products in the United States, Canada and some of the smaller country units, is the annual long-term growth rate of the underlying assets. As equity markets do not move in a systematic manner, assumptions as to the long-term growth rate are made after considering the effects of short-term variances from the long-term assumptions (a reversion to the mean assumption). The reconsideration of this assumption may affect the original DAC or VOBA amortization schedule, referred to as DAC or VOBA unlocking. The difference between the original DAC or VOBA amortization schedule and the revised schedule, which is based on estimates of actual and future gross profits, is recognized in the income statement as an expense or a benefit in the period of determination. At September 30, 2008, the reversion to the mean assumptions for variable products, primarily variable annuities, were as follows in the United States: gross long-term equity growth rate of 9% (June 30, 2008: 9%); gross short-term growth rate of 15% (June 30, 2008: 10%). The reversion period for the short-term rate is five years. The sensitivity analysis of net income to changes in equity prices is presented in the table below. The sensitivity of net income to changes in equity reflects changes in the market value of AEGON's portfolio, changes in DAC amortization, contributions to pension plans for AEGON's employees, the strengthening of the guaranteed minimum benefits, when applicable and the impact on fee income related to charges on policyholder account balances. The results of equity sensitivity tests are non-linear. The main reason for this is due to equity options sold to clients that are embedded in some of AEGON's products and that more severe scenarios could cause accelerated DAC amortization and guaranteed minimum benefits provisioning, while moderate scenarios may not. Immediate change of Estimated approximate effects on net income (12 month period) in million EUR September 30, 2008 Equity decrease 20% (700) Equity decrease 40% (1,600) Guarantees valuation Guarantees embedded in pension, life and variable annuity contracts of AEGON USA and AEGON The Netherlands are measured at fair value. These contracts include long-term guarantees that are embedded in the contracts which for accounting purposes are valued separately. One of the inputs to the valuation models are implied volatilities. A valuation technique should reflect what the transaction price would have been on the measurement date in an arm's length transaction motivated by normal business considerations. The prices of guarantees as such are not market observable. Therefore AEGON is not able to calibrate the value of its models to markets. Management concluded that the implied volatility quotes at September 30, 2008 did not reflect an orderly active market and that implied volatilities used in the valuation of guarantees should be based on Level 3 type pricing; i.e. based on internal models. Business combinations On February 26, 2008 AEGON has entered into an agreement to acquire 100% of Ankara Emeklilik Anonim Sirketi (Ankara Emeklilik), a Turkish life insurance and pension provider, from Polis Bakim ve Yardim Sandigi. The transaction, subject to regulatory approval in Turkey, was closed in the third quarter of 2008. Ankara Emeklilik has a well-established presence in the Turkish life insurance and private pension market, with over 54,000 pension fund members and approximately EUR 35 million in assets under management (Source: Pension Monitoring Center - February 18, 2008). Ankara Emeklilik sells its products and services through a variety of different channels and has an agreement in place to distribute through a nationwide network of 236 branches belonging to Sekerbank. On April 21, 2008 AEGON and China's Industrial Securities have completed the establishment of their asset management joint venture following the recent final approval by the regulatory authorities. Under the agreement, AEGON has acquired a 49% interest in Industrial Fund Management Company (IFMC), a Chinese mutual fund manager with approximately EUR 3 billion assets under management as of March 31, 2008. Industrial Securities, one of China's leading securities companies, will retain the remaining 51% of IFMC. The initial agreement was announced on May 28, 2007. The joint venture will be renamed AEGON Industrial Fund Management Company. Both shareholders will be equally represented in the Board of Directors. The current management team led by CEO Yang Dong will continue to lead AEGON Industrial FMC with the objective of becoming one of the top players in the Chinese fund management market. Over the past two years, assets under management have increased from EUR 600 million to EUR 3 billion. On June 30, 2008 AEGON completed the 100% purchase of the registered capital of UNIQA Asset Management Company and Heller-Saldo 2000 Pension Fund Management Company, both Hungarian entities, from UNIQA Insurance Company. The agreement was signed on February 21, 2008 and it was subject to regulatory approval which was subsequently received. Following the acquisition, assets under management increased by approximately EUR 300 million (Source: Hungarian Financial Supervisory Authority (HFSA) 3Q 2007 figures). On June 30, 2008 AEGON Hungary Pension Fund merged with 'Uniqa and Public Service Pension Fund'. As a result of the merger, AEGON is the second largest pension fund provider in Hungary. On June 30, 2008 AEGON completed the planned merger of its pension fund management company PTE AEGON with BRE Bank's PTE Skarbiec-Emerytura. As part of the merger agreement, AEGON acquired BRE Bank's shareholding in the newly combined pension fund. The merger, agreed in June last year, will strengthen AEGON's position both in the Polish pension market and in the Central & Eastern European region as a whole. With the merger, AEGON will become Poland's fifth largest pension fund manager, with a market share of approximately 6%. The combined fund has some 800,000 members and more than EUR 1.8 billion in assets under management. For business combinations in the third quarter 2008 please refer to page 2 of this results release. Commitments and contingencies There have been no material changes in contingent assets and liabilities reported in the 2007 consolidated financial statements of AEGON. Events after the balance sheet date For business combinations after the third quarter 2008 please refer to page 2 of this results release. For the announcement on the EUR 3 billion additional capital buffer provided by Vereniging AEGON, financed by the Dutch State, please see page 9 of this results release. About AEGON AEGON is one of the world's largest life insurance and pension groups, and a strong provider of investment products. AEGON empowers local business units to identify and provide products and services that meet the evolving needs of customers, using distribution channels best suited to local markets. AEGON takes pride in balancing a local approach with the power of an expanding global operation. With headquarters in The Hague, the Netherlands, AEGON companies employ almost 32,000 people worldwide. AEGON's businesses serve millions of customers in over twenty markets throughout the Americas, Europe, and Asia. Respect, quality, transparency and trust constitute AEGON's core values as the company continually strives to meet the expectations of customers, shareholders, employees and business partners. AEGON is driven to deliver new thinking with the ambition to be the best in the industry. Disclaimers Cautionary note regarding non-GAAP measures This press release includes certain non-GAAP financial measures: net operating earnings, operating earnings before tax, (net) underlying earnings and value of new business. The reconciliation of net operating earnings and operating earnings before tax to the most comparable IFRS measures is provided on page 39. A reconciliation of (net) underlying earnings to operating earnings before tax is provided on page 27. Value of new business is not based on IFRS, which are used to report AEGON's quarterly statements and should not be viewed as a substitute for IFRS financial measures. AEGON believes that these non-GAAP measures, together with the IFRS information, provide a meaningful measure for the investment community to evaluate AEGON's business relative to the businesses of our peers. Local currencies and constant currency exchange rates This press release contains certain information about our results and financial condition in USD for the Americas and GBP for the United Kingdom, because those businesses operate and are managed primarily in those currencies. Certain comparative information presented on a constant currency basis eliminates the effects of changes in currency exchange rates. None of this information is a substitute for or superior to financial information about us presented in EUR, which is the currency of our primary financial statements. Forward-looking statements The statements contained in this press release that are not historical facts are forward-looking statements as defined in the US Private Securities Litigation Reform Act of 1995. The following are words that identify such forward-looking statements: believe, estimate, target, intend, may, expect, anticipate, predict, project, counting on, plan, continue, want, forecast, should, would, is confident, will, and similar expressions as they relate to our company. These statements are not guarantees of future performance and involve risks, uncertainties and assumptions that are difficult to predict. We undertake no obligation to publicly update or revise any forward-looking statements. Readers are cautioned not to place undue reliance on these forward-looking statements, which merely reflect company expectations at the time of writing. Actual results may differ materially from expectations conveyed in forward-looking statements due to changes caused by various risks and uncertainties. Such risks and uncertainties include but are not limited to the following: - Changes in general economic conditions, particularly in the United States, the Netherlands and the United Kingdom; - Changes in the performance of financial markets, including emerging markets, such as with regard to: - The frequency and severity of defaults by issuers in our fixed income investment portfolios; and - The effects of corporate bankruptcies and/or accounting restatements On the financial markets and the resulting decline in the value of equity and debt securities we hold; - The frequency and severity of insured loss events; - Changes affecting mortality, morbidity and other factors that may impact the profitability of our insurance products; - Changes affecting interest rate levels and continuing low or rapidly changing interest rate levels; - Changes affecting currency exchange rates, in particular the EUR/USD and EUR/GBP exchange rates; - Increasing levels of competition in the United States, the Netherlands, the United Kingdom and emerging markets; - Changes in laws and regulations, particularly those affecting our operations, the products we sell, and the attractiveness of certain products to our consumers; - Regulatory changes relating to the insurance industry in the jurisdictions in which we operate; - Acts of God, acts of terrorism, acts of war and pandemics; - Changes in the policies of central banks and/or governments; - Litigation or regulatory action that could require us to pay significant damages or change the way we do business; - Customer responsiveness to both new products and distribution channels; - Competitive, legal, regulatory, or tax changes that affect the distribution cost of or demand for our products; - Our failure to achieve anticipated levels of earnings or operational efficiencies as well as other cost saving initiatives; and - The impact our adoption of the International Financial Reporting Standards may have on our reported financial results and financial condition. Group Corporate Communications & Investor Relations Media relations: Phone: +31(0)70-344-8956, E-mail: . Media conference call 8:30 am CET Audio webcast on Investor relations: Phone: +31(0)70-344-8305 or +1-877-548-9668 - toll free USA only E-mail: Analyst & investor call: 3:00 pm CET, Audio webcast on http://www.aegon.com/ Call-in numbers (listen only): USA: +1-480-629-1990, UK: +44-208-515-2301, NL: +31-20-796-5332, Replay: +44-208-515-2301 - Access code: 140764# Financial supplement: AEGON's Q3 2008 Financial supplement is available on http://www.aegon.com/ Website: http://www.aegon.com/ DATASOURCE: AEGON N.V.

Copyright

1 Year Active Energy Chart

1 Year Active Energy Chart

1 Month Active Energy Chart

1 Month Active Energy Chart

Your Recent History

Delayed Upgrade Clock