
We could not find any results for:
Make sure your spelling is correct or try broadening your search.
| Name | Symbol | Market | Type |
|---|---|---|---|
| YPF Sociedad Anonima | NYSE:YPF | NYSE | Depository Receipt |
| Price Change | % Change | Price | High Price | Low Price | Open Price | Traded | Last Trade | |
|---|---|---|---|---|---|---|---|---|
| 0.205 | 0.55% | 37.425 | 38.051 | 35.37 | 35.65 | 1,126,413 | 16:22:43 |
SECURITIES AND EXCHANGE COMMISSION
Washington, D.C. 20549
FORM 6-K
REPORT OF FOREIGN PRIVATE ISSUER
PURSUANT TO RULE 13A-16 OR 15D-16
UNDER THE SECURITIES EXCHANGE ACT OF 1934
For the month of November 2023
Commission File Number: 001-12102
YPF Sociedad Anónima
(Exact name of registrant as specified in its charter)
Macacha Güemes 515
C1106BKK Buenos Aires, Argentina
(Address of principal executive office)
Indicate by check mark whether the registrant files or will file annual reports under cover of Form 20-F or Form 40-F:
Form 20-F ☒ Form 40-F ☐
YPF Sociedad Anónima
TABLE OF CONTENT
| ITEM 1 | YPF S.A.’s third quarter 2023 consolidated results. |

| 2 | ||||
| 4 | ||||
| 7 | ||||
| 10 | ||||
| 10 | ||||
| 14 | ||||
| 17 | ||||
| 20 | ||||
| 22 | ||||
| 23 | ||||
| 23 | ||||
| 24 | ||||
| 26 | ||||
| 26 | ||||
| 27 | ||||
| 28 | ||||
| 30 | ||||


Basis of Presentation
As from 4Q2022, the financial information in this document is expressed, unless otherwise indicated, in U.S. dollars corresponding to the functional currency of YPF S.A. The information is based on the financial statements prepared in accordance with IFRS in force in Argentina. On the other hand, the financial information of previous periods is restated in U.S. dollars corresponding to the functional currency of YPF S.A (in replacement of the individual financial results of YPF S.A. expressed in Argentine pesos divided by the average exchange rate for the period).
Certain monetary amounts and other figures included in this report have been subject to rounding adjustments. Any discrepancies in any tables between the totals and the sums of the amounts are due to rounding.
| Summary Consolidated Financials Unaudited Figures, in US$ million |
3Q22 | 2Q23 | 3Q23 | Y/Y Δ | Q/Q Δ | 9M22 | 9M23 | Y/Y Δ | ||||||||||||||||||||||||
| Revenues |
5,357 | 4,375 | 4,504 | -15.9 | % | 2.9 | % | 14,112 | 13,117 | -7.1 | % | |||||||||||||||||||||
| EBITDA |
1,580 | 1,075 | 992 | -37.2 | % | -7.7 | % | 4,216 | 3,183 | -24.5 | % | |||||||||||||||||||||
| Adjusted EBITDA |
1,506 | 1,005 | 926 | -38.5 | % | -7.8 | % | 4,014 | 2,976 | -25.9 | % | |||||||||||||||||||||
| Operating income before impairment of assets |
849 | 221 | 119 | -86.0 | % | -46.2 | % | 2,138 | 675 | -68.4 | % | |||||||||||||||||||||
| Operating income / (loss) |
751 | 221 | (387 | ) | N/A | N/A | 2,040 | 169 | -91.7 | % | ||||||||||||||||||||||
| Net income before impairment of assets |
757 | 380 | 192 | -74.6 | % | -49.5 | % | 1,834 | 913 | -50.2 | % | |||||||||||||||||||||
| Net result |
693 | 380 | (137 | ) | N/A | N/A | 1,770 | 584 | -67.0 | % | ||||||||||||||||||||||
| EPS |
1.76 | 0.86 | (0.33 | ) | N/A | N/A | 4.48 | 1.40 | -68.8 | % | ||||||||||||||||||||||
| CAPEX |
1,137 | 1,374 | 1,546 | 36.0 | % | 12.6 | % | 2,771 | 4,218 | 52.2 | % | |||||||||||||||||||||
| FCF |
243 | (284 | ) | (379 | ) | N/A | 33.5 | % | 943 | (680 | ) | N/A | ||||||||||||||||||||
| Cash and cash equivalents |
1,335 | 1,470 | 1,478 | 10.8 | % | 0.5 | % | 1,335 | 1,478 | 10.8 | % | |||||||||||||||||||||
| Total debt |
6,989 | 7,782 | 8,153 | 16.6 | % | 4.8 | % | 6,989 | 8,153 | 16.6 | % | |||||||||||||||||||||
EBITDA = Operating income + Depreciation of PP&E + Depreciation of the right of use assets + Amortization of intangible assets + Unproductive exploratory drillings + (Reversal) / Deterioration of PP&E. Adjusted EBITDA = EBITDA that excludes IFRS 16 effects +/- one-off items.
Cash and cash equivalents: Include current investment in financial assets.
EPS attributable to shareholders of the parent company (basic and diluted).
FCF = Cash flow from Operations less CAPEX (Investing activities), M&A (Investing activities), and interest and leasing payments (Financing activities).
| • | Adjusted EBITDA reached US$926 million, 8% down sequentially, mainly driven by a decline in local fuel prices in dollars, partially offset by seasonal higher natural gas sales. |
| • | Total hydrocarbon production averaged 520 Kboe/d increasing 1% sequentially and growing 3% on a year-on-year basis, mainly boosted by the expansion of 5% in our crude oil production. |
| • | Shale oil production continued delivering an impressive growth rate of 20% y/y, while shale gas production increased by 6% y/y. On a sequential basis, shale oil production recorded a slight decline of 3% mainly due to the interference effects of new well construction activity over existing production in our core-hub fields, fully recovered during October, and an expansion of 7% in shale gas production. |
| • | Medanito oil exports to Chile continued growing, averaging almost 19 Kbbl/d, representing 8% of total oil production and 13% of Medanito oil production during the quarter. |
| • | Volumes of fuels sold in the domestic market reached the highest level ever dispatched in any given quarter, jumping 3% q/q and 2% y/y. |

2
| • | Processing levels at our refineries contracted by 1% y/y and 10% q/q, primarily driven by programmed maintenance stoppages at La Plata and Luján de Cuyo refineries. |
| • | Total OPEX was flat q/q and increased 11% y/y on the back of a negative inter-annual evolution of macroeconomic variables, coupled with higher maintenance activity and transportation costs recorded during the period. |
| • | CAPEX activity totaled US$1,546 million (+13% q/q and +36% y/y), being on track to fully deploy the investment plan of the year, which is expected to end with a slight upward deviation as a result of higher costs in dollar terms. |
| • | Free cash flow totaled a negative US$379 million during the third quarter, as the deployment of our investment plan was not fully compensated by the cash flow from operations, taking our net debt to US$6,675 million and resulting in a net leverage ratio of 1.7x. |
3
2. ANALYSIS OF CONSOLIDATED RESULTS
| Consolidated Revenues Breakdown Unaudited Figures, in US$ million |
3Q22 | 2Q23 | 3Q23 | Y/Y Δ | Q/Q Δ | 9M22 | 9M23 | Y/Y Δ | ||||||||||||||||||||||||
| Diesel |
1,954 | 1,639 | 1,563 | -20.0 | % | -4.6 | % | 5,007 | 4,821 | -3.7 | % | |||||||||||||||||||||
| Gasoline |
879 | 833 | 824 | -6.2 | % | -1.0 | % | 2,575 | 2,550 | -0.9 | % | |||||||||||||||||||||
| Natural gas as producers (third parties) |
470 | 386 | 464 | -1.3 | % | 20.3 | % | 1,194 | 1,120 | -6.2 | % | |||||||||||||||||||||
| Other |
1,424 | 1,124 | 1,174 | -17.6 | % | 4.5 | % | 3,536 | 3,275 | -7.4 | % | |||||||||||||||||||||
|
|
|
|
|
|
|
|
|
|
|
|
|
|
|
|
|
|||||||||||||||||
| Total Domestic Market |
4,727 | 3,982 | 4,025 | -14.8 | % | 1.1 | % | 12,312 | 11,766 | -4.4 | % | |||||||||||||||||||||
|
|
|
|
|
|
|
|
|
|
|
|
|
|
|
|
|
|||||||||||||||||
| Jet fuel |
135 | 107 | 127 | -5.9 | % | 18.8 | % | 349 | 395 | 13.2 | % | |||||||||||||||||||||
| Grain and flours |
217 | 46 | 26 | -88.0 | % | -43.5 | % | 632 | 77 | -87.8 | % | |||||||||||||||||||||
| Crude oil |
0 | 46 | 152 | N/A | 231.7 | % | 5 | 210 | 3980.2 | % | ||||||||||||||||||||||
| Petchem & Other |
278 | 195 | 173 | -37.6 | % | -10.9 | % | 814 | 668 | -17.9 | % | |||||||||||||||||||||
|
|
|
|
|
|
|
|
|
|
|
|
|
|
|
|
|
|||||||||||||||||
| Total Export Market |
630 | 393 | 479 | -24.0 | % | 21.6 | 1,800 | 1,351 | -25.0 | % | ||||||||||||||||||||||
|
|
|
|
|
|
|
|
|
|
|
|
|
|
|
|
|
|||||||||||||||||
| Total Revenues |
5,357 | 4,375 | 4,504 | -15.9 | % | 2.9 | % | 14,112 | 13,117 | -7.1 | % | |||||||||||||||||||||
|
|
|
|
|
|
|
|
|
|
|
|
|
|
|
|
|
|||||||||||||||||
During 3Q23, revenues totaled US$4,504 million, increasing by 2.9% q/q and decreasing by 15.9% y/y. On a sequential basis, revenues increased primarily as the result of higher crude oil exports, larger natural gas sales and an increase in volumes dispatched of diesel and gasoline in the local market, partially offset by a decline in domestic fuel prices in dollars terms.
When analyzing 3Q23 revenues, it is worth highlighting:
| • | Diesel sales in the domestic market (retail and wholesale) – 34.7% of total revenues – decreased 4.6% q/q due to a 6.5% contraction in prices, partially offset by a 2.0% expansion in volumes dispatched. |
| • | Gasoline sales in the local market – 18.3% of total revenues – decreased by 1.0% q/q, primarily due to a 5.6% drop in prices while volumes expanded by 4.8% |
| • | Natural gas sales as producers sold to third parties in the domestic market - representing 10.3% of total revenues – went up 20.3% q/q mainly due to higher average realization prices of 11.2% driven by the seasonality factor included in the Plan Gas between May and September, while volumes sold rose by 8.1%. |
| • | Other domestic sales increased by 4.5% q/q mainly due to higher seasonal sales of natural gas to the retail distribution segment – through our subsidiary Metrogas S.A. (“Metrogas”) – and fertilizers. |
| • | Export revenues increased 21.6% q/q, primarily due to higher crude oil exports to Chile through the trans-andean pipeline, partially compensated by lower non-oil agro exports. |
4
| Unaudited Figures, in US$ million |
3Q22 | 2Q23 | 3Q23 | Y/Y Δ | Q/Q Δ | 9M22 | 9M23 | Y/Y Δ | ||||||||||||||||||||||||
| Lifting cost |
(631 | ) | (746 | ) | (746 | ) | 18.3 | % | 0.0 | % | (1,774 | ) | (2,163 | ) | 21.9 | % | ||||||||||||||||
| Other Upstream |
(120 | ) | (124 | ) | (112 | ) | -7.0 | % | -10.0 | % | (314 | ) | (351 | ) | 11.9 | % | ||||||||||||||||
| Industrialization cost |
(409 | ) | (446 | ) | (451 | ) | 10.2 | % | 1.0 | % | (1,103 | ) | (1,311 | ) | 18.9 | % | ||||||||||||||||
| Commercialization, G&P, Corp. & Other |
(274 | ) | (271 | ) | (277 | ) | 1.2 | % | 2.1 | % | (648 | ) | (755 | ) | 16.4 | % | ||||||||||||||||
|
|
|
|
|
|
|
|
|
|
|
|
|
|
|
|
|
|||||||||||||||||
| Total OPEX |
(1,434 | ) | (1,588 | ) | (1,586 | ) | 10.6 | % | -0.1 | % | (3,839 | ) | (4,580 | ) | 19.3 | % | ||||||||||||||||
|
|
|
|
|
|
|
|
|
|
|
|
|
|
|
|
|
|||||||||||||||||
| Depreciation & Amortization |
(724 | ) | (854 | ) | (864 | ) | 19.3 | % | 1.2 | % | (2,064 | ) | (2,493 | ) | 20.8 | % | ||||||||||||||||
| Royalties |
(263 | ) | (247 | ) | (248 | ) | -5.5 | % | 0.5 | % | (719 | ) | (731 | ) | 1.7 | % | ||||||||||||||||
| Other costs |
(330 | ) | (260 | ) | (281 | ) | -15.0 | % | 8.0 | % | (911 | ) | (790 | ) | -13.3 | % | ||||||||||||||||
|
|
|
|
|
|
|
|
|
|
|
|
|
|
|
|
|
|||||||||||||||||
| Total Other Costs |
(1,317 | ) | (1,361 | ) | (1,393 | ) | 5.8 | % | 2.4 | % | (3,694 | ) | (4,014 | ) | 8.7 | % | ||||||||||||||||
|
|
|
|
|
|
|
|
|
|
|
|
|
|
|
|
|
|||||||||||||||||
| Fuels imports |
(596 | ) | (192 | ) | (262 | ) | -56.0 | % | 36.7 | % | (1,286 | ) | (854 | ) | -33.6 | % | ||||||||||||||||
| Crude oil purchases to third parties |
(362 | ) | (323 | ) | (308 | ) | -15.0 | % | -4.8 | % | (927 | ) | (1,018 | ) | 9.8 | % | ||||||||||||||||
| Biofuel purchases |
(301 | ) | (230 | ) | (197 | ) | -34.7 | % | -14.3 | % | (718 | ) | (656 | ) | -8.6 | % | ||||||||||||||||
| Non-oil agro purchases |
(387 | ) | (253 | ) | (194 | ) | -49.8 | % | -23.2 | % | (1,080 | ) | (561 | ) | -48.0 | % | ||||||||||||||||
| Other purchases |
(364 | ) | (244 | ) | (315 | ) | -13.4 | % | 29.0 | % | (876 | ) | (783 | ) | -10.6 | % | ||||||||||||||||
| Stock variations |
277 | 25 | (127 | ) | N/A | N/A | 491 | 24 | -95.1 | % | ||||||||||||||||||||||
|
|
|
|
|
|
|
|
|
|
|
|
|
|
|
|
|
|||||||||||||||||
| Total Purchases & Stock Variations |
(1,733 | ) | (1,217 | ) | (1,403 | ) | -19.0 | % | 15.3 | % | (4,395 | ) | (3,848 | ) | -12.4 | % | ||||||||||||||||
|
|
|
|
|
|
|
|
|
|
|
|
|
|
|
|
|
|||||||||||||||||
| Other operating results, net |
(24 | ) | 12 | (3 | ) | -87.5 | % | N/A | (46 | ) | — | N/A | ||||||||||||||||||||
| Impairment of assets |
(98 | ) | — | (506 | ) | 416.3 | % | N/A | (98 | ) | (506 | ) | 416.3 | % | ||||||||||||||||||
|
|
|
|
|
|
|
|
|
|
|
|
|
|
|
|
|
|||||||||||||||||
| Operating Costs + Purchases + Impairment of Assets |
(4,606 | ) | (4,154 | ) | (4,891 | ) | 6.2 | % | 17.7 | % | (12,072 | ) | (12,948 | ) | 7.3 | % | ||||||||||||||||
|
|
|
|
|
|
|
|
|
|
|
|
|
|
|
|
|
|||||||||||||||||
Stock variations include price effects by US$ 152 million in 3Q22, US$(36) million for 2Q23 and US$ 32 million for 3Q23.
In terms of costs, operating expenses (“OPEX”) in 3Q23 totaled US$1,586 million, remaining essentially flat compared to 2Q23 primarily driven by the evolution of the macroeconomic variables during the quarter particularly affected by a discrete devaluation of the local currency that took place in mid-August, fully offset by inflation and wages increases and higher transportation and maintenance activity . When compared to the same period of last year, total OPEX increased by 10.6%, driven by the inflationary environment, coupled with an overall activity increase across all our businesses, on the back of higher O&G production and higher transportation cost due to an increase of refined products sales. As a consequence, unit OPEX per barrel of hydrocarbon produced, decreased by 2.5% q/q and increased 7.4% y/y.
Total Purchases and Stock Variations, a category highly correlated with demand levels for refined and agrobusiness products and inventory valuation, increased by 15.3% q/q and decreased 19.0% y/y.
When analyzing 3Q23 purchases, it is worth highlighting:
| • | Fuels imports, excluding jet fuel, which represented 6.7% of total gasoline and diesel sales, increased by 24.9% q/q, driven by higher prices of 16.2% and higher imported volumes of 7.5%. During the quarter, only diesel was imported, which combined with a significant reduction in gasoline and diesel inventories, allowed to meet the higher demand recorded in Q3. |
| • | Crude oil purchases decreased by 4.8% q/q, due to lower prices of 5.6%, aligned with the downward trend of fuels prices recorded in 3Q23, partially offset by a decrease in volumes of 0.9% due to lower processing levels. |
| • | Biofuel purchases decreased by 14.3%, where purchases of biodiesel declined 21.2% and purchases of bioethanol dropped 7.7%. Biodiesel purchases contraction was mainly the result of a lower blend in diesel sales caused by reduced availability in the local market, while bioethanol purchases decreased mainly as a result of lower prices in dollar terms. |
| • | Non-oil agro purchases decreased by 23.2% sequentially, as a result of lower seasonal demand of grains and flours, aligned with the lower sales of these products. |
5
In terms of our inventories, a negative stock variation of US$127 million was recorded during 3Q23, mainly driven by lower inventories of gasoline and diesel products, partially offset by higher replacement costs of our inventories; in comparison with a positive stock variation of US$25 million accounted in 2Q23.
During the quarter, the Company recognized a non-recurring impairment charge in our natural gas assets of 506 million dollars, pre-tax, primarily on the back of lower long-term expected prices as a result of increased competition and potential oversupply in the domestic natural gas market in coming years. The charge for deterioration was allocated in the CGU Gas - Neuquén Basin and has not impacted the cash flow generation.
| Consolidated Net Income Breakdown Unaudited Figures, in US$ million |
3Q22 | 2Q23 | 3Q23 | Y/Y Δ | Q/Q Δ | 9M22 | 9M23 | Y/Y Δ | ||||||||||||||||||||||||
| Operating income / (loss) |
751 | 221 | (387 | ) | N/A | N/A | 2,040 | 169 | -91.7 | % | ||||||||||||||||||||||
|
|
|
|
|
|
|
|
|
|
|
|
|
|
|
|
|
|||||||||||||||||
| Income from equity interests in associates and joint ventures |
141 | 94 | 44 | -68.8 | % | -53.2 | % | 388 | 227 | -41.5 | % | |||||||||||||||||||||
| Financial results, net |
85 | 140 | 206 | 142.4 | % | 47.1 | % | 8 | 348 | 4250.0 | % | |||||||||||||||||||||
|
|
|
|
|
|
|
|
|
|
|
|
|
|
|
|
|
|||||||||||||||||
| Net result before tax |
977 | 455 | (137 | ) | N/A | N/A | 2,436 | 744 | -69.5 | % | ||||||||||||||||||||||
|
|
|
|
|
|
|
|
|
|
|
|
|
|
|
|
|
|||||||||||||||||
| Income tax |
(284 | ) | (75 | ) | 0 | N/A | N/A | (666 | ) | (160 | ) | -76.0 | % | |||||||||||||||||||
|
|
|
|
|
|
|
|
|
|
|
|
|
|
|
|
|
|||||||||||||||||
| Net result |
693 | 380 | (137 | ) | N/A | N/A | 1,770 | 584 | -67.0 | % | ||||||||||||||||||||||
|
|
|
|
|
|
|
|
|
|
|
|
|
|
|
|
|
|||||||||||||||||
| Net Income before impairment of assets |
757 | 380 | 192 | -74.6 | % | -49.5 | % | 1,834 | 913 | -50.2 | % | |||||||||||||||||||||
|
|
|
|
|
|
|
|
|
|
|
|
|
|
|
|
|
|||||||||||||||||
Net financial results for 3Q23 represented a US$206 million gain compared to the gain of US$140 million in 2Q23. This was primarily as a result of the higher devaluation of the local currency resulting in an increase of net FX gains.
As a result of the operating and financial evolution, result before taxes and net result in 3Q23 reached a negative mark of US$137 million, compared to a gain of US$455 and US$380 million, respectively, posted in 2Q23. The income tax charge was neutral mainly driven by renewed estimates on the net result before taxes and the income tax rate for FY2023.
6
3. EBITDA AND ADJUSTED EBITDA RECONCILIATION
Adjusted EBITDA for 3Q23 reached a quarterly mark of US$926 million, decreasing 7.8% when compared to 2Q23. This variation was mainly due to a decline in fuels prices and a downward trend in the prices of other refined products, other than gasoline and diesel, partially offset by higher gas natural sales.
The tables displayed below show the reconciliation between EBITDA and Adjusted EBITDA for the quarter:
| Reconciliation of Adjusted EBITDA Unaudited Figures, in US$ million |
3Q22 | 2Q23 | 3Q23 | Y/Y Δ | Q/Q Δ | 9M22 | 9M23 | Q/Q Δ | ||||||||||||||||||||||||
| Net result |
693 | 380 | (137 | ) | N/A | N/A | 1,770 | 584 | -67.0 | % | ||||||||||||||||||||||
| Financial results, net |
(85 | ) | (140 | ) | (206 | ) | 142.4 | % | 47.1 | % | (8 | ) | (348 | ) | 4250.0 | % | ||||||||||||||||
| Income from equity interests in associates and joint ventures |
(141 | ) | (94 | ) | (44 | ) | -68.8 | % | -53.2 | % | (388 | ) | (227 | ) | -41.5 | % | ||||||||||||||||
| Income tax |
284 | 75 | — | N/A | N/A | 666 | 160 | -76.0 | % | |||||||||||||||||||||||
| Unproductive exploratory drillings |
7 | — | 9 | 28.6 | % | N/A | 14 | 15 | 7.1 | % | ||||||||||||||||||||||
| Depreciation & amortization |
724 | 854 | 864 | 19.3 | % | 1.2 | % | 2,064 | 2,493 | 20.8 | % | |||||||||||||||||||||
| Impairment of assets |
98 | — | 506 | 416.3 | % | N/A | 98 | 506 | 416.3 | % | ||||||||||||||||||||||
|
|
|
|
|
|
|
|
|
|
|
|
|
|
|
|
|
|||||||||||||||||
| EBITDA |
1,580 | 1,075 | 992 | -37.2 | % | -7.7 | % | 4,216 | 3,183 | -24.5 | % | |||||||||||||||||||||
|
|
|
|
|
|
|
|
|
|
|
|
|
|
|
|
|
|||||||||||||||||
| Leasing |
(74 | ) | (70 | ) | (66 | ) | -11.1 | % | -6.1 | % | (202 | ) | (207 | ) | 2.4 | % | ||||||||||||||||
|
|
|
|
|
|
|
|
|
|
|
|
|
|
|
|
|
|||||||||||||||||
| Adjusted EBITDA |
1,506 | 1,005 | 926 | -38.5 | % | -7.8 | % | 4,014 | 2,976 | -25.9 | % | |||||||||||||||||||||
|
|
|
|
|
|
|
|
|
|
|
|
|
|
|
|
|
|||||||||||||||||
| EBITDA breadkdown by segment Unaudited Figures, in US$ million |
Upstream | Industrialization | Commercialization | Gas & Power | Corporate & Other |
Consolid. Adjustments |
Total | |||||||||||||||||||||
| Operating income / (loss) |
(436 | ) | (93 | ) | 88 | 29 | (94 | ) | 119 | (387 | ) | |||||||||||||||||
| Depreciation & amortization |
693 | 124 | 18 | 16 | 15 | (1 | ) | 864 | ||||||||||||||||||||
| Unproductive exploratory drillings |
9 | — | — | — | — | — | 9 | |||||||||||||||||||||
| Impairment of assets |
506 | — | — | — | — | — | 506 | |||||||||||||||||||||
|
|
|
|
|
|
|
|
|
|
|
|
|
|
|
|||||||||||||||
| EBITDA |
772 | 31 | 106 | 45 | (79 | ) | 118 | 992 | ||||||||||||||||||||
|
|
|
|
|
|
|
|
|
|
|
|
|
|
|
|||||||||||||||
| Leasing |
(37 | ) | (18 | ) | (3 | ) | (8 | ) | — | — | (66 | ) | ||||||||||||||||
| Other adjustments |
— | — | — | — | — | — | — | |||||||||||||||||||||
|
|
|
|
|
|
|
|
|
|
|
|
|
|
|
|||||||||||||||
| Adjusted EBITDA |
735 | 13 | 102 | 37 | (79 | ) | 118 | 926 | ||||||||||||||||||||
|
|
|
|
|
|
|
|
|
|
|
|
|
|
|
|||||||||||||||
7
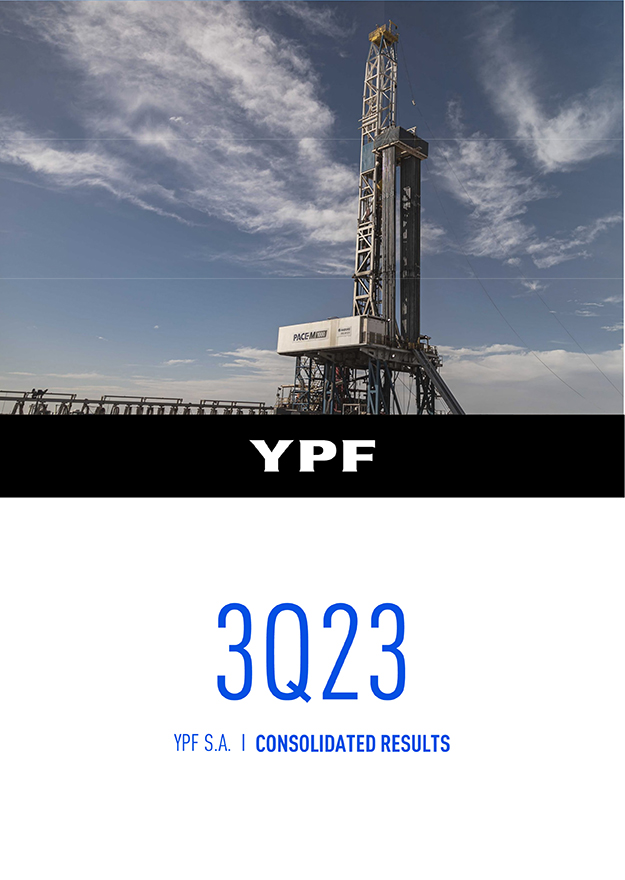
The main causes of the sequential variations in Adjusted EBITDA between 3Q23 and 2Q23 are displayed in the following chart:
| • | Upstream (US$31 million): The positive variation was driven by higher hydrocarbon production and natural gas prices, as well as lower OPEX, partially offset by lower prices of crude oil. |
| • | Industrialization (-US$201 million): The EBITDA contraction was mainly due to lower local fuels and other refined and petrochemical products prices, a contraction of 9.5% in processing levels and a negative non-recurrent retroactive charge of transportation costs accounted to the Commercialization segment. |
| • | Commercialization (US$40 million): The EBITDA increase was primarily due to higher volumes of local fuels sold and the positive effect of the intersegment non-recurrent charge aforementioned, partially offset by higher OPEX. |
| • | Gas & Power (-US$5 million): The EBITDA decrease can be explained mainly due to lower Metrogas results, impacted by lower natural gas prices. |
| • | Corporate & Eliminations (US$56 million): The variation is mainly explained by a positive replacement cost charge of our inventories recorded in Q3, vis-à-vis a negative replacement cost charge accounted in the previous quarter, partially offset by higher corporate OPEX in the third quarter. |
8
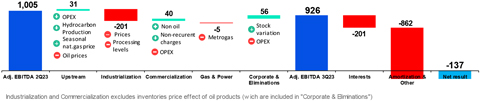
The main causes of the y/y variations in Adjusted EBITDA between 3Q23 and 3Q22, are described in the chart below:
| • | Upstream (-US$185 million): The negative variation was driven by higher OPEX and lower prices of crude oil and natural gas, partially offset by the 3.0% expansion in hydrocarbon production. |
| • | Industrialization (-US$271 million): The EBITDA decrease was mainly due to higher OPEX, including a negative non-recurrent retroactive charge of transportation costs to the Commercialization segment, lower local fuels prices of 18% and a significant reduction of 29% in petrochemical & other refined products prices, partially offset by lower fuels imports. |
| • | Commercialization (-US$11 million): The EBITDA contraction was primarily due to higher OPEX and lower prices of local fuels and petrochemical & other refined products prices of 18% and 29%, respectively, partially offset by the positive non-recurrent charge mentioned above. |
| • | Gas & Power (-US$12 million): The EBITDA contraction can be explained mainly due to higher OPEX and lower LPG and gasolines prices. |
| • | Corporate & Eliminations (-US$100 million): The variation is mainly explained by higher corporate OPEX and a negative replacement cost charge of our inventories, in comparison with a positive replacement cost charge recorded last year. |
9
4. ANALYSIS OF RESULTS BY BUSINESS SEGMENT
| Upstream Operating data Unaudited Figures |
3Q22 | 2Q23 | 3Q23 | Y/Y Δ | Q/Q Δ | 9M22 | 9M23 | Y/Y Δ | ||||||||||||||||||||||||
| Net Production Breakdown |
||||||||||||||||||||||||||||||||
| Crude Production (Kbbld) |
224.8 | 240.9 | 236.9 | 5.4 | % | -1.7 | % | 224.1 | 238.8 | 6.5 | % | |||||||||||||||||||||
|
|
|
|
|
|
|
|
|
|
|
|
|
|
|
|
|
|||||||||||||||||
| Conventional |
144.7 | 143.6 | 142.0 | -1.9 | % | -1.2 | % | 147.2 | 143.0 | -2.9 | % | |||||||||||||||||||||
| Shale |
77.0 | 94.6 | 92.2 | 19.8 | % | -2.5 | % | 73.8 | 93.1 | 26.2 | % | |||||||||||||||||||||
| Tight |
3.1 | 2.7 | 2.7 | -12.4 | % | -0.4 | % | 3.1 | 2.7 | -13.2 | % | |||||||||||||||||||||
|
|
|
|
|
|
|
|
|
|
|
|
|
|
|
|
|
|||||||||||||||||
| NGL Production (Kbbld) |
38.0 | 42.7 | 46.6 | 22.7 | % | 9.1 | % | 41.3 | 44.1 | 6.8 | % | |||||||||||||||||||||
|
|
|
|
|
|
|
|
|
|
|
|
|
|
|
|
|
|||||||||||||||||
| Conventional |
14.7 | 12.6 | 12.2 | -16.8 | % | -2.7 | % | 15.7 | 12.4 | -21.1 | % | |||||||||||||||||||||
| Shale |
22.3 | 28.8 | 33.1 | 48.7 | % | 14.7 | % | 24.3 | 30.4 | 25.3 | % | |||||||||||||||||||||
| Tight |
1.1 | 1.3 | 1.3 | 22.6 | % | -2.6 | % | 1.3 | 1.3 | -1.4 | % | |||||||||||||||||||||
|
|
|
|
|
|
|
|
|
|
|
|
|
|
|
|
|
|||||||||||||||||
| Gas Production (Mm3d) |
38.4 | 36.5 | 37.5 | -2.3 | % | 2.9 | % | 38.0 | 36.8 | -3.2 | % | |||||||||||||||||||||
|
|
|
|
|
|
|
|
|
|
|
|
|
|
|
|
|
|||||||||||||||||
| Conventional |
15.0 | 13.8 | 13.4 | -10.6 | % | -2.9 | % | 15.2 | 13.8 | -9.2 | % | |||||||||||||||||||||
| Shale |
17.1 | 17.0 | 18.2 | 6.5 | % | 7.1 | % | 16.0 | 17.3 | 8.6 | % | |||||||||||||||||||||
| Tight |
6.3 | 5.7 | 5.9 | -6.2 | % | 4.4 | % | 6.9 | 5.7 | -17.2 | % | |||||||||||||||||||||
|
|
|
|
|
|
|
|
|
|
|
|
|
|
|
|
|
|||||||||||||||||
| Total Production (Kboed) |
504.4 | 513.1 | 519.7 | 3.0 | % | 1.3 | % | 504.6 | 514.5 | 2.0 | % | |||||||||||||||||||||
|
|
|
|
|
|
|
|
|
|
|
|
|
|
|
|
|
|||||||||||||||||
| Conventional |
253.6 | 242.9 | 238.4 | -6.0 | % | -1.8 | % | 258.7 | 242.3 | -6.3 | % | |||||||||||||||||||||
| Shale |
207.0 | 230.5 | 240.0 | 16.0 | % | 4.1 | % | 198.4 | 232.5 | 17.2 | % | |||||||||||||||||||||
| Tight |
43.8 | 39.7 | 41.2 | -5.9 | % | 3.8 | % | 47.5 | 39.7 | -16.5 | % | |||||||||||||||||||||
|
|
|
|
|
|
|
|
|
|
|
|
|
|
|
|
|
|||||||||||||||||
| Average realization prices |
||||||||||||||||||||||||||||||||
| Crude Oil (USD/bbl) |
67.3 | 63.4 | 60.7 | -9.9 | % | -4.3 | % | 63.9 | 63.6 | -0.4 | % | |||||||||||||||||||||
| Natural Gas (USD/MMBTU) |
4.4 | 3.9 | 4.3 | -2.8 | % | 9.3 | % | 3.8 | 3.8 | -0.3 | % | |||||||||||||||||||||
Total hydrocarbon production totaled 519.7 Kboe/d during 3Q23, increasing 1.3% sequentially and 3.0% y/y. Natural gas production recorded a sequential expansion of 2.9%, while crude oil production decreased by 1.7% q/q, but achieving a strong inter-annual increase of 5.4%. On the NGLs side, production increased 9.1% sequentially primarily driven by the new facilities connected between Tratayen and our subsidiary Mega that allowed an expansion of NGLs production from La Calera block.
Shale production continued expanding strongly during the quarter, representing 46.2% of our total consolidated production in 3Q23, where shale oil and shale gas increased, on a year over year basis, 19.8% and 6.5%, respectively, highlighting the new sequential increase of 4.1% in our total shale production. However, shale oil production recorded a slight sequential decline of 2.5% mainly due to interference effects of new well construction activity over existing production in our shale core-hub fields together with some delays on our program for new tie-ins.
Average daily crude oil production decreased by 1.7% sequentially, driven by the 2.5% decrease in shale production aforementioned, while conventional production dropped just 1.2%, as the natural decline of our mature fields were mostly compensated by our tertiary production, which increased 9% sequentially and 30% versus the same period of 2022. The positive evolution in tertiary production came primarily from Manantiales Behr block, that represents almost 70% of our EOR production, where we are currently operating nine Polymer Injection Units, together with the solid results deployed at Chachauen in Mendoza and El Trebol in Chubut.
10
On the natural gas side, average daily production increased by 2.9% q/q, driven by a 7.1% higher shale gas production, which was partially offset by a 2.9% contraction in our conventional production. In a year over year comparison, natural gas production decreased by 2.3%, particularly affected by lower demand.
In 3Q23, total segment revenues reached US$1,920 million, increasing by 1.3% compared to 2Q23 and decreasing 8.0% y/y.
| • | Crude oil revenues declined by 4.7% q/q, mainly led by lower prices of 4.3% and slight decrease of 0.4% in volumes sold. The price decline was mostly driven by a contraction of Medanito crude oil price, which was set at 56 dollars per barrel as of mid-August, based on an agreement between local refineries, upstream companies and the Secretary of Energy, partially offset by growing crude oil exports. |
| • | Natural gas revenues went up by 16.3% q/q, mainly due to the seasonal price increase previously mentioned of 9.3% and higher volumes sold of 6.4%. |
| Upstream Financials Unaudited Figures, in US$ million |
3Q22 | 2Q23 | 3Q23 | Y/Y Δ | Q/Q Δ | 9M22 | 9M23 | Y/Y Δ | ||||||||||||||||||||||||
| Crude oil |
1,442 | 1,363 | 1,299 | -9.9 | % | -4.7 | % | 3,852 | 4,068 | 5.6 | % | |||||||||||||||||||||
| Natural gas |
566 | 473 | 550 | -2.9 | % | 16.3 | % | 1,438 | 1,380 | -4.0 | % | |||||||||||||||||||||
| Other |
79 | 60 | 72 | -9.4 | % | 19.6 | % | 205 | 197 | -4.2 | % | |||||||||||||||||||||
|
|
|
|
|
|
|
|
|
|
|
|
|
|
|
|
|
|||||||||||||||||
| Revenues |
2,087 | 1,896 | 1,920 | -8.0 | % | 1.3 | % | 5,495 | 5,644 | 2.7 | % | |||||||||||||||||||||
|
|
|
|
|
|
|
|
|
|
|
|
|
|
|
|
|
|||||||||||||||||
| Depreciation & amortization |
(545 | ) | (668 | ) | (693 | ) | 27.2 | % | 3.7 | % | (1,529 | ) | (1,963 | ) | 28.4 | % | ||||||||||||||||
| Lifting cost |
(631 | ) | (746 | ) | (746 | ) | 18.3 | % | 0.0 | % | (1,774 | ) | (2,163 | ) | 21.9 | % | ||||||||||||||||
| Royalties |
(259 | ) | (244 | ) | (245 | ) | -5.3 | % | 0.7 | % | (710 | ) | (722 | ) | 1.7 | % | ||||||||||||||||
| Exploration expenses |
(18 | ) | (8 | ) | (16 | ) | -11.1 | % | 100.0 | % | (42 | ) | (42 | ) | 0.0 | % | ||||||||||||||||
| Other |
(217 | ) | (155 | ) | (150 | ) | -31.0 | % | -3.6 | % | (441 | ) | (466 | ) | 5.6 | % | ||||||||||||||||
|
|
|
|
|
|
|
|
|
|
|
|
|
|
|
|
|
|||||||||||||||||
| Operating income before impairment of assets |
417 | 75 | 70 | -83.3 | % | -7.0 | % | 999 | 289 | -71.1 | % | |||||||||||||||||||||
|
|
|
|
|
|
|
|
|
|
|
|
|
|
|
|
|
|||||||||||||||||
| Impairment of assets |
(98 | ) | — | (506 | ) | 414.6 | % | N/A | (98 | ) | (506 | ) | 414.6 | % | ||||||||||||||||||
|
|
|
|
|
|
|
|
|
|
|
|
|
|
|
|
|
|||||||||||||||||
| Operating income / (loss) |
319 | 75 | (436 | ) | N/A | N/A | 901 | (217 | ) | N/A | ||||||||||||||||||||||
|
|
|
|
|
|
|
|
|
|
|
|
|
|
|
|
|
|||||||||||||||||
| Depreciation & amortization |
545 | 668 | 693 | 27.2 | % | 3.7 | % | 1,529 | 1,963 | 28.4 | % | |||||||||||||||||||||
| Unproductive exploratory drillings |
7 | — | 9 | 28.6 | % | N/A | 14 | 15 | 7.1 | % | ||||||||||||||||||||||
| Impairment of assets |
98 | — | 506 | 414.6 | % | N/A | 98 | 506 | 414.6 | % | ||||||||||||||||||||||
|
|
|
|
|
|
|
|
|
|
|
|
|
|
|
|
|
|||||||||||||||||
| EBITDA |
969 | 743 | 772 | -20.3 | % | 3.9 | % | 2,542 | 2,267 | -10.8 | % | |||||||||||||||||||||
|
|
|
|
|
|
|
|
|
|
|
|
|
|
|
|
|
|||||||||||||||||
| Leasing |
(48 | ) | (39 | ) | (37 | ) | -23.1 | % | -5.3 | % | (124 | ) | (118 | ) | -5.1 | % | ||||||||||||||||
|
|
|
|
|
|
|
|
|
|
|
|
|
|
|
|
|
|||||||||||||||||
| Adjusted EBITDA |
920 | 704 | 735 | -20.2 | % | 4.4 | % | 2,418 | 2149 | -11.1 | % | |||||||||||||||||||||
|
|
|
|
|
|
|
|
|
|
|
|
|
|
|
|
|
|||||||||||||||||
| CAPEX |
833 | 1,017 | 1,150 | 38.1 | % | 13.1 | % | 2,144 | 3,182 | 48.4 | % | |||||||||||||||||||||
|
|
|
|
|
|
|
|
|
|
|
|
|
|
|
|
|
|||||||||||||||||
| Unit Cash Costs Unaudited Figures, in US$/boe |
3Q22 | 2Q23 | 3Q23 | Y/Y Δ | Q/Q Δ | 9M22 | 9M23 | Y/Y Δ | ||||||||||||||||||||||||
| Lifting Cost |
13.6 | 16.0 | 15.6 | 14.8 | % | -2.3 | % | 12.9 | 15.4 | 19.6 | % | |||||||||||||||||||||
| Royalties and other taxes |
7.1 | 6.5 | 6.5 | -8.0 | % | -0.3 | % | 6.5 | 6.5 | 0.4 | % | |||||||||||||||||||||
| Other Costs |
2.8 | 2.9 | 2.6 | -8.7 | % | -12.4 | % | 2.5 | 2.7 | 8.8 | % | |||||||||||||||||||||
|
|
|
|
|
|
|
|
|
|
|
|
|
|
|
|
|
|||||||||||||||||
| Total Cash Costs (US$/boe) |
23.5 | 25.5 | 24.7 | 5.1 | % | -3.0 | % | 21.9 | 24.7 | 12.6 | % | |||||||||||||||||||||
|
|
|
|
|
|
|
|
|
|
|
|
|
|
|
|
|
|||||||||||||||||
In terms of our cost structure per unit basis, total cash costs decreased by 3.0% sequentially and increased 5.1% y/y due to the following:
| • | Lifting cost decreased by 2.3% q/q. When breaking down our lifting costs by type of operation in 3Q23, our unconventional activities averaged 5.8 US$/BOE, jumping 4.7% q/q due to higher activity and maintenance costs that overrun the expanded production during the quarter, while our conventional operations averaged 25.0 US$/BOE, representing a sequential decrease of 2.6% mainly driven by the evolution of the macroeconomic variables particularly affected by a discrete devaluation of the local currency that took place in mid-August. Lifting cost gross within our shale core hub averaged 4.2 US$/BOE in 3Q23, remaining almost flat versus the previous quarter. |
11
| • | Royalties within the upstream segment and other taxes remained essentially flat compared to the previous quarter, where natural gas royalties jumped by 8.5% and crude oil royalties decreased by 2.5%, mainly due to the aforementioned variations in realization prices. |
| • | The sequential contraction in Other costs is driven by non-recurrent charges recorded in 2Q23. |
Lastly, it is worth mentioning that during Q3, the Company accounted a non-recurring impairment charge in our natural gas assets from the Neuquina basin of 506 million dollars, pre-tax, primarily on the back of lower long-term expected prices as a result of increased competition and potential oversupply in the domestic natural gas market in coming years.
In summary, Adjusted EBITDA for the upstream segment reached US$735 million in the quarter, increasing by 4.4% q/q and decreasing 20.2% y/y.
12
CAPEX:
Upstream CAPEX totaled US$1,150 million in 3Q23, increasing by 13.1% sequentially and by 38.1% y/y, where 62.9% was allocated to drilling and workover activities, 29.5% to new facilities or the expansion of existing ones, and the remaining 7.5% to exploration and other upstream activities.
During 3Q23, drilling and workover activities showed a positive trend, completing a total of 67 new wells in our operated blocks, including 38 new wells completed in our unconventional operated blocks, 34 of shale oil and 4 of shale gas, reaching a total of 117 completed horizontal shale wells during the first nine months of the year.
Regarding our shale operations, during 3Q23 we made progress in the following developments:
| • | In terms of efficiencies within our shale operations, in Q3 we continued setting new quarterly records on drilling and fracking performance, averaging 297 meters per day in drilling and over 217 stages per set per month on fracking, highlighting that during September, we achieved the highest drilling speed for one well in Aguada del Cañar block, reaching 415 meters per day for a well of over 3,200 meters of horizontal length, which was fully drilled in 14 days. |
| • | Regarding of our shale exploratory strategy, in September, we were awarded with two new shale exploratory concessions in Palermo Aike, La Azuzena and El Campamento Este, to explore their potential in coming years. |
On the conventional side, our operations maintained their focus on sustainability related activities aiming to further reduce the priority risks in our facilities. Moreover, tertiary recovery activities continued being highly relevant in Manantiales Behr, El Trébol, and Chachahuen.

13
| Industrialization Operating data Unaudited Figures |
3Q22 | 2Q23 | 3Q23 | Y/Y Δ | Q/Q Δ | 9M22 | 9M23 | Y/Y Δ | ||||||||||||||||||||||||
| Crude processed (Kbbld) |
279.0 | 305.1 | 276.1 | -1.1 | % | -9.5 | % | 282.8 | 296.0 | 4.7 | % | |||||||||||||||||||||
| Refinery utilization (%) |
85.0 | % | 93.0 | % | 84.1 | % | -90bps | -885bps | 86 | % | 90 | % | 402bps | |||||||||||||||||||
Nominal capacity at 328.1 Kbbl/d since 1Q21.
Crude oil processed during the quarter stood at 276.1 Kbbl/d, which represented a decrease of 9.5% q/q and of 1.1% y/y. In a sequential basis, the contraction was driven by two programmed maintenance stoppages at the Lujan de Cuyo refinery in the topping, coker and hydrotreating units executed in July and August and the shutdown of a topping unit at La Plata refinery, which started in September, as the final stage of its revamping.
| Industrialization Financials Unaudited Figures, in US$ million |
3Q22 | 2Q23 | 3Q23 | Y/Y Δ | Q/Q Δ | 9M22 | 9M23 | Y/Y Δ | ||||||||||||||||||||||||
| Revenues |
3,478 | 2,894 | 2,770 | -20.4 | % | -4.3 | % | 9,309 | 8,768 | -5.8 | % | |||||||||||||||||||||
|
|
|
|
|
|
|
|
|
|
|
|
|
|
|
|
|
|||||||||||||||||
| Depreciation & amortization |
(111 | ) | (126 | ) | (124 | ) | 11.7 | % | -1.6 | % | (330 | ) | (374 | ) | 13.3 | % | ||||||||||||||||
| Industrialization cost |
(409 | ) | (446 | ) | (451 | ) | 10.2 | % | 1.0 | % | (1,103 | ) | (1,311 | ) | 18.9 | % | ||||||||||||||||
| Fuels imports (third parties) |
(559 | ) | (158 | ) | (214 | ) | -61.6 | % | 35.8 | % | (1,170 | ) | (715 | ) | -38.9 | % | ||||||||||||||||
| Crude oil purchases (intersegment + third parties) |
(1,819 | ) | (1,662 | ) | (1,480 | ) | -18.7 | % | -10.9 | % | (4,829 | ) | (4,944 | ) | 2.4 | % | ||||||||||||||||
| Biofuel purchases (third parties) |
(301 | ) | (230 | ) | (197 | ) | -34.7 | % | -14.3 | % | (718 | ) | (656 | ) | -8.6 | % | ||||||||||||||||
| Stock variations |
240 | (25 | ) | (237 | ) | N/A | 838.4 | % | 372 | (171 | ) | N/A | ||||||||||||||||||||
| Other |
(232 | ) | (92 | ) | (160 | ) | -31.2 | % | 73.2 | % | (501 | ) | (347 | ) | -30.7 | % | ||||||||||||||||
|
|
|
|
|
|
|
|
|
|
|
|
|
|
|
|
|
|||||||||||||||||
| Operating income / (loss) before impairment of assets |
286 | 155 | (93 | ) | N/A | N/A | 1,031 | 250 | -75.8 | % | ||||||||||||||||||||||
|
|
|
|
|
|
|
|
|
|
|
|
|
|
|
|
|
|||||||||||||||||
| Impairment of assets |
— | — | — | N/A | N/A | — | — | N/A | ||||||||||||||||||||||||
|
|
|
|
|
|
|
|
|
|
|
|
|
|
|
|
|
|||||||||||||||||
| Operating income / (loss) |
286 | 155 | (93 | ) | N/A | N/A | 1,031 | 250 | -75.8 | % | ||||||||||||||||||||||
|
|
|
|
|
|
|
|
|
|
|
|
|
|
|
|
|
|||||||||||||||||
| Depreciation & amortization |
111 | 126 | 124 | 11.7 | % | -1.6 | % | 330 | 374 | 13.3 | % | |||||||||||||||||||||
|
|
|
|
|
|
|
|
|
|
|
|
|
|
|
|
|
|||||||||||||||||
| EBITDA |
397 | 281 | 31 | -92.2 | % | -89.0 | % | 1,361 | 624 | -54.1 | % | |||||||||||||||||||||
|
|
|
|
|
|
|
|
|
|
|
|
|
|
|
|
|
|||||||||||||||||
| Leasing |
(1 | ) | (20 | ) | (18 | ) | 1497.7 | % | -9.8 | % | (5 | ) | (59 | ) | 990.1 | % | ||||||||||||||||
|
|
|
|
|
|
|
|
|
|
|
|
|
|
|
|
|
|||||||||||||||||
| Adjusted EBITDA |
396 | 261 | 13 | -96.8 | % | -95.1 | % | 1,356 | 565 | -58.3 | % | |||||||||||||||||||||
|
|
|
|
|
|
|
|
|
|
|
|
|
|
|
|
|
|||||||||||||||||
| Inventories price effect of oil products |
43 | (22 | ) | (69 | ) | N/A | 213.4 | % | 265 | (139 | ) | N/A | ||||||||||||||||||||
|
|
|
|
|
|
|
|
|
|
|
|
|
|
|
|
|
|||||||||||||||||
| Adjusted EBITDA excl. inventories price effect of oil products |
353 | 283 | 82 | -76.9 | % | -71.1 | % | 1,090 | 705 | -35.4 | % | |||||||||||||||||||||
|
|
|
|
|
|
|
|
|
|
|
|
|
|
|
|
|
|||||||||||||||||
| Capex |
202 | 253 | 301 | 49.4 | % | 19.4 | % | 445 | 756 | 69.9 | % | |||||||||||||||||||||
|
|
|
|
|
|
|
|
|
|
|
|
|
|
|
|
|
|||||||||||||||||
Stock variations include price effects by US$43 million in 3Q22, US$(22) million for 2Q23 and US$(69) million for 3Q23.
Revenues – mainly intersegment revenues with Commercialization segment—totaled US$2,770 million in 3Q23, a decrease of 4.3% compared to 2Q23, mainly driven by lower local prices of diesel, gasoline and other refined and petrochemical products, partially offset by higher volumes dispatched of diesel, gasoline and jet fuel, among others.
OPEX for this segment increased 1.0% q/q, mainly driven by higher maintenance and transportation costs, the latter aligned with higher volumes sold in the local market, partially offset by the evolution of the macroeconomic variables mentioned above.
Separately, fuels imports increased by 35.8% q/q, driven by higher prices of 17.3% and larger imported volumes of 15.7%. The sequential growth of diesel imports volumes can be explained by higher demand and the programmed stoppages at Luján de Cuyo and La Plata refineries described above. On the other hand, during the quarter, we did not import gasoline, consequently, the exceptional demand hike was supplied through significant inventory drawdown.
14
Crude oil purchases (including intersegment purchases to our Upstream operations) dropped 10.9% q/q, as a result of a price contraction of 6.2% and a decline in volumes of 5.0%, driven by lower processing levels recorded in Q3.
Biofuel purchases decreased by 14.3%, where purchases of biodiesel declined 21.2%, and purchases of bioethanol dropped 7.7%. Biodiesel purchases contraction was mainly the result of the lower blend in diesel sales, the latter due to supply constrains in the local market, while bioethanol purchases decreased mainly as a result of lower prices.
15
CAPEX:
In 3Q23, Industrialization CAPEX totaled US$301 million, setting a 19.4% increase compared to 2Q23 and a rise of 49.4% y/y. Out of the total, 67.6% was allocated to refining, 21.1% to midstream oil, 11.1% to logistics and the remaining 0.2% to others.
During Q3, we continued making progress with the execution of the new fuel specifications project, including the construction of a new diesel hydrotreatment unit at the Luján de Cuyo refinery and a gasoline hydrotreatment and revamping of existing gasoline units in La Plata refinery. The purpose of these works is to comply with the new fuel specifications established by Resolutions No. 576/2019 and 492/2023, which will come into force in 2025. In addition, the revamping of a topping unit at the La Plata refinery, which will allow to process greater shale oil, is nearing completion and is expected to be ready by the end of 2023. In the same line, in the Luján de Cuyo and Plaza Huincul refineries, we keep progressing on the revamping of the topping units.
In terms of midstream oil investments, we continued with a steady progress in the main projects aimed at unlocking the evacuation capacity of the Neuquina basin:
| • | Regarding the expansion of the existing system to the Atlantic, in September, our subsidiary Oldelval added 20 Kbbl/d of evacuation capacity. In addition, OTE continued moving forward in the construction of two new storage facilities of 50 Km3 each and the revamping of the export terminal at Puerto Rosales. |
| • | Regarding the evacuation to the Pacific, the Vaca Muerta North pipeline is nearing completion and is expected to be fully operational during November. However, since the shale oil to be exported through the new Vaca Muerta North pipeline presents a lighter quality than the heavier oil currently being exported to Chile, the export growth enabled by the new pipeline is expected to be gradual, likely to start increasing as of early next year. |
| • | Finally, regarding the Vaca Muerta South project, during the third quarter we began the design competition process for the new pipeline and export terminal and obtained the environmental permits for the first tranche of 127 km that will connect Loma Campana to Allen. |
Lastly, during this quarter, we continued improving safety conditions for our people and facilities, complying with the current environmental regulations in refining and logistics operations.

16
| Commercialization Operating data Unaudited Figures |
3Q22 | 2Q23 | 3Q23 | Y/Y Δ | Q/Q Δ | 9M22 | 9M23 | Y/Y Δ | ||||||||||||||||||||||||
| Sales volume to third parties |
||||||||||||||||||||||||||||||||
| Sales of refined products (Km3) |
4,896 | 4,873 | 4,936 | 0.8 | % | 1.3 | % | 14,243 | 14,599 | 2.5 | % | |||||||||||||||||||||
| Total domestic market (*) |
4,536 | 4,483 | 4,581 | 1.0 | % | 2.2 | % | 13,200 | 13,411 | 1.6 | % | |||||||||||||||||||||
| of which Gasoline |
1,419 | 1,431 | 1,500 | 5.7 | % | 4.8 | % | 4,193 | 4,445 | 6.0 | % | |||||||||||||||||||||
| of which Diesel |
2,288 | 2,227 | 2,272 | -0.7 | % | 2.0 | % | 6,602 | 6,551 | -0.8 | % | |||||||||||||||||||||
| Total export market |
360 | 390 | 355 | -1.3 | % | -8.9 | % | 1,042 | 1,189 | 14.0 | % | |||||||||||||||||||||
|
|
|
|
|
|
|
|
|
|
|
|
|
|
|
|
|
|||||||||||||||||
| Sales of petrochemical products (Ktn) |
115 | 122 | 151 | 31.0 | % | 24.0 | % | 382 | 413 | 8.1 | % | |||||||||||||||||||||
|
|
|
|
|
|
|
|
|
|
|
|
|
|
|
|
|
|||||||||||||||||
| Domestic market |
90 | 70 | 86 | -4.5 | % | 22.8 | % | 301 | 240 | -20.3 | % | |||||||||||||||||||||
| Export market |
25 | 51 | 65 | 159.2 | % | 25.7 | % | 82 | 174 | 112.5 | % | |||||||||||||||||||||
|
|
|
|
|
|
|
|
|
|
|
|
|
|
|
|
|
|||||||||||||||||
| Sales of Natural Gas as producers (Mm3) |
3,250 | 2,983 | 3,241 | -0.3 | % | 8.6 | % | 9,562 | 9,069 | -5.2 | % | |||||||||||||||||||||
|
|
|
|
|
|
|
|
|
|
|
|
|
|
|
|
|
|||||||||||||||||
| Domestic market |
3,128 | 2,883 | 3,183 | 1.8 | % | 10.4 | % | 9,147 | 8,716 | -4.7 | % | |||||||||||||||||||||
| Export market |
122 | 100 | 58 | -52.6 | % | -42.0 | % | 415 | 353 | -15.0 | % | |||||||||||||||||||||
|
|
|
|
|
|
|
|
|
|
|
|
|
|
|
|
|
|||||||||||||||||
| Sales of fertilizers, grain and flours (Ktn) |
691 | 448 | 431 | -37.7 | % | -3.9 | % | 1,749 | 1,094 | -37.5 | % | |||||||||||||||||||||
|
|
|
|
|
|
|
|
|
|
|
|
|
|
|
|
|
|||||||||||||||||
| Domestic market |
292 | 345 | 365 | 24.9 | % | 5.7 | % | 609 | 916 | 50.5 | % | |||||||||||||||||||||
| Export market |
398 | 103 | 66 | -83.5 | % | -36.1 | % | 1,140 | 178 | -84.4 | % | |||||||||||||||||||||
| Net average prices |
||||||||||||||||||||||||||||||||
| Gasoline (USD/m3) (domestic market) |
564 | 526 | 499 | -11.6 | % | -5.2 | % | 562 | 520 | -7.5 | % | |||||||||||||||||||||
| Diesel (USD/m3) (domestic market) |
810 | 692 | 640 | -21.0 | % | -7.4 | % | 719 | 690 | -4.0 | % | |||||||||||||||||||||
| Petrochemical & others refined products (USD/bbl) |
104 | 78 | 73 | -29.1 | % | -5.8 | % | 98 | 79 | -20.0 | % | |||||||||||||||||||||
Net Average domestic prices for gasoline and diesel are net of taxes, commissions, commercial bonuses and freights.
(*) Includes volumes sold by Industrialization
Domestic gasoline sales volumes increased by 4.8% compared to 2Q23, while domestic diesel volumes increased 2.0% q/q due to higher retail and transportation sales partially compensated by lower power generation demand. In terms of market share of our fuels, Argentina’s total market grew by 2.4% q/q for gasoline and decrease by 1.0% q/q for diesel, resulting in an expansion of YPF’s market share in both gasoline and diesel.
Petrochemical volumes grew 24.0% q/q mainly due to lower demand in both local and export markets recorded in 2Q23 affected by programmed stoppages in some of our industrial customers.
Natural gas sales volumes increased 8.6% q/q driven by the higher seasonal demand, but still slightly below 2022’s demand on the back of limited availability of transportation, and volumes exports declined 42.0% q/q aligned with the lowest sales recorded in the market.
Fertilizers, grain and flours sales volumes decreased by 3.9% q/q, as a result of lower seasonal demand of grains and flours still affected by the severe drought recorded in Argentina in the first half of 2023, partially offset by higher volumes sold of fertilizers.
Net average diesel prices in the domestic market measured in dollar terms decreased by 7.4% q/q, while net average gasoline prices decreased by 5.2% q/q, mainly driven by the discrete devaluation of the local currency that took place in mid-August, which was not fully passed through in the retail segment, in contrast to wholesale diesel prices that were fully adjusted. Moreover, the average price for “Petrochemical & other refined products” declined by 5.8% q/q and 29.1% y/y, aligned with a downward trend in international prices of petrochemical and certain refined products such as lubricants, petroleum coke and jet fuel.
17
| Commercialization Financials Unaudited Figures, in US$ million |
3Q22 | 2Q23 | 3Q23 | Y/Y Δ | Q/Q Δ | 9M22 | 9M23 | Y/Y Δ | ||||||||||||||||||||||||
| Diesel (third parties) |
1,945 | 1,599 | 1,556 | -20.0 | % | -2.7 | % | 4,983 | 4,765 | -4.4 | % | |||||||||||||||||||||
| Gasoline (third parties) |
879 | 828 | 821 | -6.6 | % | -0.8 | % | 2,575 | 2,536 | -1.5 | % | |||||||||||||||||||||
| Natural gas (intersegment + third parties) |
596 | 483 | 560 | -6.0 | % | 15.9 | % | 1,489 | 1,403 | -5.8 | % | |||||||||||||||||||||
| Other domestic market |
1,016 | 776 | 809 | -20.3 | % | 4.3 | % | 2,558 | 2,303 | -10.0 | % | |||||||||||||||||||||
| Export market |
591 | 370 | 463 | -21.7 | % | 25.2 | % | 1,713 | 1,273 | -25.7 | % | |||||||||||||||||||||
|
|
|
|
|
|
|
|
|
|
|
|
|
|
|
|
|
|||||||||||||||||
| Revenues |
5,027 | 4,056 | 4,209 | -16.3 | % | 3.8 | % | 13,317 | 12,281 | -7.8 | % | |||||||||||||||||||||
|
|
|
|
|
|
|
|
|
|
|
|
|
|
|
|
|
|||||||||||||||||
| Depreciation & amortization |
(28 | ) | (12 | ) | (18 | ) | -36.4 | % | 52.7 | % | (82 | ) | (48 | ) | -41.1 | % | ||||||||||||||||
| Refined & petrochemicals Products purchases (intersegment) |
(3,247 | ) | (2,681 | ) | (2,587 | ) | -20.3 | % | -3.5 | % | (8,743 | ) | (8,147 | ) | -6.8 | % | ||||||||||||||||
| Non-oil agro purchases (third parties) |
(387 | ) | (253 | ) | (194 | ) | -49.8 | % | -23.2 | % | (1,080 | ) | (561 | ) | -48.0 | % | ||||||||||||||||
| Natural gas purchases (intersegment + third parties) |
(584 | ) | (479 | ) | (558 | ) | -4.5 | % | 16.5 | % | (1,465 | ) | (1,393 | ) | -4.9 | % | ||||||||||||||||
| Stock variations |
(15 | ) | 42 | (28 | ) | 85.8 | % | N/A | 164 | 18 | -88.9 | % | ||||||||||||||||||||
| Commercialization cost & Other |
(658 | ) | (627 | ) | (736 | ) | 11.9 | % | 17.5 | % | (1,781 | ) | (1,946 | ) | 9.3 | % | ||||||||||||||||
|
|
|
|
|
|
|
|
|
|
|
|
|
|
|
|
|
|||||||||||||||||
| Operating income before impairment of assets |
108 | 46 | 88 | -18.5 | % | 91.3 | % | 331 | 204 | -38.4 | % | |||||||||||||||||||||
|
|
|
|
|
|
|
|
|
|
|
|
|
|
|
|
|
|||||||||||||||||
| Impairment of assets |
— | — | — | N/A | N/A | — | — | N/A | ||||||||||||||||||||||||
|
|
|
|
|
|
|
|
|
|
|
|
|
|
|
|
|
|||||||||||||||||
| Operating income |
108 | 46 | 88 | -18.5 | % | 91.3 | % | 331 | 204 | -38.4 | % | |||||||||||||||||||||
|
|
|
|
|
|
|
|
|
|
|
|
|
|
|
|
|
|||||||||||||||||
| Depreciation & amortization |
28 | 12 | 18 | -36.4 | % | 52.7 | % | 82 | 48 | -41.1 | % | |||||||||||||||||||||
|
|
|
|
|
|
|
|
|
|
|
|
|
|
|
|
|
|||||||||||||||||
| EBITDA |
135 | 57 | 106 | -21.8 | % | 84.9 | % | 413 | 252 | -38.9 | % | |||||||||||||||||||||
|
|
|
|
|
|
|
|
|
|
|
|
|
|
|
|
|
|||||||||||||||||
| Leasing |
(19 | ) | 2 | (3 | ) | -81.2 | % | N/A | (53 | ) | (11 | ) | -79.5 | % | ||||||||||||||||||
|
|
|
|
|
|
|
|
|
|
|
|
|
|
|
|
|
|||||||||||||||||
| Adjusted EBITDA |
117 | 59 | 102 | -12.3 | % | 74.1 | % | 360 | 241 | -32.9 | % | |||||||||||||||||||||
|
|
|
|
|
|
|
|
|
|
|
|
|
|
|
|
|
|||||||||||||||||
| Inventories price effect of oil products |
(2 | ) | (9 | ) | (6 | ) | 145.8 | % | -39.2 | % | 35 | (25 | ) | N/A | ||||||||||||||||||
|
|
|
|
|
|
|
|
|
|
|
|
|
|
|
|
|
|||||||||||||||||
| Adjusted EBITDA excl. inventories price effect of oil products |
119 | 68 | 108 | -9.2 | % | 58.4 | % | 325 | 267 | -17.9 | % | |||||||||||||||||||||
|
|
|
|
|
|
|
|
|
|
|
|
|
|
|
|
|
|||||||||||||||||
| CAPEX |
20 | 28 | 21 | 3.2 | % | -25.0 | % | 46 | 61 | 32.6 | % | |||||||||||||||||||||
|
|
|
|
|
|
|
|
|
|
|
|
|
|
|
|
|
|||||||||||||||||
Stock variations include price effects by US$ (27) million in 3Q22, US$(35) million for 2Q23 and US$(2) million for 3Q23.
Sales of natural gas include domestic and external markets
Revenues during 3Q23 totaled US$4,209 million, an increase of 3.8% compared to 2Q23, mainly as a result of higher seasonal natural gas sales, higher of crude oil exports to Chile and larger volumes dispatched of fuels; partially offset by lower prices of local fuels and the basket of refined products other than gasoline and diesel.
Refined & petrochemicals products purchases (intersegment) to Industrialization segment, decreased by 3.5% q/q, mainly due to lower prices partially offset by higher volumes dispatched of fuels.
Non-oil agro purchases decreased by 23.2% q/q, aligned with the contraction in volumes sales.
Finally, combining the results of the Industrialization and Commercialization segments, excluding petrochemicals and non-oil agro business, the Adjusted EBITDA of the Refining & Marketing business during the 3Q23 reached US$3.3 per barrel.
18
CAPEX:
In 3Q23, Commercialization CAPEX totaled US$21 million, 25.0% below the 2Q23 and 3.2% higher than the same period of 2022.
Besides the regular investments related to maintaining commercial facilities and improving safety conditions to comply with the environmental regulations for the dispatch of oil products, in 3Q23 the construction of the agro commercial facility in Tres Arroyos was completed and will be fully operational during 4Q23. Moreover, the new flagship Echeverria gas station started operations during September.
19
| GAS & POWER Unaudited Figures, in US$ million |
3Q22 | 2Q23 | 3Q23 | Y/Y Δ | Q/Q Δ | 9M22 | 9M23 | Y/Y Δ | ||||||||||||||||||||||||
| Natural gas retail (third parties) |
166 | 145 | 161 | -3.1 | % | 10.8 | % | 395 | 371 | -6.1 | % | |||||||||||||||||||||
| Midstream Gas Revenues (intersegment + third parties) |
52 | 48 | 48 | -7.3 | % | 0.2 | % | 155 | 150 | -3.7 | % | |||||||||||||||||||||
| Other |
66 | 71 | 81 | 22.6 | % | 14.5 | % | 152 | 178 | 17.7 | % | |||||||||||||||||||||
|
|
|
|
|
|
|
|
|
|
|
|
|
|
|
|
|
|||||||||||||||||
| Revenues |
284 | 264 | 290 | 2.1 | % | 9.8 | % | 702 | 699 | -0.4 | % | |||||||||||||||||||||
|
|
|
|
|
|
|
|
|
|
|
|
|
|
|
|
|
|||||||||||||||||
| Depreciation & amortization |
(20 | ) | (31 | ) | (16 | ) | -22.6 | % | -50.1 | % | (62 | ) | (62 | ) | 0.0 | % | ||||||||||||||||
| Natural gas retail purchases (intersegment + third parties) |
(112 | ) | (98 | ) | (123 | ) | 9.7 | % | 26.1 | % | (254 | ) | (271 | ) | 7.0 | % | ||||||||||||||||
| Midstream Gas purchases (intersegment) |
(14 | ) | (14 | ) | (15 | ) | 8.5 | % | 6.1 | % | (45 | ) | (48 | ) | 4.7 | % | ||||||||||||||||
| Operating cost & Other |
(103 | ) | (99 | ) | (107 | ) | 4.3 | % | 8.3 | % | (278 | ) | (294 | ) | 5.8 | % | ||||||||||||||||
|
|
|
|
|
|
|
|
|
|
|
|
|
|
|
|
|
|||||||||||||||||
| Operating income before impairment of assets |
35 | 22 | 29 | -17.1 | % | N/A | 63 | 24 | -61.9 | % | ||||||||||||||||||||||
|
|
|
|
|
|
|
|
|
|
|
|
|
|
|
|
|
|||||||||||||||||
| Impairment of assets |
— | — | — | N/A | N/A | — | — | N/A | ||||||||||||||||||||||||
|
|
|
|
|
|
|
|
|
|
|
|
|
|
|
|
|
|||||||||||||||||
| Operating income |
35 | 22 | 29 | -17.1 | % | N/A | 63 | 24 | -61.9 | % | ||||||||||||||||||||||
|
|
|
|
|
|
|
|
|
|
|
|
|
|
|
|
|
|||||||||||||||||
| Depreciation & amortization |
20 | 31 | 16 | -22.6 | % | -50.1 | % | 62 | 62 | 0.0 | % | |||||||||||||||||||||
|
|
|
|
|
|
|
|
|
|
|
|
|
|
|
|
|
|||||||||||||||||
| EBITDA |
55 | 53 | 45 | -19.1 | % | -16.2 | % | 125 | 86 | -31.2 | % | |||||||||||||||||||||
|
|
|
|
|
|
|
|
|
|
|
|
|
|
|
|
|
|||||||||||||||||
| Leasing |
(6 | ) | (12 | ) | (8 | ) | 29.8 | % | -35.0 | % | (20 | ) | (19 | ) | -1.6 | % | ||||||||||||||||
|
|
|
|
|
|
|
|
|
|
|
|
|
|
|
|
|
|||||||||||||||||
| Adjusted EBITDA |
49 | 42 | 37 | -24.9 | % | -11.0 | % | 105 | 67 | -36.7 | % | |||||||||||||||||||||
|
|
|
|
|
|
|
|
|
|
|
|
|
|
|
|
|
|||||||||||||||||
| CAPEX |
27 | 45 | 39 | 42.3 | % | -13.3 | % | 43 | 136 | 216.3 | % | |||||||||||||||||||||
|
|
|
|
|
|
|
|
|
|
|
|
|
|
|
|
|
|||||||||||||||||
Revenues during 3Q23 totaled US$290 million, increasing by 9.8% compared to 2Q23, mainly due to an increase of 10.8% of natural gas sales from our controlled subsidiary Metrogas, driven by higher natural gas volumes dispatched of 39.3%, partially offset by a contraction in average prices of 20.5%.
Other sales expanded 14.5% q/q, while midstream sales including propane, butane and gasolines, remained flat.
Natural gas retail purchases jumped 26.1% q/q, in line with the increasing sales. Moreover, Operating costs & other rose 8.3% q/q, mainly led by higher costs from our subsidiary Metrogas aligned with the larger volumes sold of natural gas described above.
As a whole, Adjusted EBITDA stood at US$37 million, decreasing by 11.0% compared to the US$42 recorded in 2Q23.
20
CAPEX:
Gas & Power CAPEX totaled US$39 million in Q3, decreasing by 13.3% q/q. During the quarter, investments were mainly focused on the construction of new midstream gas facilities aiming at de-bottlenecking the potential of the Vaca Muerta formation. In that sense, as of September 2023 we achieved 89% progress in the revamping of the NGLs facility “Tex Loma La Lata”, which first stage was put in operation by September and is expected to be fully operational by the end of November, increasing the processing capacity up to 6 Mm3/d of natural gas and 600 tons/d of NGLs in the core hub blocks. In addition, we continued working in the Rincón del Mangrullo gas pipeline expansion project, which reached 87% progress and is expected to be completed by the end of the year.
21
| Corporate & Other Financials Unaudited Figures, in US$ million |
3Q22 | 2Q23 | 3Q23 | Y/Y Δ | Q/Q Δ | 9M22 | 9M23 | Y/Y Δ | ||||||||||||||||||||||||
| Revenues |
296 | 335 | 360 | 22.0 | % | 7.5 | % | 761 | 1,006 | 32.2 | % | |||||||||||||||||||||
|
|
|
|
|
|
|
|
|
|
|
|
|
|
|
|
|
|||||||||||||||||
| Operating costs and other |
(383 | ) | (425 | ) | (454 | ) | 18.8 | % | 6.9 | % | (986 | ) | (1,254 | ) | 27.2 | % | ||||||||||||||||
|
|
|
|
|
|
|
|
|
|
|
|
|
|
|
|
|
|||||||||||||||||
| Operating income / (loss) before impairment of assets |
(87 | ) | (90 | ) | (94 | ) | 8.0 | % | 4.4 | % | (225 | ) | (248 | ) | 10.2 | % | ||||||||||||||||
|
|
|
|
|
|
|
|
|
|
|
|
|
|
|
|
|
|||||||||||||||||
| Impairment of assets |
— | — | — | N/A | N/A | — | — | N/A | ||||||||||||||||||||||||
|
|
|
|
|
|
|
|
|
|
|
|
|
|
|
|
|
|||||||||||||||||
| Operating result |
(87 | ) | (90 | ) | (94 | ) | 8.0 | % | 4.4 | % | (225 | ) | (248 | ) | 10.2 | % | ||||||||||||||||
|
|
|
|
|
|
|
|
|
|
|
|
|
|
|
|
|
|||||||||||||||||
| Depreciation & amortization |
22 | 17 | 15 | -30.2 | % | -11.4 | % | 65 | 47 | -28.0 | % | |||||||||||||||||||||
|
|
|
|
|
|
|
|
|
|
|
|
|
|
|
|
|
|||||||||||||||||
| EBITDA |
(65 | ) | (73 | ) | (79 | ) | 20.7 | % | 8.1 | % | (160 | ) | (201 | ) | 25.9 | % | ||||||||||||||||
|
|
|
|
|
|
|
|
|
|
|
|
|
|
|
|
|
|||||||||||||||||
| Leasing |
— | — | — | N/A | N/A | — | — | N/A | ||||||||||||||||||||||||
|
|
|
|
|
|
|
|
|
|
|
|
|
|
|
|
|
|||||||||||||||||
| Adjusted EBITDA |
(65 | ) | (73 | ) | (79 | ) | 20.7 | % | 8.1 | % | (160 | ) | (201 | ) | 25.9 | % | ||||||||||||||||
|
|
|
|
|
|
|
|
|
|
|
|
|
|
|
|
|
|||||||||||||||||
| CAPEX |
55 | 31 | 35 | -35.8 | % | 12.9 | % | 93 | 83 | -10.8 | % | |||||||||||||||||||||
|
|
|
|
|
|
|
|
|
|
|
|
|
|
|
|
|
|||||||||||||||||
This business segment involves mainly corporate costs and other activities that are not reported in any of the previously mentioned business segments.
Corporate and Other Adjusted EBITDA represented a loss of US$79 million in 3Q23, compared to a loss of US$73 million in 2Q23.
The negative variation is mainly explained by an increase in corporate OPEX due to higher activity in marketing and technology areas and the evolution of the macroeconomic variables.
22
5. LIQUIDITY AND SOURCES OF CAPITAL
| Summary Consolidated Cash Flow Unaudited Figures, in US$ million |
3Q22 | 2Q23 | 3Q23 | Y/Y Δ | Q/Q Δ | 9M22 | 9M23 | Y/Y Δ | ||||||||||||||||||||||||
| Cash BoP |
667 | 1,014 | 1,167 | 75.0 | % | 15.1 | % | 611 | 773 | 26.5 | % | |||||||||||||||||||||
| Net cash flow from operating activities |
1,582 | 1,309 | 1,399 | -11.6 | % | 6.9 | % | 4,362 | 4,205 | -3.6 | % | |||||||||||||||||||||
| Net cash flow from investing activities |
(1,006 | ) | (1,259 | ) | (1,321 | ) | 31.3 | % | 4.9 | % | (2,886 | ) | (3,769 | ) | 30.6 | % | ||||||||||||||||
| Net cash flow from financing activities |
(335 | ) | 214 | 158 | N/A | -26.2 | % | (1,072 | ) | 389 | N/A | |||||||||||||||||||||
| FX adjustments & other |
(74 | ) | (111 | ) | (107 | ) | 44.6 | % | -3.6 | % | (181 | ) | (302 | ) | 66.9 | % | ||||||||||||||||
|
|
|
|
|
|
|
|
|
|
|
|
|
|
|
|
|
|||||||||||||||||
| Cash EoP |
834 | 1,167 | 1,296 | 55.4 | % | 11.1 | % | 834 | 1,296 | 55.4 | % | |||||||||||||||||||||
|
|
|
|
|
|
|
|
|
|
|
|
|
|
|
|
|
|||||||||||||||||
| Investment in financial assets |
500 | 303 | 182 | -63.6 | % | -39.9 | % | 575 | 182 | -68.3 | % | |||||||||||||||||||||
|
|
|
|
|
|
|
|
|
|
|
|
|
|
|
|
|
|||||||||||||||||
| Cash + short-term investments EoP |
1,334 | 1,470 | 1,478 | 10.8 | % | 0.5 | % | 1,409 | 1,478 | 4.9 | % | |||||||||||||||||||||
|
|
|
|
|
|
|
|
|
|
|
|
|
|
|
|
|
|||||||||||||||||
| FCF |
243 | (284 | ) | (379 | ) | N/A | 33.5 | % | 943 | (680 | ) | N/A | ||||||||||||||||||||
|
|
|
|
|
|
|
|
|
|
|
|
|
|
|
|
|
|||||||||||||||||
FCF = Cash flow from Operations less capex (Investing activities), M&A (Investing activities), and interest and leasing payments (Financing activities).
In 3Q23 our cash flow from operations reached US$1,399 million, increasing 6.9% sequentially, despite the sequential contraction in adjusted EBITDA in the third quarter, primarily due to a negative non-cash inventory variation recorded in 3Q23, as well as other positive working capital variations, such as the temporary deferred payment of part of the purchases of crude oil from third parties to the first days of October.
Net cash flow from investing activities was negative US$1,321 million, compared to negative US$1,259 million in 2Q23. This variation was mainly driven by the expansion in our investment plan partially offset by higher sales and maturities of financial assets. In 3Q22, net cash flow from investing activities was negative US$1,006 million, below the 3Q23, mainly driven by the expansion of our CAPEX plan in 2023.
Net cash flow from financing activities amounted to positive US$158 million in 3Q23 against a positive cash flow of US$214 million in 2Q23 as the Company continued progressing on its financial plan by securing both local and cross-border trade-related loans and by tapping the local capital markets.
As a result, the free cash flow for the period was negative by U$379 million, as the continued deployment of our ambitious capex plan together with our regular interest payments in the quarter and other expenses, was not fully compensated by the cash flow from operations.
In terms of liquidity, our cash and short-term investments stood at US$1,478 million by the end of September 2023, almost flat when compared to the previous quarter.
In terms of cash management, we have continued with an active asset management approach to minimize FX exposure, ending the quarter with a consolidated net FX exposure of only 2% of total liquidity, down from 13% as of the end of the second quarter.
23
| Net debt breakdown Unaudited Figures, in US$ million |
3Q22 | 2Q23 | 3Q23 | Q/Q Δ | ||||||||||||
| Short-term debt |
857 | 1,483 | 1,546 | 4.2 | % | |||||||||||
| Long-term debt |
6,133 | 6,299 | 6,607 | 4.9 | % | |||||||||||
|
|
|
|
|
|
|
|
|
|||||||||
| Total debt |
6,989 | 7,782 | 8,153 | 4.8 | % | |||||||||||
|
|
|
|
|
|
|
|
|
|||||||||
| Avg. Interest rate for AR$-debt |
56.2 | % | 87.5 | % | 109.2 | % | ||||||||||
| Avg. Interest rate for US$-debt |
7.9 | % | 7.1 | % | 6.2 | % | ||||||||||
| % of debt in AR$ |
2.1 | % | 2.6 | % | 2.5 | % | ||||||||||
|
|
|
|
|
|
|
|
|
|||||||||
| Cash + short term investments |
1,334 | 1,470 | 1,478 | 0.5 | % | |||||||||||
|
|
|
|
|
|
|
|
|
|||||||||
| % of liquidity dollarized |
69 | % | 87 | % | 98 | % | ||||||||||
|
|
|
|
|
|
|
|
|
|||||||||
| Net debt |
5,655 | 6,312 | 6,675 | 5.8 | % | |||||||||||
|
|
|
|
|
|
|
|
|
|||||||||
Average interest rates for AR$ and US$ debt refer to YPF on a stand-alone basis.
As of September 30, 2023, YPF’s consolidated net debt totaled US$6,675 million, increasing by US$363 million q/q and US$1,020 million y/y. The higher net debt and the lower 12-month rolling Adjusted EBITDA resulted in an increase in the net leverage ratio up to 1.7x.
In terms of financing, in August a new cross-border A/B loan led by CAF was disbursed for 375 million dollars, as an early refinancing of an existing loan, increasing the outstanding facility size by 150 million dollars and extending its average life by almost 3 years. This loan, with a well-defined ESG perspective, will be entirely allocated for the revamping of refineries aimed at reducing the sulfur content in the production of fuels, aligned with the energy transition path of the Company.
Moreover, during the quarter we continued tapping the local capital markets at very attractive financing costs by issuing a 5-year dollar-linked bond for 400 million dollars at 0% rate, as well as refinancing over US$ 160 million of local and cross border trade facilities.
Regarding our maturity profile, the Company faces debt maturities for the last three months of 2023 totaling an amount of US$329 million, mainly consisting in local bonds maturities (US$137 million for the 2% Dollar-Linked Notes due December 2023), international bonds amortization (US$60 million for the Secured Notes due 2026), and the remaining in short term trade facilities.
24
The following chart shows the consolidated principal debt maturity profile of the Company as of September 30th, 2023, expressed in millions of dollars:
25
6.1. CONSOLIDATED INCOME STATEMENT
| Income Statement Unaudited Figures, in US$ million |
3Q22 | 2Q23 | 3Q23 | Y/Y Δ | Q/Q Δ | 9M22 | 9M23 | Y/Y Δ | ||||||||||||||||||||||||
| Revenues |
5,357 | 4,375 | 4,504 | -15.9 | % | 2.9 | % | 14,112 | 13,117 | -7.1 | % | |||||||||||||||||||||
|
|
|
|
|
|
|
|
|
|
|
|
|
|
|
|
|
|||||||||||||||||
| Costs |
(3,754 | ) | (3,509 | ) | (3,689 | ) | -1.7 | % | 5.1 | % | (9,983 | ) | (10,497 | ) | 5.1 | % | ||||||||||||||||
|
|
|
|
|
|
|
|
|
|
|
|
|
|
|
|
|
|||||||||||||||||
| Gross profit |
1,603 | 866 | 815 | -49.2 | % | -5.9 | % | 4,129 | 2,620 | -36.5 | % | |||||||||||||||||||||
|
|
|
|
|
|
|
|
|
|
|
|
|
|
|
|
|
|||||||||||||||||
| Selling expenses |
(545 | ) | (482 | ) | (483 | ) | -11.4 | % | 0.2 | % | (1,444 | ) | (1,385 | ) | -4.1 | % | ||||||||||||||||
| Administrative expenses |
(167 | ) | (167 | ) | (194 | ) | 16.2 | % | 16.2 | % | (459 | ) | (518 | ) | 12.9 | % | ||||||||||||||||
| Exploration expenses |
(18 | ) | (8 | ) | (16 | ) | -11.1 | % | 100.0 | % | (42 | ) | (42 | ) | 0.0 | % | ||||||||||||||||
| Impairment of property, plant and equipment and intangible assets |
(98 | ) | — | (506 | ) | 416.3 | % | N/A | (98 | ) | (506 | ) | 416.3 | % | ||||||||||||||||||
| Other operating results, net |
(24 | ) | 12 | (3 | ) | -87.5 | % | N/A | (46 | ) | - | N/A | ||||||||||||||||||||
|
|
|
|
|
|
|
|
|
|
|
|
|
|
|
|
|
|||||||||||||||||
| Operating income |
751 | 221 | (387 | ) | N/A | N/A | 2,040 | 169 | -91.7 | % | ||||||||||||||||||||||
|
|
|
|
|
|
|
|
|
|
|
|
|
|
|
|
|
|||||||||||||||||
| Income of interests in companies and joint ventures |
141 | 94 | 44 | -68.8 | % | -53.2 | % | 388 | 227 | -41.5 | % | |||||||||||||||||||||
| Financial Income |
642 | 792 | 1,042 | 62.3 | % | 31.6 | % | 1,384 | 2,435 | 75.9 | % | |||||||||||||||||||||
| Financial Cost |
(623 | ) | (842 | ) | (930 | ) | 49.3 | % | 10.5 | % | (1,542 | ) | (2,482 | ) | 61.0 | % | ||||||||||||||||
| Other financial results |
66 | 190 | 94 | 42.4 | % | -50.5 | % | 166 | 395 | 138.0 | % | |||||||||||||||||||||
| Financial results, net |
85 | 140 | 206 | 142.4 | % | 47.1 | % | 8 | 348 | 4250.0 | % | |||||||||||||||||||||
|
|
|
|
|
|
|
|
|
|
|
|
|
|
|
|
|
|||||||||||||||||
| Net profit before income tax |
977 | 455 | (137 | ) | N/A | N/A | 2,436 | 744 | -69.5 | % | ||||||||||||||||||||||
|
|
|
|
|
|
|
|
|
|
|
|
|
|
|
|
|
|||||||||||||||||
| Income tax |
(284 | ) | (75 | ) | - | N/A | N/A | (666 | ) | (160 | ) | -76.0 | % | |||||||||||||||||||
|
|
|
|
|
|
|
|
|
|
|
|
|
|
|
|
|
|||||||||||||||||
| Net profit for the period |
693 | 380 | (137 | ) | N/A | N/A | 1,770 | 584 | -67.0 | % | ||||||||||||||||||||||
|
|
|
|
|
|
|
|
|
|
|
|
|
|
|
|
|
|||||||||||||||||
| Net profit for shareholders of the parent company |
692 | 335 | (128 | ) | N/A | N/A | 1,763 | 548 | -68.9 | % | ||||||||||||||||||||||
| Net profits for non-controlling interest |
1 | 45 | (9 | ) | N/A | N/A | 7 | 36 | 414.3 | % | ||||||||||||||||||||||
| Earnings per share attributable to shareholders of the parent company (basic and diluted) |
1.76 | 0.86 | (0.33 | ) | N/A | N/A | 4.48 | 1.40 | -68.8 | % | ||||||||||||||||||||||
Note: Information reported in accordance with International Financial Reporting Standards (IFRS).
| Income Statement Unaudited Figures, in AR$ million |
3Q22 | 2Q23 | 3Q23 | Y/Y Δ | Q/Q Δ | 9M22 | 9M23 | Y/Y Δ | ||||||||||||||||||||||||
| Revenues |
742,552 | 1,036,763 | 1,473,630 | 98.5 | % | 42.1 | % | 1,739,973 | 3,330,718 | 91.4 | % | |||||||||||||||||||||
|
|
|
|
|
|
|
|
|
|
|
|
|
|
|
|
|
|||||||||||||||||
| Costs |
(527,339 | ) | (848,400 | ) | (1,250,786 | ) | 137.2 | % | 47.4 | % | (1,241,107 | ) | (2,745,702 | ) | 121.2 | % | ||||||||||||||||
|
|
|
|
|
|
|
|
|
|
|
|
|
|
|
|
|
|||||||||||||||||
| Gross profit |
215,213 | 188,363 | 222,844 | 3.5 | % | 18.3 | % | 498,866 | 585,016 | 17.3 | % | |||||||||||||||||||||
|
|
|
|
|
|
|
|
|
|
|
|
|
|
|
|
|
|||||||||||||||||
| Selling expenses |
(76,245 | ) | (115,705 | ) | (160,553 | ) | 110.6 | % | 38.8 | % | (179,598 | ) | (359,008 | ) | 99.9 | % | ||||||||||||||||
| Administrative expenses |
(24,377 | ) | (41,214 | ) | (68,062 | ) | 179.2 | % | 65.1 | % | (58,369 | ) | (140,246 | ) | 140.3 | % | ||||||||||||||||
| Exploration expenses |
(2,593 | ) | (1,847 | ) | (5,487 | ) | 111.6 | % | 197.1 | % | (5,269 | ) | (11,032 | ) | 109.4 | % | ||||||||||||||||
| Impairment of property, plant and equipment and intangible assets |
(14,108 | ) | — | (176,769 | ) | 1153.0 | % | N/A | (14,108 | ) | (176,769 | ) | 1153.0 | % | ||||||||||||||||||
| Other operating results, net |
(2,478 | ) | 3,696 | 1,640 | N/A | -55.6 | % | (5,305 | ) | 3,901 | N/A | |||||||||||||||||||||
|
|
|
|
|
|
|
|
|
|
|
|
|
|
|
|
|
|||||||||||||||||
| Operating income |
95,412 | 33,293 | (186,387 | ) | N/A | N/A | 236,217 | (98,138 | ) | N/A | ||||||||||||||||||||||
|
|
|
|
|
|
|
|
|
|
|
|
|
|
|
|
|
|||||||||||||||||
| Income of interests in companies and joint ventures |
19,038 | 21,850 | 13,182 | -30.8 | % | -39.7 | % | 46,732 | 51,978 | 11.2 | % | |||||||||||||||||||||
| Financial Income |
87,286 | 186,110 | 324,542 | 271.8 | % | 74.4 | % | 173,132 | 626,839 | 262.1 | % | |||||||||||||||||||||
| Financial Cost |
(86,026 | ) | (196,265 | ) | (291,758 | ) | 239.2 | % | 48.7 | % | (190,023 | ) | (623,765 | ) | 228.3 | % | ||||||||||||||||
| Other financial results |
15,478 | 58,771 | 68,466 | 342.3 | % | 16.5 | % | 28,827 | 151,244 | 424.7 | % | |||||||||||||||||||||
| Financial results, net |
16,738 | 48,616 | 101,250 | 504.9 | % | 108.3 | % | 11,936 | 154,318 | 1192.9 | % | |||||||||||||||||||||
|
|
|
|
|
|
|
|
|
|
|
|
|
|
|
|
|
|||||||||||||||||
| Net profit before income tax |
131,188 | 103,759 | (71,955 | ) | N/A | N/A | 294,885 | 108,158 | -63.3 | % | ||||||||||||||||||||||
|
|
|
|
|
|
|
|
|
|
|
|
|
|
|
|
|
|||||||||||||||||
| Income tax |
(39,006 | ) | (18,561 | ) | 7,557 | N/A | N/A | (82,223 | ) | (28,758 | ) | -65.0 | % | |||||||||||||||||||
|
|
|
|
|
|
|
|
|
|
|
|
|
|
|
|
|
|||||||||||||||||
| Net profit for the period |
92,182 | 85,198 | (64,398 | ) | N/A | N/A | 212,662 | 79,400 | -62.7 | % | ||||||||||||||||||||||
|
|
|
|
|
|
|
|
|
|
|
|
|
|
|
|
|
|||||||||||||||||
| Net profit for shareholders of the parent company |
91,896 | 73,727 | (65,579 | ) | N/A | N/A | 211,586 | 66,714 | -68.5 | % | ||||||||||||||||||||||
| Net profits for non-controlling interest |
286 | 11,471 | 1,181 | 312.9 | % | -89.7 | % | 1,076 | 12,686 | 1079.0 | % | |||||||||||||||||||||
| Earnings per share attributable to shareholders of the parent company (basic and diluted) |
233.72 | 188.32 | (167.55 | ) | N/A | N/A | 538.25 | 170.37 | -68.3 | % | ||||||||||||||||||||||
Note: Information reported in accordance with International Financial Reporting Standards (IFRS).
26
6.2. CONSOLIDATED BALANCE SHEET
| Consolidated Balance Sheet | In US$ million | In AR$ million | ||||||||||||||
| Unaudited Figures |
31-Dec-22 | 30-Sep-23 | 31-Dec-22 | 30-Sep-23 | ||||||||||||
| Non-current Assets |
||||||||||||||||
| Intangible assets |
384 | 371 | 68,052 | 129,777 | ||||||||||||
| Properties, plant and equipment |
17,510 | 18,672 | 3,100,306 | 6,525,018 | ||||||||||||
| Assets for leasing |
541 | 504 | 95,748 | 176,186 | ||||||||||||
| Investments in companies and joint ventures |
1,905 | 1,839 | 337,175 | 642,511 | ||||||||||||
| Deferred tax assets, net |
17 | 17 | 3,010 | 5,941 | ||||||||||||
| Other receivables |
205 | 203 | 36,468 | 70,905 | ||||||||||||
| Trade receivables |
6 | 3 | 1,027 | 1,136 | ||||||||||||
| Investment in financial assets |
201 | 11 | 35,664 | 3,755 | ||||||||||||
|
|
|
|
|
|
|
|
|
|||||||||
| Total Non-current Assets |
20,769 | 21,620 | 3,677,450 | 7,555,229 | ||||||||||||
|
|
|
|
|
|
|
|
|
|||||||||
| Current Assets |
||||||||||||||||
| Assets held for disposal |
0 | 0 | 0 | 0 | ||||||||||||
| Inventories |
1,738 | 1,764 | 307,766 | 616,537 | ||||||||||||
| Contract assets |
1 | 8 | 148 | 2,730 | ||||||||||||
| Other receivables |
808 | 484 | 143,231 | 169,217 | ||||||||||||
| Trade receivables |
1,504 | 1,493 | 266,201 | 521,616 | ||||||||||||
| Investment in financial assets |
319 | 182 | 56,489 | 63,461 | ||||||||||||
| Cash and cash equivalents |
773 | 1,296 | 136,874 | 452,755 | ||||||||||||
|
|
|
|
|
|
|
|
|
|||||||||
| Total Current Assets |
5,143 | 5,227 | 910,709 | 1,826,316 | ||||||||||||
|
|
|
|
|
|
|
|
|
|||||||||
| Total Assets |
25,912 | 26,847 | 4,588,159 | 9,381,545 | ||||||||||||
|
|
|
|
|
|
|
|
|
|||||||||
| Total Shareholders´ Equity |
10,552 | 11,119 | 1,868,304 | 3,885,498 | ||||||||||||
|
|
|
|
|
|
|
|
|
|||||||||
| Non-current Liabilities |
||||||||||||||||
| Provisions |
2,571 | 2,183 | 455,213 | 762,688 | ||||||||||||
| Deferred tax liabilities, net |
1,733 | 1,036 | 306,708 | 362,301 | ||||||||||||
| Income tax payable |
26 | 11 | 4,588 | 3,778 | ||||||||||||
| Other taxes payable |
1 | 0 | 185 | 162 | ||||||||||||
| Salaries and social security |
1 | 1 | 215 | 426 | ||||||||||||
| Liabilities from leasing |
272 | 246 | 48,224 | 85,632 | ||||||||||||
| Loans |
5,948 | 6,607 | 1,053,196 | 2,308,899 | ||||||||||||
| Other liabilities |
19 | 108 | 3,302 | 37,649 | ||||||||||||
| Accounts payable |
6 | 5 | 1,319 | 1,838 | ||||||||||||
|
|
|
|
|
|
|
|
|
|||||||||
| Total non-current Liabilities |
10,577 | 10,197 | 1,872,950 | 3,563,373 | ||||||||||||
|
|
|
|
|
|
|
|
|
|||||||||
| Current Liabilities |
||||||||||||||||
| Provisions |
199 | 192 | 34,981 | 67,104 | ||||||||||||
| Contract liabilities |
77 | 138 | 13,577 | 48,233 | ||||||||||||
| Income tax payable |
27 | 27 | 4,711 | 9,400 | ||||||||||||
| Other taxes payable |
173 | 159 | 30,660 | 55,561 | ||||||||||||
| Salaries and social security |
297 | 252 | 52,622 | 87,898 | ||||||||||||
| Liabilities from leasing |
294 | 290 | 52,061 | 101,512 | ||||||||||||
| Loans |
1,140 | 1,546 | 201,808 | 540,126 | ||||||||||||
| Other liabilities |
12 | 116 | 2,359 | 40,405 | ||||||||||||
| Accounts payable |
2,564 | 2,811 | 454,126 | 982,435 | ||||||||||||
|
|
|
|
|
|
|
|
|
|||||||||
| Total Current Liabilities |
4,783 | 5,531 | 846,905 | 1,932,674 | ||||||||||||
|
|
|
|
|
|
|
|
|
|||||||||
| Total Liabilities |
15,360 | 15,728 | 2,719,855 | 5,496,047 | ||||||||||||
|
|
|
|
|
|
|
|
|
|||||||||
| Total Liabilities and Shareholders’ Equity |
25,912 | 26,847 | 4,588,159 | 9,381,545 | ||||||||||||
|
|
|
|
|
|
|
|
|
|||||||||
Note: Information reported in accordance with International Financial Reporting Standards (IFRS).
27
6.3. CONSOLIDATED CASH FLOW STATEMENT
| Cash Flow Statement Unaudited Figures, in US$ million |
3Q22 | 2Q23 | 3Q23 | Y/Y Δ | Q/Q Δ | 9M22 | 9M23 | Y/Y Δ | ||||||||||||||||||||||||
| Operating activities |
||||||||||||||||||||||||||||||||
| Net income |
693 | 380 | (137 | ) | N/A | N/A | 1,770 | 584 | -67.0 | % | ||||||||||||||||||||||
| Income from equity interests in associates and joint ventures |
(141 | ) | (94 | ) | (44 | ) | -68.8 | % | -53.2 | % | (388 | ) | (227 | ) | -41.5 | % | ||||||||||||||||
| Depreciation of property, plant and equipment |
657 | 791 | 798 | 21.5 | % | 0.9 | % | 1,875 | 2,298 | 22.6 | % | |||||||||||||||||||||
| Depreciation of the right-of-use assets |
56 | 54 | 55 | -1.8 | % | 1.9 | % | 156 | 165 | 5.8 | % | |||||||||||||||||||||
| Amortization of intangible assets |
11 | 9 | 11 | 0.0 | % | 22.2 | % | 33 | 30 | -9.1 | % | |||||||||||||||||||||
| Losses of property, plant and equipment and intangible assets and |
112 | 79 | 108 | -3.6 | % | 36.7 | % | 300 | 271 | -9.7 | % | |||||||||||||||||||||
| Income tax charge |
284 | 75 | — | N/A | N/A | 666 | 160 | -76.0 | % | |||||||||||||||||||||||
| Net increase in provisions |
74 | 98 | 111 | 50.0 | % | 13.3 | % | 251 | 308 | 22.7 | % | |||||||||||||||||||||
| Impairment of property, plant and equipment and intangible assets |
98 | — | 506 | 416.3 | % | N/A | 98 | 506 | 416.3 | % | ||||||||||||||||||||||
| Stock compensation plans |
— | 8 | 3 | N/A | -62.5 | % | 1 | 15 | 1400.0 | % | ||||||||||||||||||||||
| Changes in Assets and Liabilities & Others |
(262 | ) | (91 | ) | (12 | ) | -95.4 | % | -86.8 | % | (400 | ) | 95 | N/A | ||||||||||||||||||
|
|
|
|
|
|
|
|
|
|
|
|
|
|
|
|
|
|||||||||||||||||
| Net cash flow from operating activities |
1,582 | 1,309 | 1,399 | -11.6 | % | 6.9 | % | 4,362 | 4,205 | -3.6 | % | |||||||||||||||||||||
|
|
|
|
|
|
|
|
|
|
|
|
|
|
|
|
|
|||||||||||||||||
| Investing activities |
||||||||||||||||||||||||||||||||
| Acquisitions of property, plant and equipment and intangible assets |
(1,067 | ) | (1,366 | ) | (1,500 | ) | 40.6 | % | 9.8 | % | (2,692 | ) | (4,128 | ) | 53.3 | % | ||||||||||||||||
| Contributions and acquisitions of interests in companies and joint ventures |
— | (2 | ) | — | N/A | N/A | — | (4 | ) | N/A | ||||||||||||||||||||||
| Loans with related parties, net |
— | — | — | N/A | N/A | — | — | N/A | ||||||||||||||||||||||||
| Proceeds from sales of financial assets |
172 | 199 | 224 | 30.2 | % | 12.6 | % | 402 | 551 | 37.1 | % | |||||||||||||||||||||
| Payments for the acquisition of financial assets |
(139 | ) | (121 | ) | (73 | ) | -47.5 | % | -39.7 | % | (644 | ) | (276 | ) | -57.1 | % | ||||||||||||||||
| Interest received from financial assets |
28 | 21 | 26 | -7.1 | % | 23.8 | % | 46 | 74 | 60.9 | % | |||||||||||||||||||||
| Collection for participation in areas and sale of assets |
— | 10 | 2 | N/A | -80.0 | % | 2 | 14 | 600.0 | % | ||||||||||||||||||||||
|
|
|
|
|
|
|
|
|
|
|
|
|
|
|
|
|
|||||||||||||||||
| Net cash flow from investing activities |
(1,006 | ) | (1,259 | ) | (1,321 | ) | 31.3 | % | 4.9 | % | (2,886 | ) | (3,769 | ) | 30.6 | % | ||||||||||||||||
|
|
|
|
|
|
|
|
|
|
|
|
|
|
|
|
|
|||||||||||||||||
| Financing activities |
||||||||||||||||||||||||||||||||
| Payment of loans |
(58 | ) | (371 | ) | (571 | ) | 884.5 | % | 53.9 | % | (728 | ) | (1,075 | ) | 47.7 | % | ||||||||||||||||
| Payment of interests |
(175 | ) | (144 | ) | (192 | ) | 9.7 | % | 33.3 | % | (468 | ) | (493 | ) | 5.3 | % | ||||||||||||||||
| Proceeds from loans |
39 | 820 | 976 | 2402.6 | % | 19.0 | % | 386 | 2,268 | 487.6 | % | |||||||||||||||||||||
| Account overdraft, net |
(44 | ) | — | 33 | N/A | N/A | (1 | ) | (37 | ) | 3600.0 | % | ||||||||||||||||||||
| Acquisition of own shares |
(5 | ) | — | — | N/A | N/A | (5 | ) | — | N/A | ||||||||||||||||||||||
| Payment of leasing |
(90 | ) | (89 | ) | (86 | ) | -4.4 | % | -3.4 | % | (251 | ) | (267 | ) | 6.4 | % | ||||||||||||||||
| Payment of interests related to income tax |
(2 | ) | (2 | ) | (2 | ) | 0.0 | % | 0.0 | % | (5 | ) | (7 | ) | 40.0 | % | ||||||||||||||||
|
|
|
|
|
|
|
|
|
|
|
|
|
|
|
|
|
|||||||||||||||||
| Net cash flow from financing activities |
(335 | ) | 214 | 158 | N/A | -26.2 | % | (1,072 | ) | 389 | N/A | |||||||||||||||||||||
|
|
|
|
|
|
|
|
|
|
|
|
|
|
|
|
|
|||||||||||||||||
| Effect of changes in exchange rates on cash and cash equivalents |
(74 | ) | (111 | ) | (107 | ) | 44.6 | % | -3.6 | % | (181 | ) | (302 | ) | 66.9 | % | ||||||||||||||||
| Translation adjustments |
— | — | — | N/A | N/A | — | — | N/A | ||||||||||||||||||||||||
| Increase (decrease) in cash and cash equivalents |
167 | 153 | 129 | -22.8 | % | -15.7 | % | 223 | 523 | 134.5 | % | |||||||||||||||||||||
| Cash and cash equivalents at the beginning of the period |
667 | 1,014 | 1,167 | 75.0 | % | 15.1 | % | 611 | 773 | 26.5 | % | |||||||||||||||||||||
|
|
|
|
|
|
|
|
|
|
|
|
|
|
|
|
|
|||||||||||||||||
| Cash and cash equivalents at the end of the period |
834 | 1,167 | 1,296 | 55.4 | % | 11.1 | % | 834 | 1,296 | 55.4 | % | |||||||||||||||||||||
|
|
|
|
|
|
|
|
|
|
|
|
|
|
|
|
|
|||||||||||||||||
Note: Information reported in accordance with International Financial Reporting Standards (IFRS).
28
| Cash Flow Statement Unaudited Figures, in AR$ million |
3Q22 | 2Q23 | 3Q23 | Y/Y Δ | Q/Q Δ | 9M22 | 9M23 | Y/Y Δ | ||||||||||||||||||||||||
| Operating activities |
||||||||||||||||||||||||||||||||
| Net income |
92,182 | 85,198 | (64,398 | ) | N/A | N/A | 212,662 | 79,400 | -62.7 | % | ||||||||||||||||||||||
| Income of interests in companies and joint ventures |
(19,038 | ) | (21,850 | ) | (13,182 | ) | -30.8 | % | -39.7 | % | (46,732 | ) | (51,978 | ) | 11.2 | % | ||||||||||||||||
| Depreciation of property, plant and equipment |
89,569 | 184,335 | 252,446 | 181.8 | % | 36.9 | % | 226,938 | 573,731 | 152.8 | % | |||||||||||||||||||||
| Depreciation of the right-of-use assets |
7,625 | 12,948 | 17,036 | 123.4 | % | 31.6 | % | 18,910 | 40,687 | 115.2 | % | |||||||||||||||||||||
| Amortization of intangible assets |
1,621 | 2,564 | 3,954 | 143.9 | % | 54.2 | % | 4,295 | 8,439 | 96.5 | % | |||||||||||||||||||||
| Losses of property, plant and equipment and intangible assets and |
15,074 | 17,082 | 33,529 | 122.4 | % | 96.3 | % | 35,915 | 66,701 | 85.7 | % | |||||||||||||||||||||
| Income tax charge |
39,006 | 18,561 | (7,557 | ) | N/A | N/A | 82,223 | 28,758 | -65.0 | % | ||||||||||||||||||||||
| Net increase in provisions |
11,165 | 21,105 | 35,618 | 219.0 | % | 68.8 | % | 31,248 | 76,787 | 145.7 | % | |||||||||||||||||||||
| Impairment of property, plant and equipment and intangible assets |
14,108 | — | 176,769 | 1153.0 | % | N/A | 14,108 | 176,769 | 1153.0 | % | ||||||||||||||||||||||
| Stock compensation plans |
464 | 1,805 | 1,266 | 172.8 | % | -29.9 | % | 574 | 3,803 | 562.5 | % | |||||||||||||||||||||
| Changes in Assets and Liabilities & Others |
(36,755 | ) | (10,065 | ) | 15,886 | N/A | N/A | (55,241 | ) | 55,599 | N/A | |||||||||||||||||||||
|
|
|
|
|
|
|
|
|
|
|
|
|
|
|
|
|
|||||||||||||||||
| Net cash flow from operating activities |
215,021 | 311,683 | 451,367 | 109.9 | % | 44.8 | % | 524,900 | 1,058,696 | 101.7 | % | |||||||||||||||||||||
|
|
|
|
|
|
|
|
|
|
|
|
|
|
|
|
|
|||||||||||||||||
| Investing activities |
||||||||||||||||||||||||||||||||
| Acquisitions of property, plant and equipment and intangible assets |
(142,371 | ) | (311,977 | ) | (458,116 | ) | 221.8 | % | 46.8 | % | (322,612 | ) | (1,017,251 | ) | 215.3 | % | ||||||||||||||||
| Contributions and acquisitions of interests in companies and joint ventures |
(40 | ) | (444 | ) | (334 | ) | 735.0 | % | -24.8 | % | (40 | ) | (1,174 | ) | 2835.0 | % | ||||||||||||||||
| Loans with related parties, net |
— | — | — | N/A | N/A | — | — | N/A | ||||||||||||||||||||||||
| Proceeds from sales of financial assets |
22,808 | 47,699 | 64,861 | 184.4 | % | 36.0 | % | 49,261 | 137,419 | 179.0 | % | |||||||||||||||||||||
| Payments for the acquisition of financial assets |
(18,955 | ) | (28,426 | ) | (22,324 | ) | 17.8 | % | -21.5 | % | (77,340 | ) | (66,621 | ) | -13.9 | % | ||||||||||||||||
| Interest received from financial assets |
3,919 | 4,998 | 8,440 | 115.4 | % | 68.9 | % | 6,042 | 18,548 | 207.0 | % | |||||||||||||||||||||
| Collection for participation in areas and sale of assets |
334 | 2,416 | 609 | 82.3 | % | -74.8 | % | 723 | 3,392 | 369.2 | % | |||||||||||||||||||||
|
|
|
|
|
|
|
|
|
|
|
|
|
|
|
|
|
|||||||||||||||||
| Net cash flow from investing activities |
(134,305 | ) | (285,734 | ) | (406,864 | ) | 202.9 | % | 42.4 | % | (343,966 | ) | (925,687 | ) | 169.1 | % | ||||||||||||||||
|
|
|
|
|
|
|
|
|
|
|
|
|
|
|
|
|
|||||||||||||||||
| Financing activities |
||||||||||||||||||||||||||||||||
| Payment of loans |
(8,987 | ) | (80,990 | ) | (173,846 | ) | 1834.4 | % | 114.7 | % | (85,115 | ) | (280,920 | ) | 230.0 | % | ||||||||||||||||
| Payment of interests |
(24,772 | ) | (34,419 | ) | (59,735 | ) | 141.1 | % | 73.6 | % | (58,140 | ) | (124,069 | ) | 113.4 | % | ||||||||||||||||
| Proceeds from loans |
6,320 | 186,513 | 311,147 | 4823.2 | % | 66.8 | % | 45,068 | 585,687 | 1199.6 | % | |||||||||||||||||||||
| Account overdraft, net |
(6,332 | ) | — | 9,589 | N/A | N/A | (794 | ) | (2,898 | ) | 265.0 | % | ||||||||||||||||||||
| Acquisition of own shares |
(847 | ) | — | — | N/A | N/A | (847 | ) | — | N/A | ||||||||||||||||||||||
| Payment of leasing |
(12,585 | ) | (20,987 | ) | (26,760 | ) | 112.6 | % | 27.5 | % | (31,130 | ) | (65,441 | ) | 110.2 | % | ||||||||||||||||
| Payment of interests related to income tax |
(329 | ) | (570 | ) | (537 | ) | 63.2 | % | -5.8 | % | (665 | ) | (1,658 | ) | 149.3 | % | ||||||||||||||||
|
|
|
|
|
|
|
|
|
|
|
|
|
|
|
|
|
|||||||||||||||||
| Net cash flow from financing activities |
(47,532 | ) | 49,547 | 59,858 | N/A | 20.8 | % | (131,623 | ) | 110,701 | N/A | |||||||||||||||||||||
|
|
|
|
|
|
|
|
|
|
|
|
|
|
|
|
|
|||||||||||||||||
| Effect of changes in exchange rates on cash and cash equivalents |
6,108 | 11,787 | 49,206 | 705.6 | % | 317.5 | % | 10,804 | 72,171 | 568.0 | % | |||||||||||||||||||||
| Increase (decrease) in cash and cash equivalents |
39,292 | 87,283 | 153,567 | 290.8 | % | 75.9 | % | 60,115 | 315,881 | 425.5 | % | |||||||||||||||||||||
| Cash and cash equivalents at the beginning of the period |
83,501 | 211,905 | 299,188 | 258.3 | % | 41.2 | % | 62,678 | 136,874 | 118.4 | % | |||||||||||||||||||||
|
|
|
|
|
|
|
|
|
|
|
|
|
|
|
|
|
|||||||||||||||||
| Cash and cash equivalents at the end of the period |
122,793 | 299,188 | 452,755 | 268.7 | % | 51.3 | % | 122,793 | 452,755 | 268.7 | % | |||||||||||||||||||||
|
|
|
|
|
|
|
|
|
|
|
|
|
|
|
|
|
|||||||||||||||||
Note: Information reported in accordance with International Financial Reporting Standards (IFRS).
29
| Main physical magnitudes Unaudited Figures |
Unit | 1Q22 | 2Q22 | 3Q22 | 4Q22 | Cum. 2022 | 1Q23 | 2Q23 | 3Q23 | Cum. 2023 | ||||||||||||||||||||||||||||
| Total Production |
Kboe | 45,523 | 45,836 | 46,406 | 45,924 | 183,690 | 45,956 | 46,695 | 47,808 | 140,460 | ||||||||||||||||||||||||||||
|
|
|
|
|
|
|
|
|
|
|
|
|
|
|
|
|
|
|
|
||||||||||||||||||||
| Crude oil production |
Kbbl | 19,993 | 20,506 | 20,680 | 21,325 | 82,503 | 21,461 | 21,925 | 21,795 | 65,181 | ||||||||||||||||||||||||||||
| NGL production |
Kbbl | 3,979 | 3,796 | 3,496 | 3,915 | 15,186 | 3,859 | 3,889 | 4,288 | 12,037 | ||||||||||||||||||||||||||||
| Gas production |
Mm3 | 3,427 | 3,424 | 3,535 | 3,289 | 13,674 | 3,281 | 3,320 | 3,454 | 10,055 | ||||||||||||||||||||||||||||
| Henry Hub |
USD/MMBTU | 4.6 | 7.5 | 7.9 | 5.0 | 6.3 | 2.8 | 2.3 | 2.7 | 2.6 | ||||||||||||||||||||||||||||
| Brent |
USD/bbl | 97.4 | 111.9 | 97.8 | 88.6 | 98.9 | 82.2 | 78.0 | 85.9 | 82.1 | ||||||||||||||||||||||||||||
| Sales volume (YPF stand alone) |
||||||||||||||||||||||||||||||||||||||
|
|
|
|
|
|
|
|
|
|
|
|
|
|
|
|
|
|
|
|
||||||||||||||||||||
| Sales of refined products |
Km3 | 4,565 | 4,782 | 4,896 | 4,912 | 19,155 | 4,790 | 4,873 | 4,936 | 14,599 | ||||||||||||||||||||||||||||
|
|
|
|
|
|
|
|
|
|
|
|
|
|
|
|
|
|
|
|
||||||||||||||||||||
| Domestic market |
Km3 | 4,209 | 4,455 | 4,536 | 4,431 | 17,631 | 4,346 | 4,483 | 4,581 | 13,411 | ||||||||||||||||||||||||||||
| Gasoline |
Km3 | 1,410 | 1,364 | 1,419 | 1,487 | 5,680 | 1,515 | 1,431 | 1,500 | 4,445 | ||||||||||||||||||||||||||||
| Diesel |
Km3 | 2,030 | 2,284 | 2,288 | 2,181 | 8,783 | 2,052 | 2,227 | 2,272 | 6,551 | ||||||||||||||||||||||||||||
| Jet fuel and kerosene |
Km3 | 124 | 115 | 129 | 151 | 519 | 140 | 131 | 145 | 415 | ||||||||||||||||||||||||||||
| Fuel Oil |
Km3 | 4 | 13 | 21 | 4 | 42 | 4 | 13 | 3 | 20 | ||||||||||||||||||||||||||||
| LPG |
Km3 | 243 | 305 | 298 | 245 | 1,092 | 230 | 288 | 308 | 825 | ||||||||||||||||||||||||||||
| Other (*) |
Km3 | 398 | 374 | 379 | 363 | 1,515 | 407 | 393 | 354 | 1,153 | ||||||||||||||||||||||||||||
| Export market |
Km3 | 356 | 327 | 360 | 482 | 1,524 | 444 | 390 | 355 | 1,189 | ||||||||||||||||||||||||||||
| Petrochemical naphtha |
Km3 | 15 | 52 | 60 | 23 | 151 | 20 | 63 | 0 | 83 | ||||||||||||||||||||||||||||
| Jet fuel and kerosene |
Km3 | 74 | 81 | 89 | 110 | 353 | 117 | 94 | 105 | 316 | ||||||||||||||||||||||||||||
| LPG |
Km3 | 124 | 28 | 73 | 164 | 389 | 133 | 121 | 90 | 344 | ||||||||||||||||||||||||||||
| Bunker (Diesel and Fuel Oil) |
Km3 | 94 | 67 | 51 | 91 | 302 | 95 | 34 | 55 | 184 | ||||||||||||||||||||||||||||
| Other (*) |
Km3 | 49 | 100 | 87 | 93 | 329 | 78 | 78 | 105 | 261 | ||||||||||||||||||||||||||||
|
|
|
|
|
|
|
|
|
|
|
|
|
|
|
|
|
|
|
|
||||||||||||||||||||
| Sales of petrochemical products |
Ktn | 129 | 139 | 115 | 116 | 498 | 141 | 122 | 151 | 413 | ||||||||||||||||||||||||||||
|
|
|
|
|
|
|
|
|
|
|
|
|
|
|
|
|
|
|
|
||||||||||||||||||||
| Domestic market |
Ktn | 99 | 111 | 90 | 95 | 396 | 83 | 70 | 86 | 240 | ||||||||||||||||||||||||||||
| Methanol |
Ktn | 68 | 76 | 54 | 55 | 252 | 45 | 36 | 45 | 125 | ||||||||||||||||||||||||||||
| Other |
Ktn | 32 | 35 | 37 | 40 | 143 | 38 | 34 | 42 | 114 | ||||||||||||||||||||||||||||
| Export market |
Ktn | 30 | 27 | 25 | 21 | 103 | 58 | 51 | 65 | 174 | ||||||||||||||||||||||||||||
| Methanol |
Ktn | 6 | 7 | 4 | 2 | 20 | 40 | 30 | 46 | 116 | ||||||||||||||||||||||||||||
| Other |
Ktn | 23 | 21 | 20 | 19 | 83 | 18 | 21 | 19 | 58 | ||||||||||||||||||||||||||||
|
|
|
|
|
|
|
|
|
|
|
|
|
|
|
|
|
|
|
|
||||||||||||||||||||
| Sales of Grain and flours |
Ktn | 271 | 517 | 449 | 270 | 1,507 | 100 | 275 | 181 | 556 | ||||||||||||||||||||||||||||
|
|
|
|
|
|
|
|
|
|
|
|
|
|
|
|
|
|
|
|
||||||||||||||||||||
| Domestic market |
Ktn | 7 | 39 | 50 | 178 | 275 | 91 | 172 | 115 | 378 | ||||||||||||||||||||||||||||
| Export market |
Ktn | 264 | 478 | 398 | 92 | 1,232 | 9 | 103 | 66 | 178 | ||||||||||||||||||||||||||||
|
|
|
|
|
|
|
|
|
|
|
|
|
|
|
|
|
|
|
|
||||||||||||||||||||
| Sales of Fertilizers |
Ktn | 104 | 166 | 242 | 228 | 741 | 115 | 173 | 250 | 538 | ||||||||||||||||||||||||||||
|
|
|
|
|
|
|
|
|
|
|
|
|
|
|
|
|
|
|
|
||||||||||||||||||||
| Domestic market |
Ktn | 104 | 166 | 242 | 228 | 741 | 115 | 173 | 250 | 538 | ||||||||||||||||||||||||||||
| Main products imported (YPF stand alone) |
||||||||||||||||||||||||||||||||||||||
| Gasoline |
Km3 | 122 | 40 | 49 | 92 | 303 | 142 | 47 | 0 | 189 | ||||||||||||||||||||||||||||
| Jet Fuel |
Km3 | 2 | 0 | 1 | 3 | 7 | 4 | 0 | 4 | 8 | ||||||||||||||||||||||||||||
| Diesel |
Km3 | 318 | 255 | 448 | 229 | 1,251 | 288 | 188 | 253 | 730 | ||||||||||||||||||||||||||||
Other (*): Principally includes sales of oil and lubricant bases, asphalt, and residual carbon, among others.
30
Additional information about YPF S.A., a sociedad anónima organized under the laws of Argentina (the “Company” or “YPF”) can be found in the “Investors” section on the website at www.ypf.com.
This document does not constitute an offer to sell or the solicitation of any offer to buy any securities of the Company, in any jurisdiction. Securities may not be offered or sold in the United States absent registration with the U.S. Securities Exchange Commission (“SEC”), the Comisión Nacional de Valores (Argentine National Securities and Exchange Commission, or “CNV”) or an exemption from such registrations.
No reliance may be placed for any purpose whatsoever on the information contained in this document or on its completeness. Certain information contained in this document may have been obtained from published sources, which may not have been independently verified or audited. No representation or warranty, express or implied, is given or will be given by or on behalf of the Company, or any of its affiliates (within the meaning of Rule 405 under the Act, “Affiliates”), members, directors, officers or employees or any other person (the “Related Parties”) as to the accuracy, completeness or fairness of the information or opinions contained in this document or any other material discussed verbally, and any reliance you place on them will be at your sole risk. Any opinions presented herein are based on general information gathered at the time of writing and are subject to change without notice. In addition, no responsibility, obligation or liability (whether direct or indirect, in contract, tort or otherwise) is or will be accepted by the Company or any of its Related Parties in relation to such information or opinions or any other matter in connection with this document or its contents or otherwise arising in connection therewith.
This document may also include certain non-IFRS (International Financial Reporting Standards) financial measures which have not been subject to a financial audit for any period. The information and opinions contained in this document are provided as at the date of this document and are subject to verification, completion and change without notice.
This document includes “forward-looking statements” concerning the future. The words such as “believes,” “thinks,” “forecasts,” “expects,” “anticipates,” “intends,” “should,” “seeks,” “estimates,” “future” or similar expressions are included with the intention of identifying statements about the future. For the avoidance of doubt, any projection, guidance or similar estimation about the future or future results, performance or achievements is a forward-looking statement. Although the assumptions and estimates on which forward-looking statements are based are believed by our management to be reasonable and based on the best currently available information, such forward-looking statements are based on assumptions that are inherently subject to significant uncertainties and contingencies, many of which are beyond our control.
Forward-looking statements speak only as of the date on which they were made, and we undertake no obligation to release publicly any updates or revisions to any forward-looking statements contained herein because of new information, future events or other factors. In light of these limitations, undue reliance should not be placed on forward-looking statements contained in this document. Further information concerning risks and uncertainties associated with these forward-looking statements and YPF’s business can be found in YPF’s public disclosures filed on EDGAR (www.sec.gov) or at the web page of the Argentine National Securities and Exchange Commission (www.argentina.gob.ar/cnv).
You should not take any statement regarding past trends or activities as a representation that the trends or activities will continue in the future. Accordingly, you should not put undue reliance on these statements. This document is not intended to constitute and should not be construed as investment advice.
The information contained herein has been prepared to assist interested parties in making their own evaluations of YPF.
31

SIGNATURE
Pursuant to the requirements of the Securities Exchange Act of 1934, the registrant has duly caused this report to be signed on its behalf by the undersigned, thereunto duly authorized.
| YPF Sociedad Anónima | ||||||
| Date: November 8, 2023 | By: | /s/ Margarita Chun | ||||
| Name: | Margarita Chun | |||||
| Title: | Market Relations Officer | |||||
1 Year YPF Sociedad Anonima Chart |
1 Month YPF Sociedad Anonima Chart |

It looks like you are not logged in. Click the button below to log in and keep track of your recent history.
Support: +44 (0) 203 8794 460 | support@advfn.com
By accessing the services available at ADVFN you are agreeing to be bound by ADVFN's Terms & Conditions
 Hot Features
