ADVFN Logo ADVFN

We could not find any results for:
Make sure your spelling is correct or try broadening your search.

Trending Now

Toplists

It looks like you aren't logged in.
Click the button below to log in and view your recent history.

Hot Features

Registration Strip Icon for alerts Register for real-time alerts, custom portfolio, and market movers

TIER Tier Reit, Inc.

28.88
0.00 (0.00%)
Last Updated: 01:00:00
Delayed by 15 minutes
Share Name Share Symbol Market Type
Tier Reit, Inc. NYSE:TIER NYSE Common Stock
  Price Change % Change Share Price High Price Low Price Open Price Shares Traded Last Trade
  0.00 0.00% 28.88 0 01:00:00

Tier Reports Fiscal 2008 Fourth Quarter and Year End Results

09/12/2008 9:13pm

Business Wire


Tier Reit Inc. (NYSE:TIER)
Historical Stock Chart


From Jul 2019 to Jul 2024
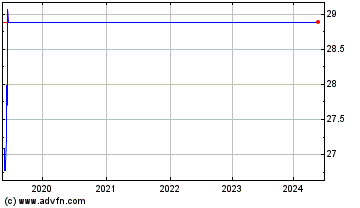
Click Here for more Tier Reit Inc. Charts.
Tier Technologies, Inc. (Nasdaq:TIER) today announced results for the quarter and year ended September 30, 2008 and provided updates on continuing strategic growth initiatives. "We are pleased to announce the completion of 6 of 7 previously announced divestitures. Five of these divestitures were completed during fiscal year 2008, and the sixth was completed as of November 2008," said Ronald L. Rossetti, Tier's Chairman and Chief Executive Officer. Mr. Rossetti went on to say “we have new management in place, and the Company is totally focused on the biller-direct category represented by our EPP operations.” Next Mr. Rossetti stated, “despite the rapidly contracting economy, we were able to generate revenue growth from our continuing operations in both the fourth quarter and full 2008 fiscal year. Even with the lower-than-anticipated results in Property tax payments due to sub-prime mortgage issues, our EPP business ended the year with a 17.7% increase in revenues and continued transaction growth of 22.6%.” Conference Call Tier will host a conference call tonight at 5:00 p.m. Eastern Time to discuss these results. To access the conference call, please dial 888-335-3240 and provide conference ID # 76156469. The conference call will also be broadcast live via the Internet at www.tier.com. A replay will be available at www.tier.com approximately 24 hours after the end of the call or by calling 800-642-1687 and entering conference ID # 76156469 from Thursday, December 11 at noon Eastern Time until 11:59 p.m. Eastern Time on December 23, 2008. Fourth Quarter Fiscal 2008 Results For the quarter ended September 30, 2008, Tier reported revenues from continuing operations of $22.8 million, a 10.4% increase over the same quarter last year. Net loss was $4.9 million, or $0.25 per fully-diluted share. Continuing operations include Electronic Payment Processing or EPP, certain wind-down businesses and corporate costs. On a standalone basis, our core EPP business reported quarterly revenues of $21.1 million, or a 15.4% increase over the same quarter last year. We continue to experience strong growth, both in the number of transactions processed and the dollar volume of payments processed on behalf of our customers. Corporate overhead costs, which support both continuing and discontinued operations, were $3.8 million for the quarter, up $0.5 million from the same quarter last year. Corporate overhead should decline as these businesses are sold. Tier’s discontinued operations reported revenues of $4.8 million for the quarter, down 235.3% from the same quarter last year. The decrease is primarily due to the ending of contracts. Net loss from discontinued operations was $4.0 million for the quarter. Year End 2008 Results For the fiscal year ended September 30, 2008, Tier reported revenues from continuing operations of $122.6 million, a 13.2% increase over year end 2007. Net loss was $12.0 million, or $0.61 per fully-diluted share. On a standalone basis, our core EPP business reported annual revenues of $117.1 million or a 17.7% increase over the same period last year. We continue to experience strong growth, both in the number of transactions processed and the dollar volume of payments processed on behalf of our customers. Corporate overhead costs, which support both continuing and discontinued operations, were $16.4 million for the year, down $0.2 million from last year. Tier’s discontinued operations reported revenues of $44.8 million for the year, down 54.0% from last year. The decrease is primarily due to the ending of contracts and the final sale of other business units. Net loss for the year from discontinued operations was $15.4 million, or $0.79 per fully diluted share. Liquidity As of September 30, 2008, Tier had $78.9 million in cash and cash equivalents and investments in marketable securities, and $8.1 million in restricted investments. Tier currently holds $31.3 million in auction rate securities as long-term investments. These investments are revenue bonds and asset-backed notes issued by state agencies. The investments are AAA-rated and collateralized with student loans and guaranteed under the Federal Family Education Loan Program. Tier has no short-term or long-term debt. About Tier Technologies, Inc. Tier Technologies, Inc. provides federal, state and local government and other public sector clients with electronic payment processing and other transaction processing services. Headquartered in Reston, Virginia, Tier Technologies serves over 3,300 electronic payment processing clients throughout the United States, including federal, state, and local governments, educational institutions, utilities and commercial clients. Through its subsidiary, Official Payments Corp., Tier delivers payment processing solutions for a wide range of markets. For more information, see www.tier.com and www.officialpayments.com. Statements made in this press release that are not historical facts are forward-looking statements that are made pursuant to the safe harbor provisions of the Private Securities Litigation Reform Act of 1995. Tier undertakes no obligation to update any such forward-looking statements. Each of these statements is made as of the date hereof based only on current information and expectations that are inherently subject to change and involve a number of risks and uncertainties. Actual events or results may differ materially from those projected in any of such statements due to various factors, including, but not limited to: the impact of governmental investigations; the potential loss of funding by clients, including due to government budget shortfalls or revisions to mandated statutes; the timing, initiation, completion, renewal, extension or early termination of client projects; the Company’s ability to realize revenues from its business development opportunities; the timing and completion of the divestment of the Company’s non-core assets; and unanticipated claims as a result of project performance, including due to the failure of software providers or subcontractors to satisfactorily complete engagements. For a discussion of these and other factors which may cause our actual events or results to differ from those projected, please refer to the Company's annual report on Form 10-K for the fiscal year ended September 30, 2007 filed with the SEC. IMPORTANT INFORMATION Tier Technologies, Inc. plans to file with the SEC and furnish to its shareholders a Proxy Statement in connection with its 2009 Annual Meeting, and advises its security holders to read the Proxy Statement relating to the 2009 Annual Meeting when it becomes available, because it will contain important information. Security holders may obtain a free copy of the Proxy Statement and other documents (when available) that Tier files with the SEC at the SEC’s website at www.sec.gov. The Proxy Statement and these other documents may also be obtained for free from Tier by directing a request to Tier Technologies, Inc., Attn: Corporate Secretary, Keith Omsberg, 10780 Parkridge Blvd., 4th Floor, Reston, VA 20191. CERTAIN INFORMATION CONCERNING PARTICIPANTS Tier, its directors and named executive officers may be deemed to be participants in the solicitation of Tier’s security holders in connection with its 2009 Annual Meeting. Security holders may obtain information regarding the names, affiliations and interests of such individuals in Tier’s Annual Report on Form 10-K for the year ended September 30, 2007 and its proxy statement dated January 15, 2008, each of which is on file with the SEC, as well as its upcoming Annual Report on Form 10-K for the year ended September 30, 2008 and its upcoming proxy statement for the 2009 Annual Meeting (when available). To the extent there have been changes in Tier’s directors and executive officers, such changes have been reported on Current Reports on Form 8-K filed with the SEC. To the extent holdings of Tier securities have changed since the amounts printed in the proxy statement dated January 15, 2008, such changes have been or will be reflected on Statements of Change in Beneficial Ownership on Form 4 or Form 5 filed with the SEC.   TIER TECHNOLOGIES, INC. Consolidated Balance Sheets   (in thousands)   September 30,2008   September 30,2007 ASSETS:     Current assets: Cash and cash equivalents $ 47,735 $ 16,516 Investments in marketable securities 2,415 57,815 Accounts receivable, net 4,209 4,909 Unbilled receivables 532 545 Prepaid expenses and other current assets 1,331 2,169 Assets of discontinued operations — 672 Current assets—held-for-sale     11,704       36,196   Total current assets 67,926 118,822   Property, equipment and software, net 4,479 3,743 Goodwill 14,526 14,526 Other intangible assets, net 13,455 17,640 Investments in marketable securities 28,821 — Restricted investments 7,861 11,526 Other assets     283       167   Total assets   $ 137,351     $ 166,424     LIABILITIES AND SHAREHOLDERS’ EQUITY: Current liabilities: Accounts payable $ 918 $ 877 Accrued compensation liabilities 4,289 4,653 Accrued subcontractor expenses 348 504 Accrued discount fees 5,243 4,529 Other accrued liabilities 4,319 4,213 Deferred income 1,790 2,649 Liabilities of discontinued operations — 421 Current liabilities—held-for-sale     9,061       10,864   Total current liabilities 25,968 28,710   Other liabilities     136       200   Total liabilities     26,104       28,910     Commitments and contingencies   Shareholders’ equity: Preferred stock, no par value; authorized shares: 4,579; no shares issued and outstanding — — Common stock and paid-in capital; shares authorized: 44,260; shares issued: 20,619 and 20,425; shares outstanding: 19,735 and 19,541 190,099 186,417 Treasury stock—at cost, 884 shares (8,684 ) (8,684 ) Accumulated other comprehensive loss (2,504 ) — Accumulated deficit     (67,664 )     (40,219 ) Total shareholders’ equity     111,247       137,514   Total liabilities and shareholders’ equity   $ 137,351     $ 166,424       TIER TECHNOLOGIES, INC. Consolidated Statements of Operations     Year ended September 30, (in thousands, except per share data)   2008   2007   2006     Revenues   $ 122,571     $ 108,306     $ 90,916     Costs and expenses: Direct costs 95,234 82,668 68,447 General and administrative 28,020 26,372 32,310 Selling and marketing 8,677 7,950 8,076 Depreciation and amortization 5,328 4,573 5,123 Write-down of goodwill and intangible assets     —       9,161       —   Total costs and expenses     137,259       130,724       113,956     Loss from continuing operations before other income and income taxes     (14,688 )     (22,418 )     (23,040 )   Other income: Income from investments: Equity in net income of unconsolidated affiliate — 475 445 Realized foreign currency gain — 239 — Gain on sale of unconsolidated affiliate — 80 —   Interest income, net 2,731 3,300 2,951 Other income     —       —       74   Total other income     2,731       4,094       3,470     Loss from continuing operations before income taxes (11,957 ) (18,324 ) (19,570 ) Income tax provision     87       76       45     Loss from continuing operations (12,044 ) (18,400 ) (19,615 ) (Loss) income from discontinued operations, net     (15,401 )     15,366       10,164     Net loss   $ (27,445 )   $ (3,034 )   $ (9,451 )   (Loss) earnings per share—Basic and diluted: From continuing operations $ (0.61 ) $ (0.94 ) $ (1.00 ) From discontinued operations   $ (0.79 )   $ 0.78     $ 0.52   (Loss) earnings per share—Basic and diluted   $ (1.40 )   $ (0.16 )   $ (0.48 )   Weighted average common shares used in computing: Basic and diluted (loss) earning per share 19,616 19,512 19,495     TIER TECHNOLOGIES, INC. Consolidated Statements of Cash Flows     Year ended September 30, (In thousands)   2008   2007   2006 CASH FLOWS FROM OPERATING ACTIVITIES:     Net loss $ (27,445 ) $ (3,034 ) $ (9,451 ) Less: (Loss) income from discontinued operations, net     (15,401 )     15,366       10,164   Loss from continuing operations, net (12,044 ) (18,400 ) (19,615 ) Non-cash items included in net income from continuing operations: Depreciation and amortization 5,497 4,744 5,479 Provision for doubtful accounts 239 (42 ) 809 Accrued forward loss on contracts (12 ) 25 (270 ) Equity in net income of unconsolidated affiliate — (475 ) (445 ) Gain on sale of unconsolidated affiliate — (80 ) — Foreign currency translation gain realized on sale of unconsolidated affiliate — (239 ) — Settlement of pension contract — 1,254 — Share-based compensation 2,224 1,514 1,768 Write-down of obsolete inventory 442 — — Write-down of goodwill and intangible assets — 9,192 — Other 23 8 76 Net effect of changes in assets and liabilities: Accounts receivable and unbilled receivables 473 (1,413 ) 1,193 Prepaid expenses and other assets 261 3,050 (228 ) Accounts payable and accrued liabilities 311 (142 ) 949 Income taxes receivable 19 3 (336 ) Deferred income     (859 )     129       (70 ) Cash used in operating activities from continuing operations (3,426 ) (872 ) (10,690 ) Cash provided by operating activities from discontinued operations     3,955       14,645       15,450   Cash provided by operating activities     529       13,773       4,760   CASH FLOWS FROM INVESTING ACTIVITIES: Purchases of marketable securities (7,325 ) (21,012 ) (45,950 ) Sales and maturities of marketable securities 33,815 3,550 44,278 Purchases of restricted investments — (22,611 ) (14,255 ) Sales and maturities of restricted investments 1,250 20,098 6,571 Purchase of equipment and software (1,951 ) (931 ) (1,310 ) Repayment of notes and accrued interest from related parties — 4,401 — Proceeds from sale of discontinued operations and equity investment 8,735 4,784 — Other investing activities     —       (164 )     —   Cash provided by (used in) investing activities for continuing operations 34,524 (11,885 ) (10,666 ) Cash used in investing activities for discontinued operations     (5,057 )     (4,010 )     (3,461 ) Cash provided by (used in) investing activities     29,467       (15,895 )     (14,127 ) CASH FLOWS FROM FINANCING ACTIVITIES: Net proceeds from issuance of common stock 1,283 213 69 Capital lease obligations and other financing arrangements     (56 )     (26 )     (38 ) Cash provided by financing activities from continuing operations 1,227 187 31 Cash used in financing activities for discontinued operations     (4 )     (6 )     (45 ) Cash provided by (used in) financing activities     1,223       181       (14 ) Effect of exchange rate changes on cash     —       (11 )     17   Net increase (decrease) in cash and cash equivalents 31,219 (1,952 ) (9,364 ) Cash and cash equivalents at beginning of period     16,516       18,468       27,832   Cash and cash equivalents at end of period   $ 47,735     $ 16,516     $ 18,468       TIER TECHNOLOGIES, INC. Consolidated Statements of Operations—Continuing Operations   Continuing Operations (in thousands) EPP   Wind-down   Corporate &Eliminations   Total Fiscal year ended September 30, 2008:       Revenues $ 117,072     $ 5,930     $ (431 )   $ 122,571   Costs and expenses: Direct costs 91,290 3,944 — 95,234 General and administrative 11,065 1,088 15,867 28,020 Selling and marketing 7,966 191 520 8,677 Depreciation and amortization   3,503       1,428       397       5,328   Total costs and expenses   113,824       6,651       16,784       137,259   (Loss) income from continuing operations before other income and income taxes   3,248       (721 )     (17,215 )     (14,688 ) Other income (expense): Interest income (expense)   (3 )     (2 )     2,736       2,731   Total other income (expense)   (3 )     (2 )     2,736       2,731   (Loss) income from continuing operations before taxes 3,245 (723 ) (14,479 ) (11,957 ) Income tax provision   —       —       87       87   (Loss) income from continuing operations $ 3,245     $ (723 )   $ (14,566 )   $ (12,044 )   Fiscal year ended September 30, 2007: Revenues $ 99,433     $ 9,258     $ (385 )   $ 108,306   Costs and expenses: Direct costs 76,388 6,280 — 82,668 General and administrative 7,057 3,284 16,031 26,372 Selling and marketing 6,848 1,091 11 7,950 Depreciation and amortization 3,206 763 604 4,573 Write down of goodwill and intangible assets   —       9,161       —       9,161   Total costs and expenses   93,499       20,579       16,646       130,724   (Loss) income from continuing operations before other income and income taxes   5,934       (11,321 )     (17,031 )     (22,418 ) Other income: Interest income — — 3,300 3,300 Income from equity investments   —       —       794       794   Other income   —       —       4,094       4,094   (Loss) income from continuing operations before taxes 5,934 (11,321 ) (12,937 ) (18,324 ) Income tax provision   76       —       —       76   (Loss) income from continuing operations $ 5,858     $ (11,321 )   $ (12,937 )   $ (18,400 )     TIER TECHNOLOGIES, INC. Consolidated Statements of Operations—Continuing Operations   Continuing Operations (in thousands)   EPP   Wind-down   Corporate &Eliminations   Total Fiscal Year Ended September 30, 2006:       Revenues   $ 78,578   $ 12,489   $ (151 )   $ 90,916   Costs and expenses: Direct costs 61,505 7,104 (162 ) 68,447 General and administrative 5,510 2,005 24,795 32,310 Selling and marketing 4,924 1,033 2,119 8,076 Depreciation and amortization     3,169     1,504     450       5,123   Total costs and expenses     75,108     11,646     27,202       113,956   (Loss) income from continuing operations before other income and income taxes     3,470     843     (27,353 )     (23,040 ) Other income: Interest income 2,136 — 815 2,951 Gain from equity investments     —     —     519       519   Total other income     2,136     —     1,334       3,470   (Loss) income from continuing operations before taxes 5,606 843 (26,019 ) (19,570 ) Income tax provision     45     —     —       45   (Loss) income from continuing operations   $ 5,561   $ 843   $ (26,019 )   $ (19,615 )     TIER TECHNOLOGIES, INC. Consolidated Statements of Operations—Discontinued Operations     Year ended September 30, 2008     Other and   (in thousands)   GBPO   PSSI   Eliminations   Total Revenues   $ 20,235     $ 24,608     $ —     $ 44,843   Costs and expenses: Direct costs 10,634 20,650 (431 ) 30,853 General and administrative 2,282 6,262 (242 ) 8,302 Selling and marketing 729 1,668 (83 ) 2,314 Depreciation and amortization 1 78 — 79 Write-down of goodwill and intangibles     141       17,623       —       17,764   Total costs and expenses     13,787       46,281       (756 )     59,312   (Loss) income before gain on discontinued operations 6,448 (21,673 ) 756 (14,469 ) (Loss) gain on discontinued operations     (1,028 )     85       11       (932 ) (Loss) income from discontinued operations, net   $ 5,420     $ (21,588 )   $ 767     $ (15,401 )   Year ended September 30, 2007 Other and (in thousands)   GBPO   PSSI   Eliminations   Total Revenues   $ 37,677     $ 31,372     $ —     $ 69,049   Costs and expenses: Direct costs 24,696 21,557 (386 ) 45,867 General and administrative 2,636 6,717 (49 ) 9,304 Selling and marketing 1,098 2,621 (18 ) 3,701 Depreciation and amortization 2 95 — 97 Write-down of goodwill and intangibles     2,671       120       —       2,791   Total costs and expenses     31,103       31,110       (453 )     61,760   Income before gain on discontinued operations 6,574 262 453 7,289 Gain on discontinued operations     —       —       8,077       8,077   Income from discontinued operations, net   $ 6,574     $ 262     $ 8,530     $ 15,366     Year ended September 30, 2006 Other and (in thousands)   GBPO   PSSI   Eliminations   Total Revenues   $ 45,478     $ 32,337     $ —     $ 77,815   Costs and expenses: Direct costs 36,157 22,448 331 58,936 General and administrative 1,400 4,251 116 5,767 Selling and marketing 623 1,702 33 2,358 Depreciation and amortization 2 132 — 134 Write-down of goodwill and intangibles     —       —       —       —   Total costs and expenses     38,182       28,533       480       67,195   Income (loss) before income taxes 7,296 3,804 (480 ) 10,620 Income tax provision     —       —       456       456   Income (loss) from discontinued operations, net   $ 7,296     $ 3,804     $ (936 )   $ 10,164    

1 Year Tier Reit Inc. Chart

1 Year Tier Reit Inc. Chart

1 Month Tier Reit Inc. Chart

1 Month Tier Reit Inc. Chart