We could not find any results for:
Make sure your spelling is correct or try broadening your search.
| Share Name | Share Symbol | Market | Type |
|---|---|---|---|
| Columbia Seligman Premium Technology Growth Fund Inc | NYSE:STK | NYSE | Common Stock |
| Price Change | % Change | Share Price | High Price | Low Price | Open Price | Shares Traded | Last Trade | |
|---|---|---|---|---|---|---|---|---|
| -0.7895 | -2.69% | 28.5505 | 29.6884 | 29.293 | 29.38 | 22,327 | 00:00:00 |
UNITED STATES
SECURITIES AND EXCHANGE COMMISSION
Washington, D.C. 20549
FORM N-CSR
CERTIFIED SHAREHOLDER REPORT OF REGISTERED MANAGEMENT INVESTMENT COMPANIES
Investment Company Act file number 811-22328
Columbia Seligman Premium Technology Growth Fund, Inc.
(Exact name of registrant as specified in charter)
290 Congress Street, Boston, MA 02210
(Address of principal executive offices) (Zip code)
Daniel J. Beckman
c/o Columbia Management Investment Advisers, LLC
290 Congress Street
Boston, MA 02210
Ryan C. Larrenaga, Esq.
c/o Columbia Management Investment Advisers, LLC
Boston, MA 02210
(Name and address of agent for service)
Registrant's telephone number, including area code: (800) 345-6611
Date of fiscal year end: December 31
Date of reporting period: December 31, 2023
Form N-CSR is to be used by management investment companies to file reports with the Commission not later than 10 days after the transmission to stockholders of any report that is required to be transmitted to stockholders under Rule 30e-1 under the Investment Company Act of 1940 (17 CFR 270.30e-1). The Commission may use the information provided on Form N-CSR in its regulatory, disclosure review, inspection, and policymaking roles.
A registrant is required to disclose the information specified by Form N-CSR, and the Commission will make this information public. A registrant is not required to respond to the collection of information contained in Form N-CSR unless the Form displays a currently valid Office of Management and Budget ("OMB") control number. Please direct comments concerning the accuracy of the information collection burden estimate and any suggestions for reducing the burden to Secretary, Securities and Exchange Commission, 100 F Street, NE, Washington, DC 20549. The OMB has reviewed this collection of information under the clearance requirements of 44 U.S.C. § 3507.
Item 1. Reports to Stockholders.


|
3
|
|
|
5
|
|
|
7
|
|
|
16
|
|
|
18
|
|
|
22
|
|
|
23
|
|
|
24
|
|
|
26
|
|
|
28
|
|
|
42
|
|
|
43
|
|
|
43
|
|
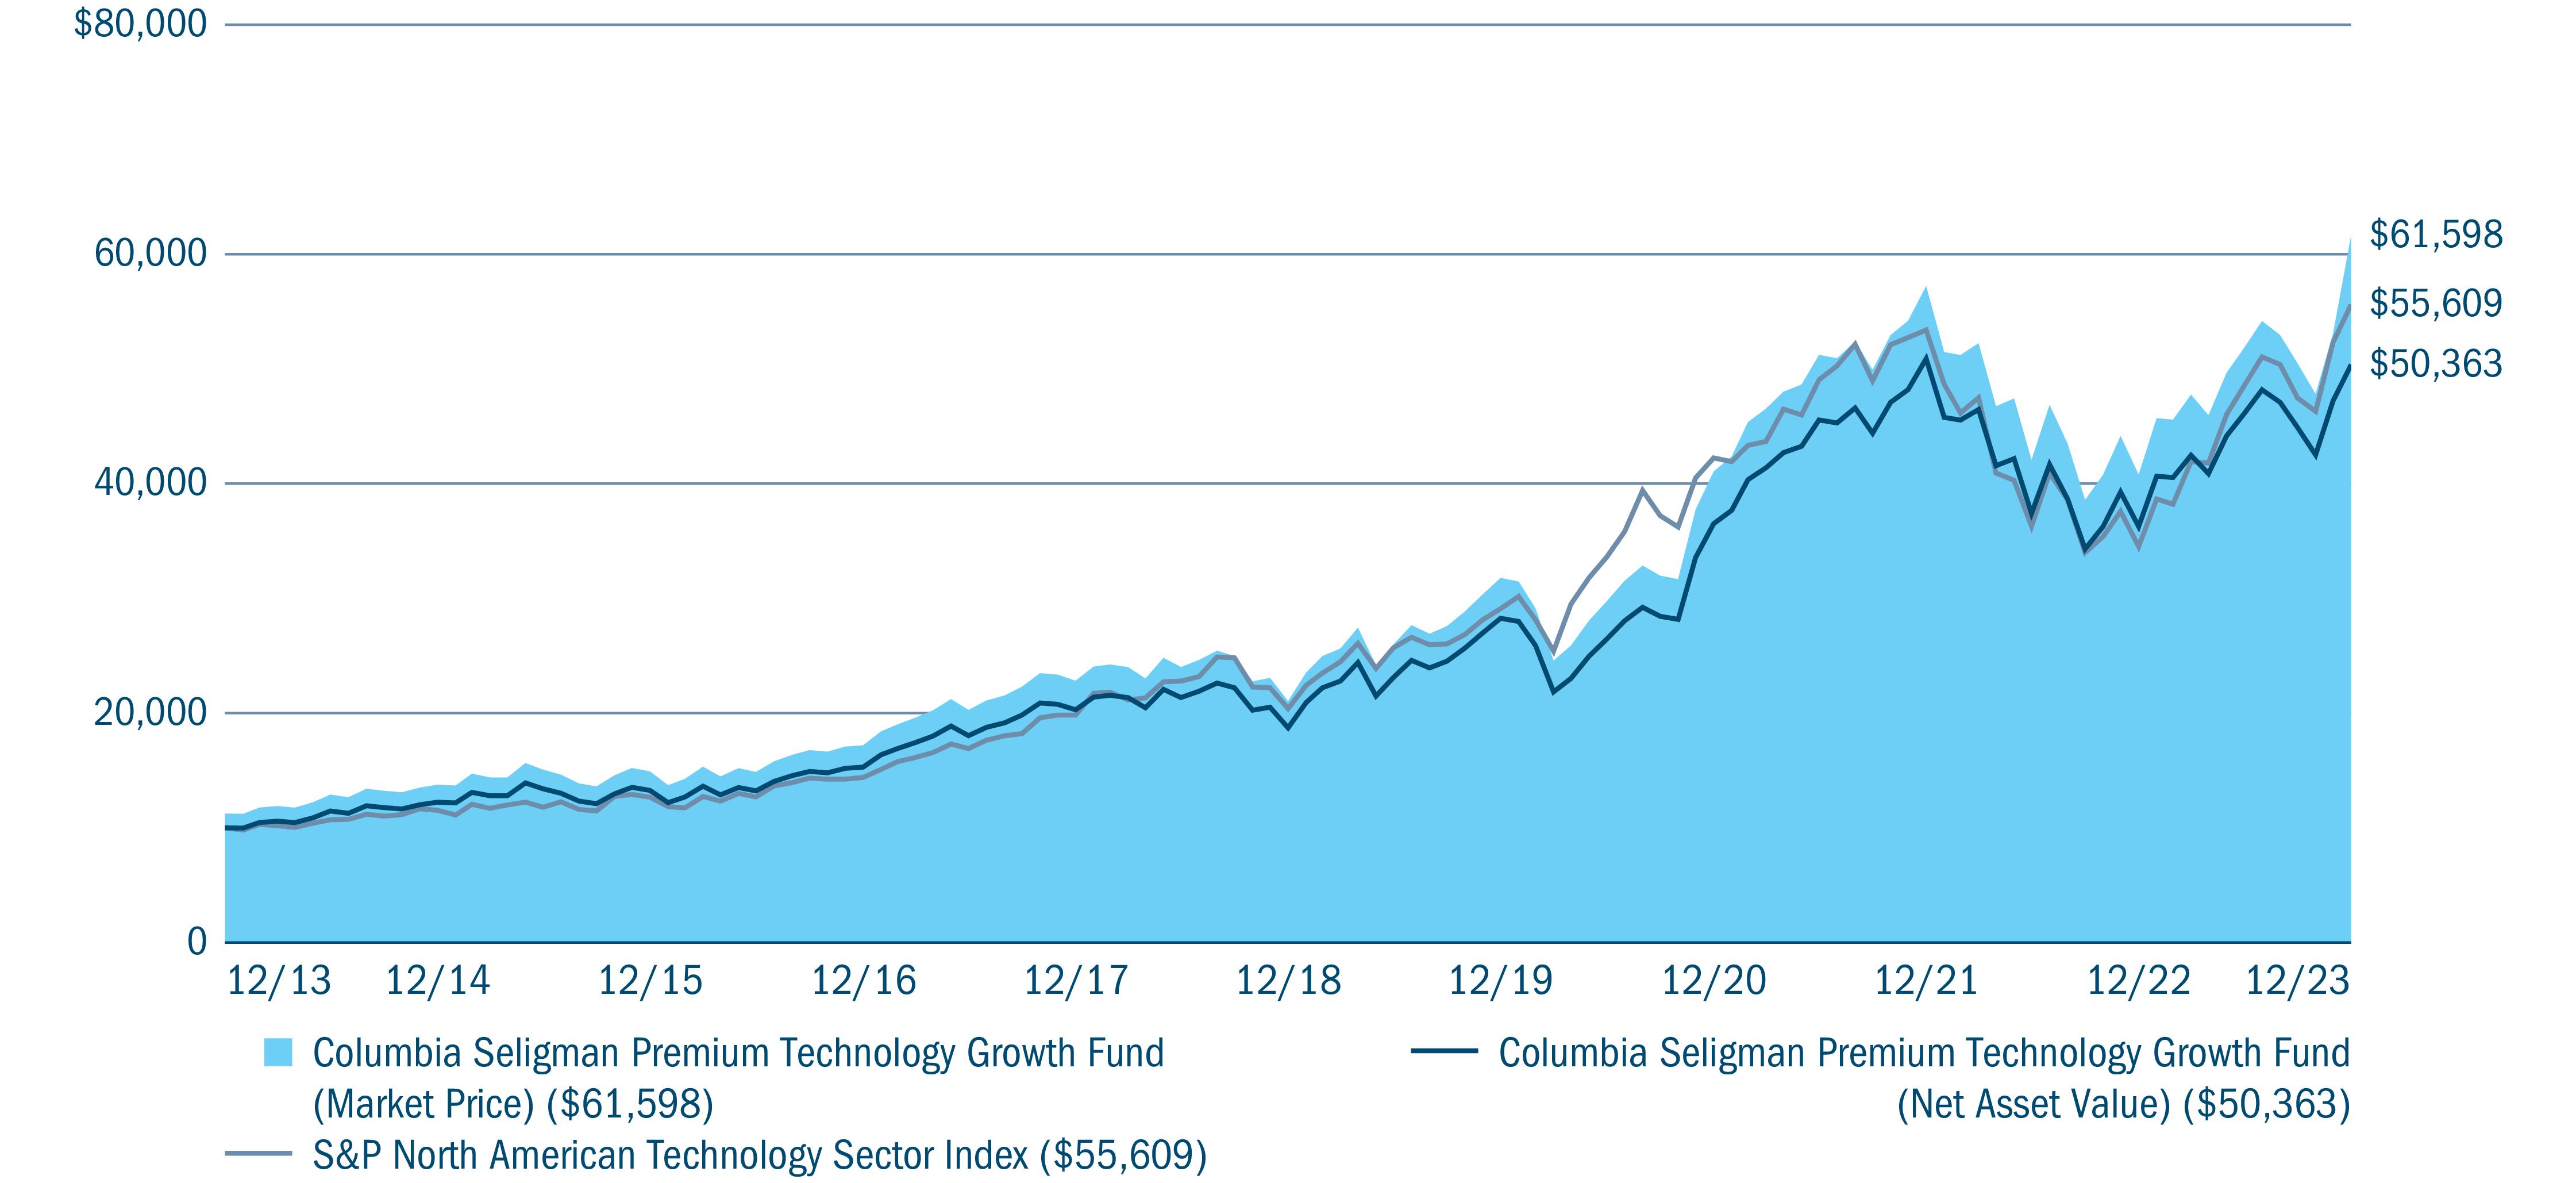
Average annual total returns (%) (for the period ended December 31, 2023)
|
|||||
|
|
|
Inception
|
1 Year
|
5 Years
|
10 Years
|
|
Market Price
|
11/24/09
|
47.19
|
24.19
|
19.94
|
|
|
Net Asset Value
|
11/30/09
|
38.89
|
21.90
|
17.55
|
|
|
S&P North American Technology
Sector Index
|
|
61.13
|
22.22
|
18.72
|
|
|
Price Per Share
|
||||
|
|
December 31, 2023
|
September 30, 2023
|
June 30, 2023
|
March 31, 2023
|
|
Market Price ($)
|
31.60
|
27.22
|
30.66
|
27.83
|
|
Net Asset Value ($)
|
29.05
|
26.57
|
27.73
|
26.03
|
|
Distributions Paid Per Common Share
|
|
|
Payable Date
|
Per Share Amount ($)
|
|
January 17, 2023
|
1.0819
(a)
|
|
February 21, 2023
|
0.4625
|
|
May 23, 2023
|
0.4625
|
|
August 22, 2023
|
0.4625
|
|
November 21, 2023
|
0.4625
|
|
January 23, 2024
|
0.2669
(b)
|
|
Portfolio breakdown (%) (at December 31, 2023)
|
|
|
Common Stocks
|
96.5
|
|
Money Market Funds
|
3.5
|
|
Total
|
100.0
|
|
Equity sector breakdown (%) (at December 31, 2023)
|
|
|
Communication Services
|
11.1
|
|
Consumer Discretionary
|
1.8
|
|
Financials
|
6.3
|
|
Health Care
|
0.0
(a)
|
|
Industrials
|
3.0
|
|
Information Technology
|
75.8
|
|
Real Estate
|
2.0
|
|
Total
|
100.0
|
|
(a)
|
Rounds to zero.
|
|
Equity sub-industry breakdown (%) (at December 31, 2023)
|
|
|
Information Technology
|
|
|
Application Software
|
8.2
|
|
Communications Equipment
|
3.5
|
|
Electronic Equipment & Instruments
|
1.5
|
|
Internet Services & Infrastructure
|
2.8
|
|
Semiconductor Materials & Equipment
|
13.4
|
|
Semiconductors
|
23.9
|
|
Systems Software
|
12.3
|
|
Technology Hardware, Storage & Peripherals
|
10.2
|
|
Total
|
75.8
|
|
When the VXN Index is:
|
Aggregate Notional Amount of
Written Call Options as a
Percentage of the Fund’s
Holdings in Common Stocks
|
|
17 or less
|
25%
|
|
Greater than 17, but less than 18
|
Increase up to 50%
|
|
At least 18, but less than 33
|
50%
|
|
At least 33, but less than 34
|
Increase up to 90%
|
|
At least 34, but less than 55
|
90%
|
|
At 55 or greater
|
0% to 90%
|
|
Stockholder Transaction Expenses
|
|
|
Dividend investment plan
|
None(a
)
|
|
Annual Expenses (as a percentage of net assets attributable to common shares)
|
|
|
Management fees(b)
|
1.06%
|
|
Other expenses
|
0.07%
|
|
Acquired fund fees and expenses
|
0.00%
|
|
Total Annual Expenses(c)
|
1.13%
|
|
|
1 year
|
3 years
|
5 years
|
10 years
|
|
Columbia Seligman Premium Technology Growth Fund, Inc. Common Stock
|
$12
|
$36
|
$62
|
$137
|
|
|
Market Price ($)
|
Corresponding NAV ($)
|
Corresponding (Discount)/Premium to NAV (%)
|
|||
|
|
High
|
Low
|
High
|
Low
|
High
|
Low
|
|
2022
|
|
|
|
|
|
|
|
1st Quarter
|
37.50
|
28.28
|
35.64
|
28.72
|
5.22
|
(1.53
)
|
|
2nd Quarter
|
32.11
|
24.47
|
32.13
|
24.64
|
(0.06
)
|
(0.69
)
|
|
3rd Quarter
|
32.24
|
23.19
|
28.62
|
22.78
|
12.65
|
1.80
|
|
4th Quarter
|
27.69
|
22.48
|
25.84
|
21.98
|
7.16
|
2.27
|
|
2023
|
|
|
|
|
|
|
|
1st Quarter
|
28.08
|
22.73
|
26.34
|
22.48
|
6.61
|
1.11
|
|
2nd Quarter
|
31.35
|
26.23
|
27.65
|
24.66
|
13.38
|
6.37
|
|
3rd Quarter
|
31.04
|
26.75
|
28.99
|
26.05
|
7.07
|
2.69
|
|
4th Quarter
|
31.91
|
25.18
|
29.26
|
24.88
|
9.06
|
1.21
|
|
Common Stocks 97.4%
|
||
|
Issuer
|
Shares
|
Value ($)
|
|
Communication Services 10.8%
|
||
|
Cable & Satellite 1.1%
|
||
|
Comcast Corp., Class A
|
122,775
|
5,383,684
|
|
Interactive Media & Services 8.3%
|
||
|
Alphabet, Inc., Class A(a),(b)
|
141,720
|
19,796,867
|
|
Alphabet, Inc., Class C(a)
|
69,100
|
9,738,263
|
|
Match Group, Inc.(a)
|
56,400
|
2,058,600
|
|
Meta Platforms, Inc., Class A(a)
|
7,150
|
2,530,814
|
|
Pinterest, Inc., Class A(a)
|
117,392
|
4,348,200
|
|
TripAdvisor, Inc.(a)
|
54,850
|
1,180,920
|
|
Total
|
39,653,664
|
|
|
Movies & Entertainment 0.5%
|
||
|
Warner Bros Discovery, Inc.(a)
|
215,556
|
2,453,027
|
|
Wireless Telecommunication Services 0.9%
|
||
|
T-Mobile US, Inc.
|
26,500
|
4,248,745
|
|
Total Communication Services
|
51,739,120
|
|
|
Consumer Discretionary 1.8%
|
||
|
Broadline Retail 1.8%
|
||
|
eBay, Inc.
|
199,304
|
8,693,640
|
|
Total Consumer Discretionary
|
8,693,640
|
|
|
Financials 6.2%
|
||
|
Transaction & Payment Processing Services 6.2%
|
||
|
Block, Inc., Class A(a)
|
32,850
|
2,540,947
|
|
Fiserv, Inc.(a)
|
40,565
|
5,388,655
|
|
Global Payments, Inc.
|
59,000
|
7,493,000
|
|
Visa, Inc., Class A
|
54,225
|
14,117,479
|
|
Total
|
29,540,081
|
|
|
Total Financials
|
29,540,081
|
|
|
Health Care 0.0%
|
||
|
Biotechnology 0.0%
|
||
|
Eiger BioPharmaceuticals, Inc.(a)
|
110,761
|
24,866
|
|
Total Health Care
|
24,866
|
|
|
Industrials 2.9%
|
||
|
Heavy Electrical Equipment 2.7%
|
||
|
Bloom Energy Corp., Class A(a)
|
868,605
|
12,855,354
|
|
Common Stocks (continued)
|
||
|
Issuer
|
Shares
|
Value ($)
|
|
Human Resource & Employment Services 0.2%
|
||
|
HireRight Holdings Corp.(a)
|
78,023
|
1,049,409
|
|
Total Industrials
|
13,904,763
|
|
|
Information Technology 73.8%
|
||
|
Application Software 8.0%
|
||
|
ANSYS, Inc.(a)
|
4,300
|
1,560,384
|
|
AppLovin Corp.(a)
|
23,852
|
950,502
|
|
Cerence, Inc.(a)
|
83,867
|
1,648,825
|
|
Dropbox, Inc., Class A(a)
|
446,935
|
13,175,644
|
|
Five9, Inc.(a)
|
17,100
|
1,345,599
|
|
RingCentral, Inc., Class A(a)
|
127,283
|
4,321,258
|
|
Salesforce, Inc.(a)
|
11,060
|
2,910,328
|
|
Synopsys, Inc.(a)
|
24,268
|
12,495,836
|
|
Total
|
38,408,376
|
|
|
Communications Equipment 3.4%
|
||
|
Arista Networks, Inc.(a)
|
16,944
|
3,990,481
|
|
F5, Inc.(a)
|
45,500
|
8,143,590
|
|
Lumentum Holdings, Inc.(a)
|
78,974
|
4,139,817
|
|
Total
|
16,273,888
|
|
|
Electronic Equipment & Instruments 1.5%
|
||
|
Advanced Energy Industries, Inc.
|
65,453
|
7,129,141
|
|
Internet Services & Infrastructure 2.7%
|
||
|
GoDaddy, Inc., Class A(a),(b)
|
122,160
|
12,968,506
|
|
Semiconductor Materials & Equipment 13.0%
|
||
|
Applied Materials, Inc.(b)
|
109,986
|
17,825,431
|
|
Lam Research Corp.(b)
|
36,797
|
28,821,618
|
|
Teradyne, Inc.(b)
|
145,207
|
15,757,864
|
|
Total
|
62,404,913
|
|
|
Semiconductors 23.3%
|
||
|
Analog Devices, Inc.
|
48,294
|
9,589,257
|
|
Broadcom, Inc.(b)
|
24,914
|
27,810,252
|
|
Marvell Technology, Inc.
|
197,922
|
11,936,676
|
|
Microchip Technology, Inc.
|
72,300
|
6,520,014
|
|
NVIDIA Corp.
|
19,023
|
9,420,570
|
|
NXP Semiconductors NV
|
30,100
|
6,913,368
|
|
ON Semiconductor Corp.(a)
|
77,600
|
6,481,928
|
|
Qorvo, Inc.(a)
|
32,075
|
3,611,966
|
|
Common Stocks (continued)
|
||
|
Issuer
|
Shares
|
Value ($)
|
|
QUALCOMM, Inc.
|
14,000
|
2,024,820
|
|
Renesas Electronics Corp.(a)
|
539,800
|
9,652,145
|
|
Semtech Corp.(a)
|
117,200
|
2,567,852
|
|
Skyworks Solutions, Inc.
|
4,300
|
483,406
|
|
SMART Global Holdings, Inc.(a)
|
121,890
|
2,307,378
|
|
Synaptics, Inc.(a)
|
106,403
|
12,138,454
|
|
Total
|
111,458,086
|
|
|
Systems Software 12.0%
|
||
|
Adeia, Inc.
|
319,325
|
3,956,437
|
|
Gen Digital, Inc.
|
435,048
|
9,927,795
|
|
Microsoft Corp.(b)
|
68,525
|
25,768,141
|
|
Oracle Corp.
|
82,510
|
8,699,029
|
|
Palo Alto Networks, Inc.(a)
|
21,633
|
6,379,139
|
|
Tenable Holdings, Inc.(a)
|
61,650
|
2,839,599
|
|
Total
|
57,570,140
|
|
|
Technology Hardware, Storage & Peripherals 9.9%
|
||
|
Apple, Inc.(b)
|
139,000
|
26,761,670
|
|
Dell Technologies, Inc.(b)
|
72,029
|
5,510,219
|
|
NetApp, Inc.
|
122,759
|
10,822,433
|
|
Western Digital Corp.(a)
|
81,249
|
4,255,010
|
|
Total
|
47,349,332
|
|
|
Total Information Technology
|
353,562,382
|
|
|
Common Stocks (continued)
|
||
|
Issuer
|
Shares
|
Value ($)
|
|
Real Estate 1.9%
|
||
|
Telecom Tower REITs 1.9%
|
||
|
American Tower Corp.
|
20,010
|
4,319,759
|
|
Crown Castle, Inc.
|
42,067
|
4,845,698
|
|
Total
|
9,165,457
|
|
|
Total Real Estate
|
9,165,457
|
|
|
Total Common Stocks
(Cost: $236,932,088)
|
466,630,309
|
|
|
|
||
|
Money Market Funds 3.6%
|
||
|
|
Shares
|
Value ($)
|
|
Columbia Short-Term Cash Fund, 5.569%(c),(d)
|
17,084,187
|
17,080,770
|
|
Total Money Market Funds
(Cost: $17,078,562)
|
17,080,770
|
|
|
Total Investments in Securities
(Cost $254,010,650)
|
483,711,079
|
|
|
Other Assets & Liabilities, Net
|
|
(4,787,475
)
|
|
Net Assets
|
$478,923,604
|
|
|
Call option contracts written
|
||||||||
|
Description
|
Counterparty
|
Trading
currency
|
Notional
amount
|
Number of
contracts
|
Exercise
price/Rate
|
Expiration
date
|
Premium
received ($)
|
Value ($)
|
|
Comcast Corp
|
Morgan Stanley
|
USD
|
(1,201,490
)
|
(274
)
|
45.00
|
1/19/2024
|
(26,507
)
|
(9,042
)
|
|
GoDaddy, Inc.
|
Morgan Stanley
|
USD
|
(817,432
)
|
(77
)
|
90.00
|
1/19/2024
|
(13,737
)
|
(125,895
)
|
|
NASDAQ 100 Index
|
Morgan Stanley
|
USD
|
(116,098,917
)
|
(69
)
|
17,400.00
|
1/19/2024
|
(517,252
)
|
(287,040
)
|
|
Total
|
|
|
|
|
|
|
(557,496
)
|
(421,977
)
|
|
(a)
|
Non-income producing investment.
|
|
(b)
|
This security or a portion of this security has been pledged as collateral in connection with derivative contracts.
|
|
(c)
|
The rate shown is the seven-day current annualized yield at December 31, 2023.
|
|
(d)
|
As defined in the Investment Company Act of 1940, as amended, an affiliated company is one in which the Fund owns 5% or more of the company’s outstanding voting securities, or a company which is under common ownership or control with the Fund. The value of the holdings and transactions in these
affiliated companies during the year ended December 31, 2023 are as follows:
|
|
Affiliated issuers
|
Beginning
of period($)
|
Purchases($)
|
Sales($)
|
Net change in
unrealized
appreciation
(depreciation)($)
|
End of
period($)
|
Realized gain
(loss)($)
|
Dividends($)
|
End of
period shares
|
|
Columbia Short-Term Cash Fund, 5.569%
|
||||||||
|
|
15,758,690
|
103,503,961
|
(102,179,969
)
|
(1,912
)
|
17,080,770
|
3,081
|
533,218
|
17,084,187
|
|
USD
|
US Dollar
|
|
|
Level 1 ($)
|
Level 2 ($)
|
Level 3 ($)
|
Total ($)
|
|
Investments in Securities
|
|
|
|
|
|
Common Stocks
|
|
|
|
|
|
Communication Services
|
51,739,120
|
—
|
—
|
51,739,120
|
|
Consumer Discretionary
|
8,693,640
|
—
|
—
|
8,693,640
|
|
Financials
|
29,540,081
|
—
|
—
|
29,540,081
|
|
Health Care
|
24,866
|
—
|
—
|
24,866
|
|
Industrials
|
13,904,763
|
—
|
—
|
13,904,763
|
|
Information Technology
|
343,910,237
|
9,652,145
|
—
|
353,562,382
|
|
Real Estate
|
9,165,457
|
—
|
—
|
9,165,457
|
|
Total Common Stocks
|
456,978,164
|
9,652,145
|
—
|
466,630,309
|
|
Money Market Funds
|
17,080,770
|
—
|
—
|
17,080,770
|
|
Total Investments in Securities
|
474,058,934
|
9,652,145
|
—
|
483,711,079
|
|
Investments in Derivatives
|
|
|
|
|
|
Liability
|
|
|
|
|
|
Call Option Contracts Written
|
(421,977
)
|
—
|
—
|
(421,977
)
|
|
Total
|
473,636,957
|
9,652,145
|
—
|
483,289,102
|
|
Assets
|
|
|
Investments in securities, at value
|
|
|
Unaffiliated issuers (cost $236,932,088)
|
$466,630,309
|
|
Affiliated issuers (cost $17,078,562)
|
17,080,770
|
|
Cash
|
114,975
|
|
Receivable for:
|
|
|
Investments sold
|
381,877
|
|
Dividends
|
209,110
|
|
Foreign tax reclaims
|
7,276
|
|
Prepaid expenses
|
84,935
|
|
Total assets
|
484,509,252
|
|
Liabilities
|
|
|
Option contracts written, at value (premiums received $557,496)
|
421,977
|
|
Payable for:
|
|
|
Investments purchased
|
543,682
|
|
Distributions to shareholders
|
4,400,604
|
|
Management services fees
|
14,009
|
|
Stockholder servicing and transfer agent fees
|
4,958
|
|
Stockholders’ meeting fees
|
1,289
|
|
Compensation of chief compliance officer
|
86
|
|
Compensation of board members
|
11,313
|
|
Other expenses
|
49,094
|
|
Deferred compensation of board members
|
138,636
|
|
Total liabilities
|
5,585,648
|
|
Net assets applicable to outstanding Common Stock
|
$478,923,604
|
|
Represented by
|
|
|
Paid in capital
|
234,146,762
|
|
Total distributable earnings (loss)
|
244,776,842
|
|
Total - representing net assets applicable to outstanding Common Stock
|
$478,923,604
|
|
Shares outstanding applicable to Common Stock
|
16,487,836
|
|
Net asset value per share of outstanding Common Stock
|
$29.05
|
|
Market price per share of Common Stock
|
$31.60
|
|
Net investment income
|
|
|
Income:
|
|
|
Dividends — unaffiliated issuers
|
$3,578,673
|
|
Dividends — affiliated issuers
|
533,218
|
|
Interfund lending
|
114
|
|
Foreign taxes withheld
|
(23,033
)
|
|
Total income
|
4,088,972
|
|
Expenses:
|
|
|
Management services fees
|
4,580,664
|
|
Stockholder servicing and transfer agent fees
|
27,537
|
|
Custodian fees
|
11,203
|
|
Printing and postage fees
|
79,592
|
|
Stockholders’ meeting fees
|
40,236
|
|
Accounting services fees
|
51,204
|
|
Legal fees
|
5,520
|
|
Compensation of chief compliance officer
|
85
|
|
Compensation of board members
|
24,930
|
|
Deferred compensation of board members
|
17,116
|
|
Other
|
55,282
|
|
Total expenses
|
4,893,369
|
|
Net investment loss
|
(804,397
)
|
|
Realized and unrealized gain (loss) — net
|
|
|
Net realized gain (loss) on:
|
|
|
Investments — unaffiliated issuers
|
64,233,865
|
|
Investments — affiliated issuers
|
3,081
|
|
Foreign currency translations
|
(7,434
)
|
|
Option contracts written
|
(20,350,092
)
|
|
Net realized gain
|
43,879,420
|
|
Net change in unrealized appreciation (depreciation) on:
|
|
|
Investments — unaffiliated issuers
|
98,126,900
|
|
Investments — affiliated issuers
|
(1,912
)
|
|
Foreign currency translations
|
221
|
|
Option contracts written
|
(1,004,132
)
|
|
Net change in unrealized appreciation (depreciation)
|
97,121,077
|
|
Net realized and unrealized gain
|
141,000,497
|
|
Net increase in net assets resulting from operations
|
$140,196,100
|
|
|
Year Ended
December 31, 2023
|
Year Ended
December 31, 2022
|
|
Operations
|
|
|
|
Net investment loss
|
$(804,397
)
|
$(1,289,299
)
|
|
Net realized gain
|
43,879,420
|
29,443,304
|
|
Net change in unrealized appreciation (depreciation)
|
97,121,077
|
(187,447,051
)
|
|
Net increase (decrease) in net assets resulting from operations
|
140,196,100
|
(159,293,046
)
|
|
Distributions to stockholders
|
|
|
|
Net investment income and net realized gains
|
(34,875,642
)
|
(47,396,357
)
|
|
Total distributions to stockholders
|
(34,875,642
)
|
(47,396,357
)
|
|
Increase in net assets from capital stock activity
|
7,567,091
|
8,505,378
|
|
Total increase (decrease) in net assets
|
112,887,549
|
(198,184,025
)
|
|
Net assets at beginning of year
|
366,036,055
|
564,220,080
|
|
Net assets at end of year
|
$478,923,604
|
$366,036,055
|
|
|
Year Ended
|
Year Ended
|
||
|
|
December 31, 2023
|
December 31, 2022
|
||
|
|
Shares
|
Dollars ($)
|
Shares
|
Dollars ($)
|
|
Capital stock activity
|
||||
|
Common Stock issued at market price in distributions
|
312,579
|
7,567,091
|
245,709
|
8,505,378
|
|
Total net increase
|
312,579
|
7,567,091
|
245,709
|
8,505,378
|
|
|
Year ended December 31,
|
||
|
2023
|
2022
|
2021
|
|
|
Per share data
|
|||
|
Net asset value, beginning of period
|
$22.63
|
$35.42
|
$27.86
|
|
Income from investment operations:
|
|||
|
Net investment income (loss)
|
(0.05
)
|
(0.08
)
|
(0.06
)
|
|
Net realized and unrealized gain (loss)
|
8.58
|
(9.78
)
|
10.76
|
|
Total from investment operations
|
8.53
|
(9.86
)
|
10.70
|
|
Less distributions to Stockholders from:
|
|||
|
Net investment income
|
—
|
—
|
—
|
|
Net realized gains
|
(2.12
)
|
(2.93
)
|
(3.14
)
|
|
Total distributions to Stockholders
|
(2.12
)
|
(2.93
)
|
(3.14
)
|
|
(Dilution) Anti-dilution in net asset value from share purchases (via dividend reinvestment program)(a)
|
0.01
|
(0.00
)(b)
|
—
|
|
Anti-dilution in net asset value from share buy-backs (via stock repurchase program)(a)
|
—
|
—
|
—
|
|
Net asset value, end of period
|
$29.05
|
$22.63
|
$35.42
|
|
Market price, end of period
|
$31.60
|
$23.23
|
$37.01
|
|
Total return
|
|||
|
Based upon net asset value
|
38.89
%
|
(28.74
%)
|
39.38
%
|
|
Based upon market price
|
47.19
%
|
(29.99
%)
|
48.96
%
|
|
Ratios to average net assets
|
|||
|
Total gross expenses(c)
|
1.13
%
|
1.13
%
|
1.13
%
|
|
Net investment income (loss)
|
(0.19
%)
|
(0.29
%)
|
(0.18
%)
|
|
Supplemental data
|
|||
|
Net assets, end of period (in thousands)
|
$478,924
|
$366,036
|
$564,220
|
|
Portfolio turnover
|
25
%
|
9
%
|
27
%
|
|
Notes to Financial Highlights
|
|
|
(a)
|
Prior to the period ended December 31, 2022, per share amounts were only presented if the net dilution/anti-dilution impact was material relative to the Fund’s average net assets for Common Stock.
|
|
(b)
|
Rounds to zero.
|
|
(c)
|
In addition to the fees and expenses that the Fund bears directly, the Fund indirectly bears a pro rata share of the fees
and expenses of any other funds in which it invests. Such indirect expenses are not included in the Fund’s reported expense ratios.
|
|
Year ended December 31,
|
||||||
|
2020
|
2019
|
2018
|
2017
|
2016
|
2015
|
2014
|
|
|
||||||
|
$23.43
|
$16.96
|
$20.83
|
$17.78
|
$17.29
|
$17.69
|
$16.18
|
|
|
||||||
|
0.11
|
(0.02
)
|
(0.01
)
|
(0.06
)
|
(0.05
)
|
(0.04
)
|
(0.07
)
|
|
6.17
|
8.34
|
(1.36
)
|
5.74
|
2.39
|
1.49
|
3.43
|
|
6.28
|
8.32
|
(1.37
)
|
5.68
|
2.34
|
1.45
|
3.36
|
|
|
||||||
|
(0.11
)
|
—
|
—
|
—
|
—
|
—
|
—
|
|
(1.74
)
|
(1.85
)
|
(2.50
)
|
(2.63
)
|
(1.85
)
|
(1.85
)
|
(1.85
)
|
|
(1.85
)
|
(1.85
)
|
(2.50
)
|
(2.63
)
|
(1.85
)
|
(1.85
)
|
(1.85
)
|
|
—
|
—
|
—
|
—
|
—
|
—
|
—
|
|
—
|
—
|
—
|
—
|
—
|
—
|
—
|
|
$27.86
|
$23.43
|
$16.96
|
$20.83
|
$17.78
|
$17.29
|
$17.69
|
|
$27.24
|
$23.55
|
$16.81
|
$22.25
|
$18.74
|
$17.93
|
$18.93
|
|
|
||||||
|
29.17
%
|
51.04
%
|
(7.77
%)
|
32.72
%
|
15.29
%
|
8.40
%
|
22.32
%
|
|
25.65
%
|
53.17
%
|
(14.42
%)
|
34.51
%
|
17.18
%
|
5.05
%
|
47.17
%
|
|
|
||||||
|
1.15
%
|
1.15
%
|
1.15
%
|
1.16
%
|
1.17
%
|
1.17
%
|
1.17
%
|
|
0.50
%
|
(0.08
%)
|
(0.05
%)
|
(0.28
%)
|
(0.33
%)
|
(0.24
%)
|
(0.41
%)
|
|
|
||||||
|
$443,114
|
$372,063
|
$265,315
|
$320,472
|
$273,226
|
$265,426
|
$271,300
|
|
32
%
|
43
%
|
34
%
|
47
%
|
61
%
|
61
%
|
60
%
|
|
|
Liability derivatives
|
|
|
Risk exposure
category
|
Statement
of assets and liabilities
location
|
Fair value ($)
|
|
Equity risk
|
Option contracts written, at value
|
421,977
|
|
Amount of realized gain (loss) on derivatives recognized in income
|
|
|
Risk exposure category
|
Option
contracts
written
($)
|
|
Equity risk
|
(20,350,092
)
|
|
|
|
|
Change in unrealized appreciation (depreciation) on derivatives recognized in income
|
|
|
Risk exposure category
|
Option
contracts
written
($)
|
|
Equity risk
|
(1,004,132
)
|
|
Derivative instrument
|
Average
value ($)
|
|
Option contracts written
|
(1,999,630
)
|
|
|
Morgan
Stanley ($)
|
|
Liabilities
|
|
|
Call option contracts written
|
421,977
|
|
Total financial and derivative net assets
|
(421,977
)
|
|
Total collateral received (pledged) (a)
|
(421,977
)
|
|
Net amount (b)
|
-
|
|
(a)
|
In some instances, the actual collateral received and/or pledged may be more than the amount shown due to overcollateralization.
|
|
(b)
|
Represents the net amount due from/(to) counterparties in the event of default.
|
|
Excess of distributions
over net investment
income ($)
|
Accumulated
net realized
gain ($)
|
Paid in
capital ($)
|
|
795,101
|
7,433
|
(802,534
)
|
|
Year Ended December 31, 2023
|
Year Ended December 31, 2022
|
||||
|
Ordinary
income ($)
|
Long-term
capital gains ($)
|
Total ($)
|
Ordinary
income ($)
|
Long-term
capital gains ($)
|
Total ($)
|
|
917,779
|
33,957,863
|
34,875,642
|
954,340
|
46,442,017
|
47,396,357
|
|
Undistributed
ordinary income ($)
|
Undistributed
long-term
capital gains ($)
|
Capital loss
carryforwards ($)
|
Net unrealized
appreciation ($)
|
|
—
|
16,666,114
|
—
|
228,249,261
|
|
Federal
tax cost ($)
|
Gross unrealized
appreciation ($)
|
Gross unrealized
(depreciation) ($)
|
Net unrealized
appreciation ($)
|
|
255,039,841
|
237,175,744
|
(8,926,483
)
|
228,249,261
|
|
Borrower or lender
|
Average loan
balance ($)
|
Weighted average
interest rate (%)
|
Number of days
with outstanding loans
|
|
Lender
|
700,000
|
5.86
|
1
|
|
Qualified
dividend
income
|
Dividends
received
deduction
|
Capital
gain
dividend
|
|
100.00%
|
100.00%
|
$45,388,154
|
|
Name, Address,
Year of Birth
|
Position Held
With the Fund and
Length of Service
|
Principal Occupation(s)
During the Past Five Years
and Other Relevant
Professional Experience
|
Number of
Funds in the
Columbia Funds
Complex*
Overseen
|
Other Directorships
Held by Director
During the Past
Five Years and other
Relevant Board
Experience
|
|
George S. Batejan
c/o Columbia Management
Investment Advisers LLC
290 Congress Street
Boston, MA 02210
1954
|
Director since January
2018
|
Executive Vice President, Global Head of Technology
and Operations, Janus Capital Group, Inc.,
2010-2016
|
161
|
Former Chairman of the Board,
NICSA (National Investment
Company Services Association)
(Executive Committee,
Nominating Committee and
Governance Committee),
2014-2016; former Director,
Intech Investment
Management, 2011-2016;
former Board Member, Metro
Denver Chamber of Commerce,
2015-2016; former Advisory
Board Member, University of
Colorado Business School,
2015-2018; former Board
Member, Chase Bank
International, 1993-1994
|
|
Name, Address,
Year of Birth
|
Position Held
With the Fund and
Length of Service
|
Principal Occupation(s)
During the Past Five Years
and Other Relevant
Professional Experience
|
Number of
Funds in the
Columbia Funds
Complex*
Overseen
|
Other Directorships
Held by Director
During the Past
Five Years and other
Relevant Board
Experience
|
|
Kathleen Blatz
c/o Columbia Management
Investment Advisers LLC
290 Congress Street
Boston, MA 02210
1954
|
Director since October
2009
|
Attorney, specializing in arbitration and mediation;
Trustee of Gerald Rauenhorst 1982 Trusts, since
2020; Chief Justice, Minnesota Supreme Court,
1998-2006; Associate Justice, Minnesota Supreme
Court, 1996-1998; Fourth Judicial District Court
Judge, Hennepin County, 1994-1996; Attorney in
private practice and public service, 1984-1993;State
Representative, Minnesota House of Representatives,
1979-1993, which included service on the Tax and
Financial Institutions and Insurance Committees;
Member and Interim Chair, Minnesota Sports Facilities
Authority, January -July 2017; Interim President and
Chief Executive Officer, Blue Cross and Blue Shield of
Minnesota (health care insurance), February-July
2018, April-October 2021
|
161
|
Former Trustee, Blue Cross and
Blue Shield of Minnesota,
2009-2021 (Chair of the
Business Development
Committee, 2014-2017; Chair
of the Governance Committee,
2017-2019); former Member
and Chair of the Board,
Minnesota Sports Facilities
Authority, January 2017-July
2017; former Director, Robina
Foundation, 2009-2020
(Chair, 2014-2020); Director,
Richard M. Schulze Family
Foundation, since 2021
|
|
Pamela G. Carlton
c/o Columbia Management
Investment Advisers LLC
290 Congress Street
Boston, MA 02210
1954
|
Director since October
2009; Chair of the
Board since January
2023
|
President, Springboard-Partners in Cross Cultural
Leadership (consulting company), since 2003;
Managing Director of US Equity Research, JP Morgan
Chase, 1999-2003; Director of US Equity Research,
Chase Asset Management, 1996-1999; Co-Director
Latin America Research, 1993-1996, COO Global
Research, 1992-1996, Co-Director of US Research,
1991-1992, Investment Banker, 1982-1991, Morgan
Stanley; Attorney, Cleary Gottlieb Steen &
Hamilton LLP, 1980-1982
|
161
|
Trustee, New York Presbyterian
Hospital Board, since 1996;
Director, DR Bank (Audit
Committee, since 2017 and
Audit Committee Chair, since
November 2023); Director,
Evercore Inc. (Audit
Committee, Nominating and
Governance Committee)
(financial services), since
2019; Director, Apollo
Commercial Real Estate
Finance, Inc. (Chair,
Nominating and Governance
Committee), since 2021; the
Governing Council of the
Independent Directors Council
(IDC), since 2021
|
|
Janet Langford Carrig
c/o Columbia Management
Investment Advisers, LLC
290 Congress Street
Boston, MA 02210
1957
|
Director since January
2023
|
Senior Vice President, General Counsel and Corporate
Secretary, ConocoPhillips (independent energy
company), September 2007-October 2018
|
161
|
Director, EQT Corporation
(natural gas producer), since
2019; former Director, Whiting
Petroleum Corporation
(independent oil and gas
company), 2020-2022
|
|
Patricia M. Flynn
c/o Columbia Management
Investment Advisers LLC
290 Congress Street
Boston, MA 02210
1950
|
Director since October
2009
|
Professor Emeritus of Economics and Management,
Bentley University, since 2023; Professor of
Economics and Management, Bentley University,
1976-2023; Dean, McCallum Graduate School of
Business, Bentley University, 1992-2002
|
161
|
Former Trustee, MA Taxpayers
Foundation, 1997-2022;
former Director, The MA
Business Roundtable,
2003-2019; former
Chairperson, Innovation Index
Advisory Committee, MA
Technology Collaborative,
1997-2020
|
|
Name, Address,
Year of Birth
|
Position Held
With the Fund and
Length of Service
|
Principal Occupation(s)
During the Past Five Years
and Other Relevant
Professional Experience
|
Number of
Funds in the
Columbia Funds
Complex*
Overseen
|
Other Directorships
Held by Director
During the Past
Five Years and other
Relevant Board
Experience
|
|
Brian J. Gallagher
c/o Columbia Management
Investment Advisers LLC
290 Congress Street
Boston, MA 02210
1954
|
Director since January
2020
|
Retired; Partner with Deloitte & Touche LLP and its
predecessors, 1977-2016
|
161
|
Trustee, Catholic Schools
Foundation, since 2004
|
|
Douglas A. Hacker
c/o Columbia Management
Investment Advisers, LLC
290 Congress Street
Boston, MA 02210
1955
|
Director since
January 2022
|
Independent business executive, since May 2006;
Executive Vice President – Strategy of United Airlines,
December 2002-May 2006; President of UAL Loyalty
Services (airline marketing company), September
2001-December 2002; Executive Vice President and
Chief Financial Officer of United Airlines, July
1999-September 2001
|
161
|
Director, SpartanNash
Company since November
2013 (Chair of the Board since
May 2021) (food distributor);
Director, Aircastle Limited
(Chair of Audit Committee)
(aircraft leasing); former
Director, Nash Finch Company
(food distributor), 2005-2013;
former Director, SeaCube
Container Leasing Ltd.
(container leasing),
2010-2013; and former
Director, Travelport Worldwide
Limited (travel information
technology), 2014-2019
|
|
David M. Moffett
c/o Columbia Management
Investment Advisers, LLC
290 Congress Street
Boston, MA 02210
1955
|
Director since January
2024
|
Retired; former Chief Executive Officer of Freddie Mac
and Chief Financial Officer of U.S. Bank
|
161
|
Director, CSX Corporation
(transportation suppliers);
Director, PayPal Holdings Inc.
(payment and data processing
services); former Director,
eBay Inc. (online trading
community), 2007-2015; and
former Director, CIT Bank, CIT
Group Inc. (commercial and
consumer finance),
2010-2016; former Senior
Adviser to The Carlyle Group
(financial services), March
2008-September 2008; former
Governance Consultant to
Bridgewater Associates
(investment company), January
2013-December 2015
|
|
Catherine James Paglia
c/o Columbia Management
Investment Advisers LLC
290 Congress Street
Boston, MA 02210
1952
|
Director since October
2009
|
Director, Enterprise Asset Management, Inc. (private
real estate and asset management company), since
September 1998; Managing Director and Partner,
Interlaken Capital, Inc., 1989-1997; Vice President,
1982-1985, Principal, 1985-1987, Managing
Director, 1987-1989, Morgan Stanley; Vice President,
Investment Banking, 1980-1982, Associate,
Investment Banking, 1976-1980, Dean Witter
Reynolds, Inc.
|
161
|
Director, Valmont Industries,
Inc. (irrigation systems
manufacturer), since 2012;
Trustee, Carleton College (on
the Investment Committee),
since 1987; Trustee, Carnegie
Endowment for International
Peace (on the Investment
Committee), since 2009
|
|
Name, Address,
Year of Birth
|
Position Held
With the Fund and
Length of Service
|
Principal Occupation(s)
During the Past Five Years
and Other Relevant
Professional Experience
|
Number of
Funds in the
Columbia Funds
Complex*
Overseen
|
Other Directorships
Held by Director
During the Past
Five Years and other
Relevant Board
Experience
|
|
Sandra L. Yeager
c/o Columbia Management
Investment Advisers, LLC
290 Congress Street
Boston, MA 02210
1964
|
Director since June
2020
|
Retired; President and founder, Hanoverian Capital,
LLC (SEC registered investment advisor firm),
2008-2016; Managing Director, DuPont Capital,
2006-2008; Managing Director, Morgan Stanley
Investment Management, 2004-2006; Senior Vice
President, Alliance Bernstein, 1990-2004
|
161
|
Former Director, NAPE
(National Alliance for
Partnerships in Equity)
Education Foundation, October
2016-October 2020; Advisory
Board, Jennersville YMCA, June
2022-June 2023
|
|
Name,
Address,
Year of Birth
|
Position Held
With the Fund and
Length of Service
|
Principal Occupation(s)
During the Past Five Years
and Other Relevant
Professional Experience
|
Number of
Funds in the
Columbia Funds
Complex*
Overseen
|
Other Directorships Held
by Director During the
Past Five Years
|
|
Daniel J. Beckman
c/o Columbia Management
Investment Advisers, LLC
290 Congress Street
Boston, MA 02210
1962
|
Director since
November 2021 and
President since June
2021
|
President and Principal Executive Officer of the
Columbia Funds, since June 2021; Vice President,
Columbia Management Investment Advisers, LLC,
since April 2015; formerly, Vice President – Head of
North America Product, Columbia Management
Investment Advisers, LLC, April 2015 – December
2023; President and Principal Executive Officer,
Columbia Acorn/Wanger Funds, since July 2021
|
161
|
Director, Ameriprise
Trust Company, since October
2016; Director, Columbia
Management Investment
Distributors, Inc., since
November 2018; Board of
Governors, Columbia Wanger
Asset Management, LLC, since
January 2022
|
|
*
|
The term “Columbia Funds Complex” as used herein includes Columbia Seligman Premium Technology Growth Fund, Tri-Continental Corporation and each series of Columbia Funds
Series Trust (CFST), Columbia Funds Series Trust I (CFST I), Columbia Funds Series Trust II (CFST II), Columbia ETF Trust
I (CET I), Columbia ETF Trust II (CET II), Columbia Funds
Variable Insurance Trust (CFVIT) and Columbia Funds Variable Series Trust II (CFVST II). Messrs. Batejan, Beckman, Gallagher,
Hacker and Moffett and Mses. Blatz, Carlton, Carrig,
Flynn, Paglia and Yeager serve as directors of Columbia Seligman Premium Technology Growth Fund and Tri-Continental Corporation.
|
|
**
|
Interested person (as defined under the 1940 Act) by reason of being an officer, director, security holder and/or employee
of the Investment Manager or Ameriprise Financial.
|
|
Name,
address and
year of birth
|
Position and year
first appointed to
position for any Fund
in the Columbia
Funds Complex or a
predecessor thereof
|
Principal occupation(s) during past five years
|
|
Michael G. Clarke
290 Congress Street
Boston, MA 02210
1969
|
Chief Financial Officer and
Principal Financial Officer
(2009); Senior Vice President
(2019); Treasurer and Chief
Accounting Officer (Principal
Accounting Officer) (2024) for
CFST, CFST I, CFST II, CFVIT
and CFVST II
|
Senior Vice President and North America Head of Operations & Investor Services, Columbia Management
Investment Advisers, LLC, since June 2023 (previously Senior Vice President and Head of Global
Operations, March 2022 – June 2023, Vice President, Head of North America Operations, and Co-Head of
Global Operations, June 2019 - February 2022 and Vice President – Accounting and Tax, May 2010 -
May 2019); senior officer of Columbia Funds and affiliated funds, since 2002. Director, Ameriprise Trust
Company, since June 2023.
|
|
Marybeth Pilat
290 Congress Street
Boston, MA 02210
1968
|
Treasurer and Chief
Accounting Officer (Principal
Accounting Officer) and
Principal Financial Officer
(2020) for CET I and CET II;
Assistant Treasurer, CFST,
CFST I, CFST II, CFVIT and
CFVST II
|
Vice President – Product Pricing and Administration, Columbia Management Investment Advisers, LLC,
since May 2017.
|
|
William F. Truscott
290 Congress Street
Boston, MA 02210
1960
|
Senior Vice President (2001)
|
Formerly, Trustee/Director of Columbia Funds Complex or legacy funds, November 2001 - January 1,
2021; Chief Executive Officer, Global Asset Management, Ameriprise Financial, Inc., since September
2012; Chairman of the Board and President, Columbia Management Investment Advisers, LLC, since July
2004 and February 2012, respectively; Chairman of the Board and Chief Executive Officer, Columbia
Management Investment Distributors, Inc., since November 2008 and February 2012, respectively;
Chairman of the Board and Director, TAM UK International Holdings Limited, since July 2021; formerly
Chairman of the Board and Director, Threadneedle Asset Management Holdings, Sàrl, March 2013 –
December 2022 and December 2008 – December 2022, respectively; senior executive of various entities
affiliated with Columbia Threadneedle Investments.
|
|
Christopher O. Petersen
5228 Ameriprise Financial Center
Minneapolis, MN 55474
1970
|
Senior Vice President and
Assistant Secretary (2021)
|
Formerly, Trustee/Director of funds within the Columbia Funds Complex, July 1, 2020 - November 22,
2021; Senior Vice President and Assistant General Counsel, Ameriprise Financial, Inc., since September
2021 (previously Vice President and Lead Chief Counsel, January 2015 - September 2021); formerly,
President and Principal Executive Officer of the Columbia Funds, 2015 - 2021; officer of Columbia Funds
and affiliated funds, since 2007.
|
|
Thomas P. McGuire
290 Congress Street
Boston, MA 02210
1972
|
Senior Vice President and
Chief Compliance Officer
(2012)
|
Vice President – Asset Management Compliance, Ameriprise Financial, Inc., since May 2010; Chief
Compliance Officer, Columbia Acorn/Wanger Funds, since December 2015; formerly, Chief Compliance
Officer, Ameriprise Certificate Company, September 2010 – September 2020.
|
|
Ryan C. Larrenaga
290 Congress Street
Boston, MA 02210
1970
|
Senior Vice President (2017),
Chief Legal Officer (2017),
and Secretary (2015)
|
Vice President and Chief Counsel, Ameriprise Financial, Inc., since August 2018 (previously Vice President
and Group Counsel, August 2011 - August 2018); Chief Legal Officer, Columbia Acorn/Wanger Funds,
since September 2020; officer of Columbia Funds and affiliated funds, since 2005.
|
|
Michael E. DeFao
290 Congress Street
Boston, MA 02210
1968
|
Vice President (2011) and
Assistant Secretary (2010)
|
Vice President and Chief Counsel, Ameriprise Financial, Inc., since May 2010; Vice President, Chief Legal
Officer and Assistant Secretary, Columbia Management Investment Advisers, LLC, since October 2021
(previously Vice President and Assistant Secretary, May 2010 – September 2021).
|
|
Name,
address and
year of birth
|
Position and year
first appointed to
position for any Fund
in the Columbia
Funds Complex or a
predecessor thereof
|
Principal occupation(s) during past five years
|
|
Lyn Kephart-Strong
5903 Ameriprise Financial Center
Minneapolis, MN 55474
1960
|
Vice President (2015)
|
Vice President, Global Investment Operations Services, Columbia Management Investment Advisers, LLC,
since 2010; President, Columbia Management Investment Services Corp., since October 2014; President,
Ameriprise Trust Company, since January 2017.
|
Item 2. Code of Ethics.
The registrant has adopted a code of ethics (the “Code”) that applies to the registrant’s principal executive officer, principal financial officer, principal accounting officer or controller, or persons performing similar functions, regardless of whether these individuals are employed by the registrant or a third party. During the period covered by this report, there were not any amendments to a provision of the Code that relates to any element of the code of ethics definition enumerated in paragraph (b) of Item 2 of Form N-CSR. During the period covered by this report, there were no waivers, including any implicit waivers, from a provision of the Code that relates to one or more of the items set forth in paragraph (b) of Item 2 of Form N-CSR. A copy of the Code is attached hereto.
Item 3. Audit Committee Financial Expert.
The registrant’s Board of Directors has determined that Brian J. Gallagher, Sandra L. Yeager, Douglas A. Hacker and David Moffett, each of whom are members of the registrant’s Board of Directors and Audit Committee, each qualify as an audit committee financial expert. Mr. Gallagher, Ms. Yeager, Mr. Hacker and Mr. Moffett are each independent directors, as defined in paragraph (a)(2) of this item’s instructions.
Item 4. Principal Accountant Fees and Services.
Fee information below is disclosed for the registrant whose report to stockholders is included in this annual filing.
(a) Audit Fees. Aggregate Audit Fees billed by the principal accountant for professional services rendered during the fiscal years ended December 31, 2023 and December 31, 2022 are approximately as follows:
|
2023 |
2022 |
|
$50,500 |
$49,500 |
Audit Fees include amounts related to the audit of the registrant’s annual financial statements or services that are normally provided by the accountant in connection with statutory and regulatory filings or engagements for those fiscal years.
(b) Audit-Related Fees. Aggregate Audit-Related Fees billed to the registrant by the principal accountant for professional services rendered during the fiscal years ended December 31, 2023 and December 31, 2022 are approximately as follows:
|
2023 |
2022 |
|
$0 |
$0 |
Audit-Related Fees, if any, include amounts for assurance and related services by the principal accountant that are reasonably related to the performance of the audit of the registrant’s financial statements and are not reported in Audit Fees above.
During the fiscal years ended December 31, 2023 and December 31, 2022, there were no Audit-Related Fees billed by the registrant’s principal accountant to the registrant’s investment adviser (not including any sub-adviser whose role is primarily portfolio management and is subcontracted with or overseen by another investment adviser) and any entity controlling, controlled by, or under common control with the adviser that provides ongoing services to the registrant for an engagement that related directly to the operations and financial reporting of the registrant.
(c) Tax Fees. Aggregate Tax Fees billed by the principal accountant to the registrant for professional services rendered during the fiscal years ended December 31, 2023 and December 31, 2022 are approximately as follows:
|
2023 |
2022 |
|
$12,900 |
$16,300 |
Tax Fees include amounts for the review of annual tax returns, the review of required shareholder distribution calculations and typically include amounts for professional services by the principal accountant for tax compliance, tax advice and tax planning.
During the fiscal years ended December 31, 2023 and December 31, 2022, there were no Tax Fees billed by the registrant’s principal accountant to the registrant’s investment adviser (not including any sub-adviser whose role is primarily portfolio management and is subcontracted with or overseen by another investment adviser) and any entity controlling, controlled by, or under common control with the adviser that provides ongoing services to the registrant for an engagement that related directly to the operations and financial reporting of the registrant.
(d) All Other Fees. Aggregate All Other Fees billed by the principal accountant to the registrant for professional services rendered during the fiscal years ended December 31, 2023 and December 31, 2022 are approximately as follows:
|
2023 |
2022 |
|
$0 |
$0 |
All Other Fees, if any, include amounts for products and services provided by the principal accountant, other than the services reported in paragraphs (a) through (c) above.
Aggregate All Other Fees billed by the registrant’s principal accountant to the registrant’s investment adviser (not including any sub-adviser whose role is primarily portfolio management and is subcontracted with or overseen by another investment adviser) and any entity controlling, controlled by, or under common control with the adviser that provides ongoing services to the registrant for an engagement that related directly to the operations and financial reporting of the registrant during the fiscal years ended December 31, 2023 and December 31, 2022 are approximately as follows:
|
2023 |
2022 |
|
$557,000 |
$535,000 |
In both fiscal years 2023 and 2022, All Other Fees primarily consist of fees billed for internal control examinations of the registrant’s transfer agent and investment adviser.
(e)(1) Audit Committee Pre-Approval Policies and Procedures
The registrant’s Audit Committee is required to pre-approve the engagement of the registrant’s independent auditors to provide audit and non-audit services to the registrant and non-audit services to its investment adviser (excluding any sub-adviser whose role is primarily portfolio management and is sub-contracted or overseen by another investment adviser (the “Adviser”) or any entity controlling, controlled by or under common control with the Adviser that provides ongoing services to the Fund (a “Control Affiliate”) if the engagement relates directly to the operations and financial reporting of the registrant.
The Audit Committee has adopted a Policy for Engagement of Independent Auditors for Audit and Non-Audit Services (the “Policy”). The Policy sets forth the understanding of the Audit Committee regarding the engagement of the registrant’s independent accountants to provide (i) audit and permissible audit-related, tax and other services to the registrant (“Fund Services”); (ii) non-audit services to the registrant’s Adviser and any Control Affiliates, that relates directly to the operations and financial reporting of a Fund (“Fund-related Adviser Services”); and (iii) certain other audit and non-audit services to the registrant’s Adviser and its Control Affiliates. A service will require specific pre-approval by the Audit Committee if it is to be provided by the Fund’s independent auditor; provided, however, that pre-approval of non-audit services to the Fund, the Adviser or Control Affiliates may be waived if certain de minimis requirements set forth in the SEC’s rules are met.
Under the Policy, the Audit Committee may delegate pre-approval authority to any pre-designated member or members who are independent board members. The member(s) to whom such authority is delegated must report, for informational purposes only, any pre-approval decisions to the Audit Committee at its next regular meeting. The Audit Committee's responsibilities with respect to the pre-approval of services performed by the independent auditor may not be delegated to management.
On an annual basis, at a regularly scheduled Audit Committee meeting, the Fund’s Treasurer or other Fund officer shall submit to the Audit Committee a schedule of the types of Fund Services and Fund-related Adviser Services that are subject to specific pre-approval. This schedule will provide a description of each type of service that is subject to specific pre-approval, along with total projected fees for each service. The pre-approval will generally cover a one-year period. The Audit Committee will review and approve the types of services and the projected fees for the next one-year period and may add to, or subtract from, the list of pre-approved services from time to time, based on subsequent determinations. This specific approval acknowledges that the Audit Committee is in agreement with the specific types of services that the independent auditor will be permitted to perform and the projected fees for each service.
The Fund’s Treasurer or other Fund officer shall report to the Audit Committee at each of its regular meetings regarding all Fund Services or Fund-related Adviser Services provided since the last such report was rendered, including a description of the services, by category, with forecasted fees for the annual reporting period, proposed changes requiring specific pre-approval and a description of services provided by the independent auditor, by category, with actual fees during the current reporting period.
*****
(e)(2) None, or 0%, of the Audit-Related Fees, Tax Fees and All Other Fees paid by the Fund or affiliated entities relating directly to the operations and financial reporting of the Registrant disclosed above were approved by the audit committee pursuant to paragraphs (c)(7)(i)(C) of Rule 2-01 of Regulation S-X (which permits audit committee approval after the start of the engagement with respect to services other than audit, review or attest services, if certain conditions are satisfied).
(f) Not applicable.
(g) The aggregate non-audit fees billed by the registrant’s accountant for services rendered to the registrant, and rendered to the registrant’s investment adviser (not including any sub-adviser whose role is primarily portfolio management and is subcontracted with or overseen by another investment adviser), and any entity controlling, controlled by, or under common control with the adviser that provides ongoing services to the registrant for the fiscal year ended December 31, 2023 and December 31, 2022 are approximately as follows:
|
2023 |
2022 |
|
$569,900 |
$551,300 |
(h) The registrant’s Audit Committee of the Board of Directors has considered whether the provision of non-audit services that were rendered to the registrant’s adviser (not including any sub-adviser whose role is primarily portfolio management and is subcontracted with or overseen by another investment adviser), and any entity controlling, controlled by, or under common control with the investment adviser that provides ongoing services to the registrant that were not pre-approved pursuant to paragraph (c)(7)(ii) of Rule 2-01 of Regulation S-X, is compatible with maintaining the principal accountant’s independence.
(i) Not applicable.
(j) Not applicable.
Item 5. Audit Committee of Listed Registrants.
|
(a) |
The registrant has a separately-designated standing audit committee established in accordance with Section 3(a)58)(A) of the Exchange Act (15 U.S.C. 78c(a)(58)(A). Brian J. Gallagher, Sandra L. Yeager, Douglas A. Hacker and David Moffett are each independent directors and collectively constitute the entire Audit Committee. |
|
(b) |
Not applicable |
Item 6. Investments
|
(a) |
The registrant’s “Schedule I – Investments in securities of unaffiliated issuers” (as set forth in 17 CFR 210.12-12) is included in Item 1 of this Form N-CSR. |
|
(b) |
Not applicable. |
Item 7. Disclosure of Proxy Voting Policies and Procedures for Closed-End Management Investment Companies.
Proxy Voting Policies and Procedures
General. The Funds have delegated to the Investment Manager the responsibility to vote proxies relating to portfolio securities held by the Funds, including Funds managed by subadvisers. In deciding to delegate this responsibility to the Investment Manager, the Board reviewed the policies adopted by the Investment Manager. These included the procedures that the Investment Manager follows when a vote presents a conflict between the interests of the Funds and their shareholders and the Investment Manager and its affiliates.
The Investment Manager’s policy is to vote all proxies for Fund securities in a manner considered by the Investment Manager to be in the best economic interests of its clients, including the Funds, without regard to any benefit or detriment to the Investment Manager, its employees or its affiliates. The best economic interests of clients is defined for this purpose as the interest of enhancing or protecting the value of client accounts, considered as a group rather than individually, as the Investment Manager determines in its discretion. The Investment Manager endeavors to vote all proxies of which it becomes aware prior to the vote deadline; provided, however, that in certain circumstances the Investment Manager may refrain from voting securities. For instance, the Investment Manager may refrain from voting foreign securities if it determines that the costs of voting outweigh the expected benefits of voting and typically will not vote securities if voting would impose trading restrictions.
The Board may, in its discretion, vote proxies for the Funds. For instance, the Board may determine to vote on matters that may present a material conflict of interest to the Investment Manager. In addition, the Board may instruct the Investment Manager to vote in accordance with guidelines approved by the Board.
Oversight.
The operation of the Investment Manager’s proxy voting policy and procedures is overseen by a group of representatives from the Investment Manager and its advisory affiliates. Oversight of the Investment Manager’s proxy voting is also provided by a committee within the Investment Manager comprised of portfolio managers and research analysts. The Board reviews on an annual basis, or more frequently as determined appropriate, the Investment Manager’s administration of the proxy voting process.
Corporate Governance and Proxy Voting Guidelines (the Guidelines). The Investment Manager has adopted the Guidelines, which set out voting stances on key issues and the broad principles shaping its approach, as well as the types of related voting action the Investment Manager may take. The Guidelines also provide indicative examples of key guidelines used in any given region, which illustrate the standards against which voting decisions are considered. The Investment Manager has developed voting stances that align with the Guidelines and will generally vote in accordance with such voting stances. The Investment Manager may determine to vote differently from the voting stances on particular proposals in the event it determines that doing so is in the clients’ best economic interests. The Investment Manager may consider the voting recommendations of analysts, portfolio managers, subadvisers and information obtained from outside resources, including one or more third party research providers. When proposals are not covered by the voting stances or a voting determination must be made on a case-by-case basis, a portfolio manager or analyst will make the voting determination based on his or her determination of the clients’ best economic interests.
Addressing Conflicts of Interest. The Investment Manager seeks to address potential material conflicts of interest by voting in accordance with predetermined voting stances. In addition, if the Investment Manager determines that a material conflict of interest exists, the Investment Manager will invoke one or more of the following conflict management practices: (i) causing the proxies to be voted in accordance with the recommendations of an independent third party (which may be the Investment Manager’s proxy voting administrator or research provider); (ii) causing the proxies to be delegated to an independent third party (which may be the Investment Manager’s proxy voting administrator or research provider); and (iii) in infrequent cases, forwarding the proxies to an Independent Director authorized to vote the proxies for the Funds. A member of the governing body responsible for overseeing proxy voting is prohibited from voting on any proposal for which he or she has a conflict of interest by reason of a direct relationship with the issuer or other party affected by a given proposal. Persons making recommendations are required to disclose any relationship with a party making a proposal or other matter known to the person that would create a potential conflict of interest.
Voting Proxies of Affiliated Underlying Funds. Certain Funds may invest in shares of other Columbia Funds (referred to in this context as “underlying funds”) and may own substantial portions of these underlying funds. If such Funds are in a master-feeder structure, the feeder fund will either seek instructions from its shareholders with regard to the voting of proxies with respect to the master fund’s shares and vote such proxies in accordance with such instructions or vote the shares held by it in the same proportion as the vote of all other master fund shareholders. With respect to Funds that hold shares of underlying funds other than in a master-feeder structure, the holding Funds will typically vote proxies of the underlying funds in the same proportion as the vote of all other holders of the underlying fund’s shares, unless the Board otherwise instructs.
Proxy Voting Agents. The Investment Manager has retained Institutional Shareholder Services Inc., a third-party vendor, as its proxy voting administrator to implement its proxy voting process and to provide recordkeeping and vote disclosure services. Typically, Institutional Shareholder Services Inc. populates ballots for issuers deemed to present potential material conflicts of interest in accordance with predetermined voting stances, as described above under Addressing Conflicts of Interest. The Investment Manager has retained both Institutional Shareholder Services Inc. and Glass Lewis & Company, LLC to provide proxy research services.
Additional Information. Information regarding how the Fund voted proxies relating to portfolio securities during the most recent twelve-month period ended June 30 will be available by August 31 of this year free of charge: (i) through the Columbia Funds’ website at columbiathreadneedleus.com and/or (ii) on the SEC’s website at www.sec.gov.
A copy of the current Guidelines is filed.
Item 8. Portfolio Managers of Closed-End Management Investment Companies.
Portfolio Managers
|
Portfolio Manager |
Title |
Role with the Corporation |
Managed the Corporation Since |
|
Paul Wick |
Portfolio Manager |
Lead Portfolio Manager |
2009 |
|
Braj Agrawal |
Portfolio Manager |
Co-Portfolio Manager |
2010 |
|
Jeetil Patel |
Portfolio Manager |
Technology Team Member |
2015 |
|
Christopher Boova |
Portfolio Manager |
Co-Portfolio Manager |
2016 |
|
Vimal Patel |
Portfolio Manager |
Technology Team Member |
2018 |
|
Shekhar Pramanick |
Portfolio Manager |
Technology Team Member |
2018 |
Mr. Wick joined one of the Columbia Management legacy firms or acquired business lines in 1987. Mr. Wick is Team Leader and Portfolio Manager for the Columbia Seligman Technology strategies. Mr. Wick began his investment career in 1987 and earned a B.A. from Duke and an M.B.A. from Duke’s Fuqua School of Business.
Mr. Agrawal joined one of the Columbia Management legacy firms or acquired business lines in 2010. Mr. Agrawal began his investment career in 2001 and earned a B.A. in Economics from the University of Illinois at Urbana-Champaign and an M.B.A. from University of Minnesota’s Carlson School.
Mr. Jeetil Patel joined the Investment Manager in 2012. Mr. Patel began his investment career in 1998 and earned a B.A. from University of California, Los Angeles.
Mr. Boova joined one of the Columbia Management legacy firms or acquired business lines in 2000. Mr. Boova began his investment career in 1995 and earned two B.S. degrees from Worcester Polytechnic Institute, an M.A. from Georgetown University and an M.B.A. from the Wharton School at the University of Pennsylvania.
Dr. Pramanick joined the Investment Manager in 2012. Dr. Pramanick began his investment career in 1993 and earned a B.S. from the National Institute of Technology, an M.S. from the University of Oregon and a Ph.D. from North Carolina State University.
Mr. Vimal Patel joined the Investment Manager in 2014. Mr. Patel began his investment career in 2001 and earned a B.S. from North Carolina State University, an M.S. from the University of Colorado, Boulder, and an M.B.A. from the Anderson School of Management at the University of California, Los Angeles.
Other Accounts Managed by the Portfolio Managers:
|
Fund |
Portfolio Manager |
Other Accounts Managed |
Performance Based Accounts** |
Ownership of Fund Shares |
|
|
Number and type of account* |
Approximate Total Net Assets (excluding the fund) |
||||
|
For fiscal period ending December 31, 2022, unless otherwise noted |
|||||
|
Columbia Seligman Premium Technology Growth |
Paul Wick |
4 RICs 3 PIVs 8 Other accounts |
$13.82 billion $1.94 billion $1.73 billion |
2 PIVs -$998.01M 1 Other Account – $182.78M |
None |
|
Braj Agrawal |
15 Other accounts |
$1.45 million |
None |
None |
|
|
Jeetil Patel |
1 RIC 10 Other accounts |
$11.50 billion $6.54 million |
None |
None |
|
|
Christopher Boova |
2 RICs 6 Other accounts |
$2.28 billion $6.77 million |
None |
None |
|
|
Vimal Patel |
3 RICs 8 Other accounts |
$13.79 billion $6.36 million |
None |
None |
|
|
Shekhar Pramanick |
4 RICs 6 Other accounts |
$13.82 billion $14.05 million |
None |
None |
|
* RIC refers to a Registered Investment Company
** Number and type of accounts for which the advisory fee paid is based in part or wholly on performance and the aggregate net assets in those accounts.
Potential Conflicts of Interest:
Columbia Management: Like other investment professionals with multiple clients, a Fund’s portfolio manager(s) may face certain potential conflicts of interest in connection with managing both the Fund and other accounts at the same time. The Investment Manager and the Funds have adopted compliance policies and procedures that attempt to address certain of the potential conflicts that portfolio managers face in this regard. Certain of these conflicts of interest are summarized below.
The management of funds or other accounts with different advisory fee rates and/or fee structures, including accounts, such as the Investment Manager’s hedge funds, that pay advisory fees based on account performance (performance fee accounts), may raise potential conflicts of interest for a portfolio manager by creating an incentive to favor accounts that pay higher fees, including performance fee accounts, such that the portfolio manager may have an incentive to allocate attractive investments disproportionately to performance fee accounts.
Similar conflicts of interest also may arise when a portfolio manager has personal investments in other accounts that may create an incentive to favor those accounts. When the Investment Manager determines it necessary or appropriate in order to ensure compliance with restrictions on joint transactions under the 1940 Act, a Fund may not be able to invest in privately-placed securities in which other accounts advised by the Investment Manager using a similar style, including performance fee accounts, are able to invest, even when the Investment Manager believes such securities would otherwise represent attractive investment opportunities. As a general matter and subject to the Investment Manager’s Code of Ethics and certain limited exceptions, including for investments in the Investment Manager’s hedge funds, the Investment Manager’s investment professionals do not have the opportunity to invest in client accounts, other than the Funds.
A portfolio manager who is responsible for managing multiple funds and/or accounts may devote unequal time and attention to the management of those Funds and/or accounts. The effects of this potential conflict may be more pronounced where Funds and/or accounts managed by a particular portfolio manager have different investment strategies.
A portfolio manager may be able to select or influence the selection of the broker/dealers that are used to execute securities transactions for the Funds. A portfolio manager’s decision as to the selection of broker/dealers could produce disproportionate costs and benefits among the Funds and the other accounts the portfolio manager manages.
A potential conflict of interest may arise when a portfolio manager buys or sells the same securities for a Fund and other accounts. On occasions when a portfolio manager considers the purchase or sale of a security to be in the best interests of a Fund as well as other accounts, the Investment Manager’s trading desk may, to the extent consistent with applicable laws and regulations, aggregate the securities to be sold or bought in order to obtain the best execution and lower brokerage commissions, if any. Aggregation of trades may create the potential for unfairness to a Fund or another account if a portfolio manager favors one account over another in allocating the securities bought or sold. The Investment Manager and its Participating Affiliates may coordinate their trading operations for certain types of securities and transactions pursuant to personnel-sharing agreements or similar intercompany arrangements. However, typically the Investment Manager does not coordinate trading activities with a Participating Affiliate with respect to accounts of that Participating Affiliate unless such Participating Affiliate is also providing trading services for accounts managed by the Investment Manager. Similarly, a Participating Affiliate typically does not coordinate trading activities with the Investment Manager with respect to accounts of the Investment Manager unless the Investment Manager is also providing trading services for accounts managed by such Participating Affiliate. As a result, it is possible that the Investment Manager and its Participating Affiliates may trade in the same instruments at the same time, in the same or opposite direction or in different sequence, which could negatively impact the prices paid by the Fund on such instruments. Additionally, in circumstances where trading services are being provided on a coordinated basis for the Investment Manager’s accounts (including the Funds) and the accounts of one or more Participating Affiliates in accordance with applicable law, it is possible that the allocation opportunities available to the Funds may be decreased, especially for less actively traded securities, or orders may take longer to execute, which may negatively impact Fund performance.
“Cross trades,” in which a portfolio manager sells a particular security held by a Fund to another account (potentially saving transaction costs for both accounts), could involve a potential conflict of interest if, for example, a portfolio manager is permitted to sell a security from one account to another account at a higher price than an independent third party would pay. The Investment Manager and the Funds have adopted compliance procedures that provide that any transactions between a Fund and another account managed by the Investment Manager are to be made at a current market price, consistent with applicable laws and regulations.
Another potential conflict of interest may arise based on the different investment objectives and strategies of a Fund and other accounts managed by its portfolio manager(s). Depending on another account’s objectives and other factors, a portfolio manager may give advice to and make decisions for a Fund that may differ from advice given, or the timing or nature of decisions made, with respect to another account. A portfolio manager’s investment decisions are the product of many factors in addition to basic suitability for the particular account involved. Thus, a portfolio manager may buy or sell a particular security for certain accounts, and not for a Fund, even though it could have been bought or sold for the Fund at the same time. A portfolio manager also may buy a particular security for one or more accounts when one or more other accounts are selling the security (including short sales). There may be circumstances when a portfolio manager’s purchases or sales of portfolio securities for one or more accounts may have an adverse effect on other accounts, including the Funds.
To the extent a Fund invests in underlying funds, a portfolio manager will be subject to additional potential conflicts of interest. Because of the structure of funds-of-funds, the potential conflicts of interest for the portfolio managers may be different than the potential conflicts of interest for portfolio managers who manage other Funds. The Investment Manager and its affiliates may receive higher compensation as a result of allocations to underlying funds with higher fees.
A Fund’s portfolio manager(s) also may have other potential conflicts of interest in managing the Fund, and the description above is not a complete description of every conflict that could exist in managing the Fund and other accounts. Many of the potential conflicts of interest to which the Investment Manager’s portfolio managers are subject are essentially the same or similar to the potential conflicts of interest related to the investment management activities of the Investment Manager and its affiliates.
In addition, a portfolio manager’s responsibilities may include working as a securities analyst. This dual role may give rise to conflicts with respect to making investment decisions for accounts that he/she manages versus communicating his/her analyses to other portfolio managers concerning securities that he/she follows as an analyst.
Structure of Compensation:
Portfolio manager compensation is typically comprised of (i) a base salary and (ii) an annual cash bonus. The annual cash bonus, and in most instances the base salary, are paid from a team compensation pool that is based on fees and performance of the accounts managed by the portfolio management team, which might include mutual funds, wrap accounts, institutional portfolios and hedge funds.
The percentage of management fees on mutual funds that fund the bonus pool is based on the short term (typically one-year) and long-term (typically three-year and five-year) performance of those accounts in relation to the relevant peer group universe.
The pool is also funded by a percentage of the management fees on long-only institutional separate accounts, that percentage being based on the source of the account in question, and by a fixed percentage of management fees on hedge funds and separately managed accounts that follow a hedge fund mandate.
The percentage of performance fees on hedge funds and separately managed accounts that follow a hedge fund mandate that fund the bonus pool is based on the absolute level of each hedge fund’s current year investment return.
For all employees the benefit programs generally are the same and are competitive within the financial services industry. Employees participate in a wide variety of plans, including options in Medical, Dental, Vision, Health Care and Dependent Spending Accounts, Life Insurance, Long Term Disability Insurance, 401(k), and a cash balance pension plan.
Item 9. Purchases of Equity Securities by Closed-End Management Investment Company and Affiliated Purchasers.
(1) For the year ended December 31, 2023, under the terms of its stock repurchase program, the registrant did not repurchase any of its shares of common stock.
(2a) The registrant's current stock repurchase program, which is reviewed at least annually by the registrant’s Board of Directors, was first approved by the registrant’s Board of Directors in 2009.
(2b) Provided that the criteria for share repurchases are met under the registrant’s stock repurchase program, there is no limit to the number of shares the registrant can repurchase.
(2c) The registrant’s stock repurchase program has no expiration date.
(2d) Not applicable
(2d) Not applicable
Item 10. Submission of Matters to a Vote of Security Holders.
There were no material changes to the procedures by which shareholders may recommend nominees to the registrant's board of directors.
Item 11. Controls and Procedures.
|
(a) |
The registrant’s principal executive officer and principal financial officer, based on their evaluation of the registrant’s disclosure controls and procedures as of a date within 90 days of the filing of this report, have concluded that such controls and procedures are adequately designed to ensure that information required to be disclosed by the registrant in Form N-CSR is accumulated and communicated to the registrant’s management, including the principal executive officer and principal financial officer, or persons performing similar functions, as appropriate to allow timely decisions regarding required disclosure. |
|
(b) |
There was no change in the registrant’s internal control over financial reporting that occurred during the period covered by this report that has materially affected, or is reasonably likely to materially affect, the registrant’s internal control over financial reporting. |
Item 12. Disclosure of Securities Lending Activities for Closed-End Management Investment Companies
Not applicable.
Item 13. Recovery of Erroneously Awarded Compensation.
Not applicable.
Item 14. Exhibits.
(a)(1) Code of ethics required to be disclosed under Item 2 of Form N-CSR attached hereto as Exhibit 99.CODE ETH.
(a)(2) Certifications pursuant to Rule 30a-2(a) under the Investment Company Act of 1940 (17 CFR 270.30a-2(a)) attached hereto as Exhibit 99.CERT.
(b) Certification pursuant to Rule 30a-2(b) under the Investment Company Act of 1940 (17 CFR 270.30a-2(b)) attached hereto as Exhibit 99.906CERT.
(c) Corporate Governance and Proxy Voting Guidelines
SIGNATURES
Pursuant to the requirements of the Securities Exchange Act of 1934 and the Investment Company Act of 1940, the registrant has duly caused this report to be signed on its behalf by the undersigned, thereunto duly authorized.
|
(registrant) |
Columbia Seligman Premium Technology Growth Fund, Inc |
|
|
|
|
By (Signature and Title) |
/s/ Daniel J. Beckman |
|
|
Daniel J. Beckman, President and Principal Executive Officer |
|
|
|
|
Date |
February 22, 2024 |
|
|
|
|
|
|
Pursuant to the requirements of the Securities Exchange Act of 1934 and the Investment Company Act of 1940, this report has been signed below by the following persons on behalf of the registrant and in the capacities and on the dates indicated.
|
By (Signature and Title) |
/s/ Daniel J. Beckman |
|
|
Daniel J. Beckman, President and Principal Executive Officer |
|
|
|
|
Date |
February 22, 2024 |
|
By (Signature and Title) |
/s/ Michael G. Clarke |
|
|
Michael G. Clarke, Chief Financial Officer, |
|
|
Principal Financial Officer and Senior Vice President |
|
|
|
|
Date |
February 22, 2024 |
|
By (Signature and Title) |
/s/ Joseph Beranek |
|
|
Joseph Beranek, Treasurer, Chief Accounting |
|
|
Officer and Principal Financial Officer |
|
|
|
|
Date |
February 22, 2024 |
CERTIFICATION PURSUANT TO SECTION 906 OF
THE SARBANES-OXLEY ACT OF 2002
In connection with the Certified Shareholder Report of Columbia Seligman Premium Technology Growth Fund, Inc (the “Trust”) on Form N-CSR for the period ending December 31, 2023 as filed with the Securities and Exchange Commission on the date hereof (“the Report”), the undersigned hereby certifies that, to his knowledge:
1. The Report fully complies with the requirements of Section 13(a) or 15(d) of the Securities Exchange Act of 1934; and
2. The information contained in the Report fairly presents, in all material respects, the financial condition and results of operations of the Trust.
|
Date: February 22, 2024 |
/s/ Daniel J. Beckman |
|
|
Daniel J. Beckman, President and Principal Executive Officer |
|
Date: February 22, 2024 |
/s/ Michael G. Clarke |
|
|
Michael G. Clarke, Chief Financial Officer, |
|
|
Principal Financial Officer and Senior Vice President |
|
Date: February 22, 2024 |
/s/ Joseph Beranek |
|
|
Joseph Beranek, Treasurer, Chief Accounting |
|
|
Officer and Principal Financial Officer |
A signed original of this written statement required by Section 906 of the Sarbanes-Oxley Act of 2002 has been provided to the Registrant and will be retained by the Registrant and furnished to the Securities and Exchange Commission (the “Commission”) or its staff upon request.
This certification is being furnished to the Commission solely pursuant to 18 U.S.C. §1350 and is not being filed as part of the Form N-CSR with the Commission.

Dear Stockholder,
On August 22, 2023 (the Payment Date), pursuant to its managed distribution policy, Columbia Seligman Premium Technology Growth Fund, Inc. (NYSE: STK) (the Fund) paid a distribution in the amount of $0.4625 per share of common stock to stockholders of record on August 14, 2023, which is equal to a quarterly rate of 2.3125% (9.25% annualized) of the $20.00 offering price in the Fund’s initial public offering in November 2009. The third-quarter distribution of $0.4625 per share is equal to a quarterly rate of 1.49% (5.96% annualized) of the Fund’s market price of $31.04 per share as of July 31, 2023.
Prior to the managed distribution policy, the Fund paid distributions pursuant to a level rate distribution policy. Under its former distribution policy and consistent with the Investment Company Act of 1940, as amended, the Fund could not distribute long-term capital gains, as defined in the Internal Revenue Code of 1986, more often than once in any one taxable year.
In October 2010, the Fund received exemptive relief from the Securities and Exchange Commission that permits the Fund to distribute long-term capital gains more often than once in any one taxable year. After consideration by the Fund’s Board, the Fund adopted the current managed distribution policy which allows the Fund to make distributions of long-term capital gains more than once in any taxable year.
The following table sets forth the estimated breakdown of the distribution noted above, on a per share basis, from the following sources: net investment income; net realized short-term capital gains; net realized long-term capital gains; and return of capital or other capital source.
|
|
Breakdown of Distribution |
|
|
Sources |
% |
US Dollar |
|
Net Investment Income |
0.00% |
$0.0000 |
|
Net Realized Short-Term Capital Gains |
0.00% |
$0.0000 |
|
Net Realized Long-Term Capital Gains |
30.44% |
$0.1408 |
|
Return of Capital or other Capital Source |
69.56% |
$0.3217 |
|
Total |
100.00% |
$0.4625 |
The following table sets forth the estimated breakdown, on a per share basis, of all distributions made by the Fund during the year-to-date period ended on the Payment Date of the above distribution (includes the distribution payment noted in the table above) from the following sources: net investment income; net realized short-term capital gains; net realized long-term capital gains; and return of capital or other capital source.
|
|
Breakdown of All Distributions Paid Through |
|
|
Sources |
% |
US Dollar |
|
Net Investment Income |
0.00% |
$0.0000 |
|
Net Realized Short-Term Capital Gains |
4.11% |
$0.0571 |
|
Net Realized Long-Term Capital Gains |
72.70% |
$1.0087 |
|
Return of Capital or other Capital Source |
23.19% |
$0.3217 |
|
Total |
100.00% |
$1.3875 |
As of the payment date of the current distribution, the Fund estimates that it has distributed more than its income and net realized capital gains. Therefore, all or a portion of your distribution may be a return of capital or other capital source. A return of capital may occur, for example, when some or all of the money that you invested in the Fund is paid back to you. A return of capital distribution does not necessarily reflect the Fund’s investment performance and should not be confused with “yield” or “income.” This could change during the remainder of the year, as further described below.
The amounts, sources and percentage breakdown of the distributions reported in this Notice are only estimates and are not being provided for, and should not be used for, tax reporting purposes. The actual amounts, sources and percentage breakdown of the distribution for tax reporting purposes, which may include return of capital, will depend upon the Fund’s investment experience during the remainder of its fiscal year and may be subject to changes based on tax regulations.
The following table sets forth (i) the average annual total return of a share of the Fund’s common stock at net asset value (NAV) for the 5-year period ended July 31, 2023, and (ii) the Fund’s annualized distribution rate, for the same period, expressed as a percentage of the NAV price of a share of the Fund’s common stock at July 31, 2023.
|
Average Annual Total NAV Return for the 5-year Period Ended July 31, 2023
|
17.08% |
|
Annualized Distribution Rate as a Percentage of July 31, 2023 NAV Price |
7.36%
|
The following table sets forth (i) the average annual total return of a share of the Fund’s common stock at net asset value (NAV) for the period since inception of Fund investment operations through the period noted and (ii) the Fund’s annualized distribution rate, for the same period, expressed as a percentage of the NAV price of a share of the Fund’s common stock at July 31, 2023. Average annual total return of a share of the Fund’s common stock at NAV for the period since inception of Fund investment operations through the period noted includes the 4.50% sales load assessed to IPO investors.
|
Average Annual Total NAV Return for the Period Since Inception of Investment Operations (November 30, 2009) Through July 31, 2023
|
14.41% |
|
Annualized Distribution Rate as a Percentage of July 31, 2023 NAV Price
|
6.85%
|
The following table sets forth (i) the cumulative total return (at NAV) of a share of the Fund’s common stock for the year-to-date period ended July 31, 2023 and (ii) the Fund’s distribution rate, for the same period, expressed as a percentage of the NAV price of a share of the Fund’s common stock at July 31, 2023.
|
Cumulative Total NAV Return for the Year-to-Date Period Ended July 31, 2023
|
32.86% |
|
|
Distribution Rate as a Percentage of July 31, 2023 NAV Price |
3.19% |
|
Past performance does not guarantee future results.
You should not draw any conclusions about the Fund’s investment performance from the amount of the distributions noted in the tables above or from the terms of the Fund’s distribution policy.
The Fund or your financial professional will send you a Form 1099-DIV for the calendar year that will tell you how to report these distributions on your US federal income tax return. For tax purposes, the Fund is required to report unrealized gains or losses on certain non-US investments as ordinary income or loss, respectively. Accordingly, the amount of the Fund’s total distributions that will be taxable as ordinary income may be different than the amount of the distributions from net investment income reported above.
The Board may change the Fund’s distribution policy and the amount or timing of the distributions, based on a number of factors, including, but not limited to, the amount of the Fund’s undistributed net investment income and net short- and long-term capital gains and historical and projected net investment income and net short- and long-term capital gains.
Investors should consider the investment objectives, risks, charges, and expenses of the Fund carefully before investing. You can obtain the Fund's most recent periodic reports and other regulatory filings by contacting your financial advisor or visiting www.columbiathreadneedleus.com. These reports and other filings can also be found on the Securities and Exchange Commission's EDGAR Database. You should read these reports and other filings carefully before investing.
The Fund expects to receive all or some of its current income and gains from the following sources: (i) dividends received by the Fund that are paid on the equity and equity-related securities in its portfolio; and (ii) capital gains (short-term and long-term) from option premiums and the sale of portfolio securities. It is possible that the Fund’s distributions will at times exceed the earnings and profits of the Fund and therefore all or a portion of such distributions may constitute a return of capital as described below. A return of capital is a return of your original investment. A return of capital distribution does not necessarily reflect the Fund’s investment performance and should not be confused with “yield” or “income.” You should not draw any conclusions about the Fund’s investment performance from the amount of this distribution or from the Fund’s distribution policy.
Distributions that qualify as a return of capital are a return of some or all of your original investment in the Fund. A return of capital reduces a stockholder’s tax basis in his or her shares. Once the tax basis in your shares has been reduced to zero, any further return of capital may be taxable as capital gain. Shareholders should consult their tax advisor or tax attorney for proper treatment.
Distributions may be variable, and the Fund’s distribution rate will depend on a number of factors, including the net earnings on the Fund’s portfolio investments and the rate at which such net earnings change as a result of changes in the timing of, and rates at which, the Fund receives income from the sources noted above. As portfolio and market conditions change, the rate of distributions on the shares and the Fund’s distribution policy could change.
The Fund's use of derivatives introduces risks possibly greater than the risks associated with investing directly in the investments underlying the derivatives. A relatively small price movement in an underlying investment may result in a substantial gain or loss.
The Fund should only be considered as one element of a complete investment program. An investment in the Fund should be considered speculative. The Fund's investment policy of investing in technology and technology-related companies and writing call options involves a high degree of risk.
There is no assurance that the Fund will meet its investment objectives or that distributions will be made. You could lose some or all of your investment. In addition, closed-end funds frequently trade at a discount to their net asset values, which may increase your risk of loss.
The market prices of technology and technology-related stocks tend to exhibit a greater degree of market risk and price volatility than other types of investments. These stocks may fall in and out of favor with investors rapidly, which may cause sudden selling and dramatically lower market prices. These stocks also may be affected adversely by changes in technology, consumer and business purchasing patterns, government regulation and/or obsolete products or services. Technology and technology-related companies are often smaller and less experienced companies and may be subject to greater risks than larger companies, such as limited product lines, markets and financial and managerial resources. These risks may be heightened for technology companies in foreign markets.
The Fund is not insured by the FDIC, NCUA or any federal agency, is not a deposit or obligation of, or guaranteed by any financial institution, and involves investment risks including possible loss of principal and fluctuation in value.
Columbia Seligman Premium Technology Growth Fund is managed by Columbia Management Investment Advisers, LLC. This material is distributed by Columbia Management Investment Distributors, Inc., member FINRA.
Columbia Threadneedle Investments (Columbia Threadneedle) is the global brand name of the Columbia and Threadneedle group of companies.
All rights reserved. Columbia Management Investment Distributors, Inc., 290 Congress Street, Boston, MA 02210
© 2023 Columbia Management Investment Advisers, LLC
columbiathreadneedleus.com
Adtrax 5849649

Dear Stockholder,
On November 21, 2023 (the Payment Date), pursuant to its managed distribution policy, Columbia Seligman Premium Technology Growth Fund, Inc. (NYSE: STK) (the Fund) paid a distribution in the amount of $0.4625 per share of common stock to stockholders of record on November 13, 2023, which is equal to a quarterly rate of 2.3125% (9.25% annualized) of the $20.00 offering price in the Fund’s initial public offering in November 2009. The fourth-quarter distribution of $0.4625 per share is equal to a quarterly rate of 1.8194% (7.28% annualized) of the Fund’s market price of $25.42 per share as of October 31, 2023.
Prior to the managed distribution policy, the Fund paid distributions pursuant to a level rate distribution policy. Under its former distribution policy and consistent with the Investment Company Act of 1940, as amended, the Fund could not distribute long-term capital gains, as defined in the Internal Revenue Code of 1986, more often than once in any one taxable year.
In October 2010, the Fund received exemptive relief from the Securities and Exchange Commission that permits the Fund to distribute long-term capital gains more often than once in any one taxable year. After consideration by the Fund’s Board, the Fund adopted the current managed distribution policy which allows the Fund to make distributions of long-term capital gains more than once in any taxable year.
The following table sets forth the estimated breakdown of the distribution noted above, on a per share basis, from the following sources: net investment income; net realized short-term capital gains; net realized long-term capital gains; and return of capital or other capital source.
|
|
Breakdown of Distribution |
|
|
Sources |
% |
US Dollar |
|
Net Investment Income |
0.00% |
$0.0000 |
|
Net Realized Short-Term Capital Gains |
0.00% |
$0.0000 |
|
Net Realized Long-Term Capital Gains |
100.00% |
$0.4625 |
|
Return of Capital or other Capital Source |
0.00% |
$0.0000 |
|
Total |
100.00% |
$0.4625 |
The following table sets forth the estimated breakdown, on a per share basis, of all distributions made by the Fund during the year-to-date period ended on the Payment Date of the above distribution (includes the distribution payment noted in the table above) from the following sources: net investment income; net realized short-term capital gains; net realized long-term capital gains; and return of capital or other capital source.
|
|
Breakdown of All Distributions Paid Through |
|
|
Sources |
% |
US Dollar |
|
Net Investment Income |
0.00% |
$0.0000 |
|
Net Realized Short-Term Capital Gains |
3.09% |
$0.0571 |
|
Net Realized Long-Term Capital Gains |
96.91% |
$1.7929 |
|
Return of Capital or other Capital Source |
0.00% |
$0.0000 |
|
Total |
100.00% |
$1.8500 |
In certain years since the Fund’s inception, the Fund has distributed more than its income and net realized capital gains, which has resulted in Fund distributions substantially consisting of return of capital or other capital source. A return of capital may occur, for example, when some or all of the money that you invested in the Fund is paid back to you. A return of capital distribution does not necessarily reflect the Fund’s investment performance and should not be confused with “yield” or “income.” As of the payment date of the current distribution, all Fund distributions paid in 2023 (as estimated by the Fund based on current information) are from the earnings and profits of the Fund and not a return of capital. This could change during the remainder of the year, as further described below.
The amounts, sources and percentage breakdown of the distributions reported in this Notice are only estimates and are not being provided for, and should not be used for, tax reporting purposes. The actual amounts, sources and percentage breakdown of the distribution for tax reporting purposes, which may include return of capital, will depend upon the Fund’s investment experience during the remainder of its fiscal year and may be subject to changes based on tax regulations.
The following table sets forth (i) the average annual total return of a share of the Fund’s common stock at net asset value (NAV) for the 5-year period ended October 31, 2023, and (ii) the Fund’s annualized distribution rate, for the same period, expressed as a percentage of the NAV price of a share of the Fund’s common stock at October 31, 2023.
|
Average Annual Total NAV Return for the 5-year Period Ended October 31, 2023
|
15.99% |
|
Annualized Distribution Rate as a Percentage of October 31, 2023 NAV Price |
8.48%
|
The following table sets forth (i) the average annual total return of a share of the Fund’s common stock at net asset value (NAV) for the period since inception of Fund investment operations through the period noted and (ii) the Fund’s annualized distribution rate, for the same period, expressed as a percentage of the NAV price of a share of the Fund’s common stock at October 31, 2023. Average annual total return of a share of the Fund’s common stock at NAV for the period since inception of Fund investment operations through the period noted includes the 4.50% sales load assessed to IPO investors.
|
Average Annual Total NAV Return for the Period Since Inception of Investment Operations (November 30, 2009) Through October 31, 2023
|
13.11% |
|
Annualized Distribution Rate as a Percentage of October 31, 2023 NAV Price
|
7.88%
|
The following table sets forth (i) the cumulative total return (at NAV) of a share of the Fund’s common stock for the year-to-date period ended October 31, 2023 and (ii) the Fund’s distribution rate, for the same period, expressed as a percentage of the NAV price of a share of the Fund’s common stock at October 31, 2023.
|
Cumulative Total NAV Return for the Year-to-Date Period Ended October 31, 2023
|
17.23% |
|
|
Distribution Rate as a Percentage of October 31, 2023 NAV Price |
5.51% |
|
Past performance does not guarantee future results.
You should not draw any conclusions about the Fund’s investment performance from the amount of the distributions noted in the tables above or from the terms of the Fund’s distribution policy.
The Fund or your financial professional will send you a Form 1099-DIV for the calendar year that will tell you how to report these distributions on your US federal income tax return. For tax purposes, the Fund is required to report unrealized gains or losses on certain non-US investments as ordinary income or loss, respectively. Accordingly, the amount of the Fund’s total distributions that will be taxable as ordinary income may be different than the amount of the distributions from net investment income reported above.
The Board may change the Fund’s distribution policy and the amount or timing of the distributions, based on a number of factors, including, but not limited to, the amount of the Fund’s undistributed net investment income and net short- and long-term capital gains and historical and projected net investment income and net short- and long-term capital gains.
Investors should consider the investment objectives, risks, charges, and expenses of the Fund carefully before investing. You can obtain the Fund's most recent periodic reports and other regulatory filings by contacting your financial advisor or visiting www.columbiathreadneedleus.com. These reports and other filings can also be found on the Securities and Exchange Commission's EDGAR Database. You should read these reports and other filings carefully before investing.
The Fund expects to receive all or some of its current income and gains from the following sources: (i) dividends received by the Fund that are paid on the equity and equity-related securities in its portfolio; and (ii) capital gains (short-term and long-term) from option premiums and the sale of portfolio securities. It is possible that the Fund’s distributions will at times exceed the earnings and profits of the Fund and therefore all or a portion of such distributions may constitute a return of capital as described below. A return of capital is a return of your original investment. A return of capital distribution does not necessarily reflect the Fund’s investment performance and should not be confused with “yield” or “income.” You should not draw any conclusions about the Fund’s investment performance from the amount of this distribution or from the Fund’s distribution policy.
Distributions that qualify as a return of capital are a return of some or all of your original investment in the Fund. A return of capital reduces a stockholder’s tax basis in his or her shares. Once the tax basis in your shares has been reduced to zero, any further return of capital may be taxable as capital gain. Shareholders should consult their tax advisor or tax attorney for proper treatment.
Distributions may be variable, and the Fund’s distribution rate will depend on a number of factors, including the net earnings on the Fund’s portfolio investments and the rate at which such net earnings change as a result of changes in the timing of, and rates at which, the Fund receives income from the sources noted above. As portfolio and market conditions change, the rate of distributions on the shares and the Fund’s distribution policy could change.
The Fund's use of derivatives introduces risks possibly greater than the risks associated with investing directly in the investments underlying the derivatives. A relatively small price movement in an underlying investment may result in a substantial gain or loss.
The Fund should only be considered as one element of a complete investment program. An investment in the Fund should be considered speculative. The Fund's investment policy of investing in technology and technology-related companies and writing call options involves a high degree of risk.
There is no assurance that the Fund will meet its investment objectives or that distributions will be made. You could lose some or all of your investment. In addition, closed-end funds frequently trade at a discount to their net asset values, which may increase your risk of loss.
The market prices of technology and technology-related stocks tend to exhibit a greater degree of market risk and price volatility than other types of investments. These stocks may fall in and out of favor with investors rapidly, which may cause sudden selling and dramatically lower market prices. These stocks also may be affected adversely by changes in technology, consumer and business purchasing patterns, government regulation and/or obsolete products or services. Technology and technology-related companies are often smaller and less experienced companies and may be subject to greater risks than larger companies, such as limited product lines, markets and financial and managerial resources. These risks may be heightened for technology companies in foreign markets.
The Fund is not insured by the FDIC, NCUA or any federal agency, is not a deposit or obligation of, or guaranteed by any financial institution, and involves investment risks including possible loss of principal and fluctuation in value.
Columbia Seligman Premium Technology Growth Fund is managed by Columbia Management Investment Advisers, LLC. This material is distributed by Columbia Management Investment Distributors, Inc., member FINRA.
Columbia Threadneedle Investments (Columbia Threadneedle) is the global brand name of the Columbia and Threadneedle group of companies.
All rights reserved. Columbia Management Investment Distributors, Inc., 290 Congress Street, Boston, MA 02210
© 2023 Columbia Management Investment Advisers, LLC
columbiathreadneedleus.com
Adtrax 6064358
1 Year Columbia Seligman Premiu... Chart |
1 Month Columbia Seligman Premiu... Chart |

It looks like you are not logged in. Click the button below to log in and keep track of your recent history.
Support: +44 (0) 203 8794 460 | support@advfn.com
By accessing the services available at ADVFN you are agreeing to be bound by ADVFN's Terms & Conditions
 Hot Features