
We could not find any results for:
Make sure your spelling is correct or try broadening your search.
| Share Name | Share Symbol | Market | Type |
|---|---|---|---|
| Royal Bank of Canada | NYSE:RY | NYSE | Common Stock |
| Price Change | % Change | Share Price | High Price | Low Price | Open Price | Shares Traded | Last Trade | |
|---|---|---|---|---|---|---|---|---|
| 1.95 | 1.97% | 101.17 | 101.31 | 99.99 | 100.12 | 2,298,840 | 21:00:02 |
 |
RBC Capital Markets® |
Filed Pursuant to Rule 424(b)(2)
Registration Statement No. 333-208507
|
|
|
|
|||
|
Pricing Supplement
Dated February 5, 2016 To the Product Prospectus Supplement ERN-ES-1 Dated January 14, 2016, Prospectus Supplement Dated January 8, 2016, and Prospectus Dated January 8, 2016
|
$785,000
Bullish Barrier Enhanced Return Notes
Linked to a Basket of 10 Financial Sector Stocks, Due August 9, 2018
Royal Bank of Canada
|
||
|
|
|
|
|
|
Per Note
|
Total
|
||
|
Price to public
|
100%
|
$785,000.00
|
|
|
Underwriting discounts and commissions
|
2.50%
|
$19,625.00
|
|
|
Proceeds to Royal Bank of Canada
|
97.50%
|
$765,375.00
|
|
|
|
|
Bullish Barrier Enhanced Return Notes
Linked to a Basket of 10 Financial Sector Stocks, Due August 9, 2018 |
|
Issuer:
|
Royal Bank of Canada (“Royal Bank”)
|
|
Issue:
|
Senior Global Medium-Term Notes, Series G
|
|
Underwriter:
|
RBC Capital Markets, LLC (“RBCCM”)
|
|
Reference Asset:
|
The Notes are linked to the value of an equally weighted basket (the “Basket”) consisting of the common equity securities of 10 publicly traded companies (each, a “Reference Stock,” and collectively, the “Reference Stocks”). The 10 Reference Stocks, their respective Component Weights and their Initial Prices are indicated in the table below.
|
|
Currency:
|
U.S. Dollars
|
|
Minimum Investment:
|
$1,000 and minimum denominations of $1,000 in excess thereof
|
|
Pricing Date:
|
February 5, 2016
|
|
Issue Date:
|
February 10, 2016
|
|
CUSIP:
|
78012KLE5
|
|
Valuation Date:
|
August 6, 2018
|
|
Payment at Maturity
(if held to maturity):
|
If, on the Valuation Date, the Percentage Change is positive, then the investor will receive an amount per $1,000 principal amount per Note equal to the lesser of:
1. Principal Amount + (Principal Amount x Percentage Change x Leverage Factor) and
2. Maximum Redemption Amount
|
|
If, on the Valuation Date, the Percentage Change is less than or equal to 0% but not by more than 30.00% (that is, the Percentage Change is between zero and -30.00%), then the investor will receive the principal amount only.
|
|
|
If, on the Valuation Date, the Percentage Change is less than 0% by more than 30.00% (that is, the Percentage Change is between -30.01% and -100%), then the investor will receive a cash payment equal to:
Principal Amount + (Principal Amount x Percentage Change)
|
|
|
Percentage Change:
|
The Percentage Change will equal an amount, expressed as a percentage and rounded to two decimal places, equal to the sum of the Weighted Component Changes for the Reference Stocks. The Weighted Component Change for each Reference Stock will be determined as follows:
 |
|
Initial Price:
|
The closing price per share of a Reference Stock on the Pricing Date
|
|
Leverage Factor:
|
120%
|
|
Final Price:
|
The closing price per share of a Reference Stock on the Valuation Date
|
|
Barrier Percentage:
|
30%
|
|
Maximum Redemption Amount:
|
140.50% multiplied by the principal amount
|
|
|
|
|
Bullish Barrier Enhanced Return Notes
Linked to a Basket of 10 Financial Sector Stocks, Due August 9, 2018 |
|
The Basket:
|
Reference Stock
|
Bloomberg Ticker
|
Component Weight
|
Initial Price
|
|
BB&T Corporation
|
BBT
|
10.00%
|
$32.06
|
|
|
Popular, Inc.
|
BPOP
|
10.00%
|
$25.08
|
|
|
Comerica Incorporated
|
CMA
|
10.00%
|
$34.57
|
|
|
Fifth Third Bancorp
|
FITB
|
10.00%
|
$15.33
|
|
|
JPMorgan Chase & Co.
|
JPM
|
10.00%
|
$57.75
|
|
|
Morgan Stanley
|
MS
|
10.00%
|
$24.35
|
|
|
M&T Bank Corporation
|
MTB
|
10.00%
|
$107.80
|
|
|
The PNC Financial Services Group, Inc.
|
PNC
|
10.00%
|
$83.57
|
|
|
U.S. Bancorp
|
USB
|
10.00%
|
$40.09
|
|
|
Wells Fargo & Company
|
WFC
|
10.00%
|
$47.86
|
|
Maturity Date:
|
August 9, 2018, subject to extension for market and other disruptions, as described in the product prospectus supplement dated January 14, 2016.
|
|
Term:
|
Approximately 2.5 years.
|
|
Principal at Risk:
|
The Notes are NOT principal protected. You may lose all or a substantial portion of your principal amount at maturity if there is a percentage decrease in the value of the Basket between the Pricing Date and the Valuation Date of more than 25%.
|
|
Calculation Agent:
|
RBCCM
|
|
U.S. Tax Treatment:
|
By purchasing a Note, each holder agrees (in the absence of a change in law, an administrative determination or a judicial ruling to the contrary) to treat the Note as a pre-paid cash-settled derivative contract for U.S. federal income tax purposes. However, the U.S. federal income tax consequences of your investment in the Notes are uncertain and the Internal Revenue Service could assert that the Notes should be taxed in a manner that is different from that described in the preceding sentence. Please see the discussion (including the opinion of our counsel Morrison & Foerster LLP) in the product prospectus supplement dated January 14, 2016 under “Supplemental Discussion of U.S. Federal Income Tax Consequences,” which applies to the Notes.
|
|
Secondary Market:
|
RBCCM (or one of its affiliates), though not obligated to do so, plans to maintain a secondary market in the Notes after the Issue Date. The amount that you may receive upon sale of your Notes prior to maturity may be less than the principal amount of your Notes.
|
|
Listing:
|
The Notes will not be listed on any securities exchange.
|
|
Clearance and Settlement:
|
DTC global (including through its indirect participants Euroclear and Clearstream, Luxembourg as described under “Description of Debt Securities—Ownership and Book-Entry Issuance” in the prospectus dated January 8, 2016).
|
|
|
|
|
Bullish Barrier Enhanced Return Notes
Linked to a Basket of 10 Financial Sector Stocks, Due August 9, 2018 |
|
Terms Incorporated
in the Master Note:
|
All of the terms appearing above the item captioned “Secondary Market” on pages P-2 and P-3 of this pricing supplement and the terms appearing under the caption “General Terms of the Notes” in the product prospectus supplement dated January 14, 2016, as modified by this pricing supplement.
|
|
|
|
|
Bullish Barrier Enhanced Return Notes
Linked to a Basket of 10 Financial Sector Stocks, Due August 9, 2018 |
|
|
|
|
Bullish Barrier Enhanced Return Notes
Linked to a Basket of 10 Financial Sector Stocks, Due August 9, 2018 |
|
Example 1—
|
Calculation of the Payment at Maturity where the Percentage Change is positive.
|
|
|
Percentage Change:
|
10%
|
|
|
Payment at Maturity:
|
$1,000 + ($1,000 x 10% x 120%) = $1,000 + $120 = $1,120.00
|
|
|
On a $1,000 investment, a 10% Percentage Change results in a Payment at Maturity of $1,120.00, a 12.00% return on the Notes.
|
||
|
Example 2—
|
Calculation of the Payment at Maturity where the Percentage Change is positive and the Payment at Maturity is subject to the Maximum Redemption Amount.
|
|
|
Percentage Change:
|
40%
|
|
|
Payment at Maturity:
|
$1,000 + ($1,000 x 40% x 120%) = $1,000 + $480 = $1,480.00
However, the Maximum Redemption Amount is $1,405.00 |
|
|
On a $1,000 investment, a 40% Percentage Change results in a Payment at Maturity of $1,405.00, a 40.50% return on the Notes.
|
||
|
Example 3—
|
Calculation of the Payment at Maturity where the Percentage Change is negative (but not by more than the Barrier Percentage).
|
|
|
Percentage Change:
|
-8%
|
|
|
Payment at Maturity:
|
In this case, even though the Percentage Change is negative, you will receive the principal amount of your Notes at maturity, because the Percentage Change is not negative by more than the Barrier Percentage of 30%.
|
|
|
In this case, on a $1,000 investment, a -8% Percentage Change results in a Payment at Maturity of $1,000.00, a 0.00% return on the Notes.
|
||
|
Example 4—
|
Calculation of the Payment at Maturity where the Percentage Change is negative (by more than the Barrier Percentage).
|
|
|
Percentage Change:
|
-40%
|
|
|
Payment at Maturity:
|
$1,000 + ($1,000 x -40%) = $1,000 - $400 = $600.00
|
|
|
In this case, on a $1,000 investment, a -40% Percentage Change results in a Payment at Maturity of $600.00, a -40.00% return on the Notes.
|
||
|
|
|
|
Bullish Barrier Enhanced Return Notes
Linked to a Basket of 10 Financial Sector Stocks, Due August 9, 2018 |
| · | Principal at Risk – Investors in the Notes could lose all or a substantial portion of their principal amount if there is a decline in the value of the Basket. You will lose 1% of the principal amount of your Notes for each 1% decline of the value of the Basket if the Percentage Change is more than -30%. There is no minimum payment at maturity, and you could lose your entire investment. |
| · | The Notes Do Not Pay Interest and Your Return May Be Lower than the Return on a Conventional Debt Security of Comparable Maturity – There will be no periodic interest payments on the Notes as there would be on a conventional fixed-rate or floating-rate debt security having the same maturity. The return that you will receive on the Notes, which could be negative, may be less than the return you could earn on other investments. Even if your return is positive, your return may be less than the return you would earn if you bought a conventional senior interest bearing debt security of Royal Bank. |
| · | Your Potential Payment at Maturity Is Limited – The Notes will provide less opportunity to participate in the appreciation of the Basket than an investment in a security linked to the Basket providing full participation in the appreciation, because the payment at maturity will not exceed the Maximum Redemption Amount. Accordingly, your return on the Notes may be less than your return would be if you made an investment in the Reference Stocks or in a security directly linked to the positive performance of the Basket. |
| · | Payments on the Notes Are Subject to Our Credit Risk, and Changes in Our Credit Ratings Are Expected to Affect the Market Value of the Notes – The Notes are Royal Bank’s senior unsecured debt securities. As a result, your receipt of the amount due on the maturity date is dependent upon Royal Bank’s ability to repay its obligations at that time. This will be the case even if the value of the Basket increases after the Pricing Date. No assurance can be given as to what our financial condition will be at the maturity of the Notes. |
| · | There May Not Be an Active Trading Market for the Notes—Sales in the Secondary Market May Result in Significant Losses – There may be little or no secondary market for the Notes. The Notes will not be listed on any securities exchange. RBCCM and other affiliates of Royal Bank may make a market for the Notes; however, they are not required to do so. RBCCM or any other affiliate of Royal Bank may stop any market-making activities at any time. Even if a secondary market for the Notes develops, it may not provide significant liquidity or trade at prices advantageous to you. We expect that transaction costs in any secondary market would be high. As a result, the difference between bid and asked prices for your Notes in any secondary market could be substantial. |
| · | You Will Not Have Any Rights to the Reference Stocks – As a holder of the Notes, you will not have voting rights or rights to receive cash dividends or other distributions or other rights that holders of the Reference Stocks would have. The final value of the Basket will not reflect any dividends paid on the Reference Stocks. |
| · | The Initial Estimated Value of the Notes Is Less than the Price to the Public. – The initial estimated value set forth on the cover page of this pricing supplement does not represent a minimum price at which we, RBCCM or any of our affiliates would be willing to purchase the Notes in any secondary market (if any exists) at any time. If you attempt to sell the Notes prior to maturity, their market value may be lower than the price you paid for them and the initial estimated value. This is due to, among other things, changes in the value of the Basket, the borrowing rate we pay to issue securities of this kind, and the inclusion in the price to the public of the underwriting discount and the estimated costs relating to our hedging of the Notes. These factors, together with various credit, market and economic factors over the term of the Notes, are expected to reduce the price at which you may be able to sell the Notes in any secondary market and will affect the value of the Notes in complex and unpredictable ways. Assuming no change in market conditions or any other relevant factors, the price, if any, at which you may be able to sell your Notes prior to maturity may be less than your original purchase price, as any |
|
|
|
|
Bullish Barrier Enhanced Return Notes
Linked to a Basket of 10 Financial Sector Stocks, Due August 9, 2018 |
| · | The Initial Estimated Value of the Notes Is an Estimate Only, Calculated as of the Time the Terms of the Notes Were Set – The initial estimated value of the Notes is based on the value of our obligation to make the payments on the Notes, together with the mid-market value of the derivative embedded in the terms of the Notes. See “Structuring the Notes” below. Our estimate is based on a variety of assumptions, including our credit spreads, expectations as to dividends, interest rates and volatility, and the expected term of the Notes. These assumptions are based on certain forecasts about future events, which may prove to be incorrect. Other entities may value the Notes or similar securities at a price that is significantly different than we do. |
| · | The Stocks Included in the Basket Are Concentrated in One Sector — All of the stocks included in the Basket are issued by companies in the financial sector. Although an investment in the Notes will not give holders any ownership or other direct interests in the Reference Stocks, the return on an investment in the Notes will be subject to certain risks associated with a direct equity investment in companies in the financial services sector. Accordingly, by investing in the Notes, you will not benefit from the diversification which could result from an investment linked to companies that operate in multiple sectors. |
| · | Adverse Conditions in the Financial Sector May Reduce Your Return on the Notes — All of the Reference Stocks are issued by companies whose primary lines of business are directly associated with the financial services sector. The profitability of these companies is largely dependent on the availability and cost of capital funds, and can fluctuate significantly, particularly when market interest rates change. Credit losses resulting from financial difficulties of these companies’ customers can negatively impact the sector. In addition, adverse economic, business, or political developments affecting the U.S., including with respect to the insurance sector, or to real estate and loans secured by real estate, could have a major effect on the value of the Basket. As a result of these factors, the value of the Notes may be subject to greater volatility and be more adversely affected by economic, political, or regulatory events relating to the financial services sector. |
| · | Economic Conditions Have Adversely Impacted the Stock Prices of Many Companies in the Financial Services Sector, and May Do So During the Term of the Notes — In recent years, economic conditions in the U.S. have resulted, and may continue to result, in significant losses among many companies that operate in the financial services sector. These conditions have also resulted, and may continue to result, in a high degree of volatility in the stock prices of financial institutions, and substantial fluctuations in the profitability of these companies. Numerous financial services companies have experienced substantial decreases in the value of their assets, taken action to raise capital (including the issuance of debt or equity securities), or even ceased operations. Further, companies in the financial services sector have been subject to unprecedented government actions and regulation, which may limit the scope of their operations and, in turn, result in a decrease in value of these companies. Any of these factors may have an adverse impact on the performance of the Basket. As a result, the value of the Basket may be adversely affected by economic, political, or regulatory events affecting the financial services sector or one of the sub-sectors of the financial services sector. This in turn could adversely impact the market value of the Notes and decrease the Payment at Maturity. |
|
|
|
|
Bullish Barrier Enhanced Return Notes
Linked to a Basket of 10 Financial Sector Stocks, Due August 9, 2018 |
| · | Market Disruption Events and Adjustments — The payment at maturity and the Valuation Date are subject to adjustment as described in the product prospectus supplement. For a description of what constitutes a market disruption event as well as the consequences of that market disruption event, see “General Terms of the Notes—Market Disruption Events” in the product prospectus supplement. |
|
|
|
|
Bullish Barrier Enhanced Return Notes
Linked to a Basket of 10 Financial Sector Stocks, Due August 9, 2018 |
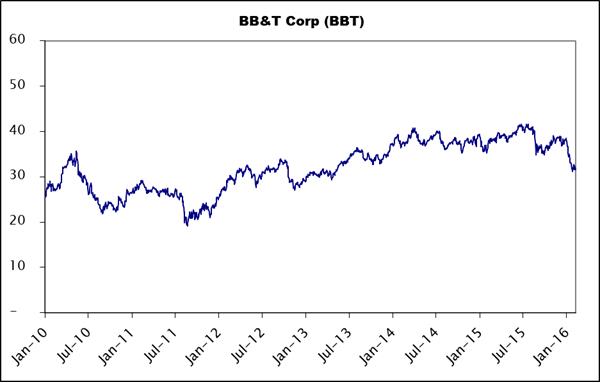
| · | BB&T Corporation operates banking offices in the Carolinas, Georgia, Virginia, Maryland, West Virginia, Kentucky, Alabama, Indiana, Washington D.C., Florida, Tennessee and Texas. The company offers commercial and retail banking services. Its common stock trades on the New York Stock Exchange (the “NYSE”) under the symbol “BBT.” |
| · | Popular, Inc. is a bank holding company that provides commercial banking services through branches in Puerto Rico, the British Virgin Islands, the Dominican Republic, and the United States mainland. Its common stock trades on the Nasdaq Global Select Market (the “NASDAQ”) under the symbol “BPOP.” |
| · | Comerica Incorporated is the holding company for business, individual, and investment banks with operations in the United States, Canada, and Mexico. Its common stock trades on the NYSE under the symbol “CMA.” |
| · | Fifth Third Bancorp is a financial services company that operates banking centers in the Midwestern and Southeastern regions of the United States. Its common stock trades on the NASDAQ under the symbol “FITB.” |
| · | JPMorgan Chase & Co. provides global financial services and retail banking. Its common stock trades on the NYSE under the symbol “JPM.” |
| · | Morgan Stanley, a bank holding company, provides financial services. Its common stock trades on the NYSE under the symbol “MS.” |
| · | M&TTT Bank Corporation is a bank holding company. The company, through its banking subsidiaries, offers a variety of commercial banking, trust, and investment services to their customers. Its common stock trades on the NYSE under the symbol “MTB.” |
| · | PNC Financial Services Group, Inc. is a financial services organization. The company provides regional banking, wholesale banking, and asset management services nationally. Its common stock trades on the NYSE under the symbol “PNC.” |
| · | U.S. Bancorp is a financial services company that provides lending and depository services, cash management, foreign exchange and trust and investment management services. Its common stock trades on the NYSE under the symbol “USB.” |
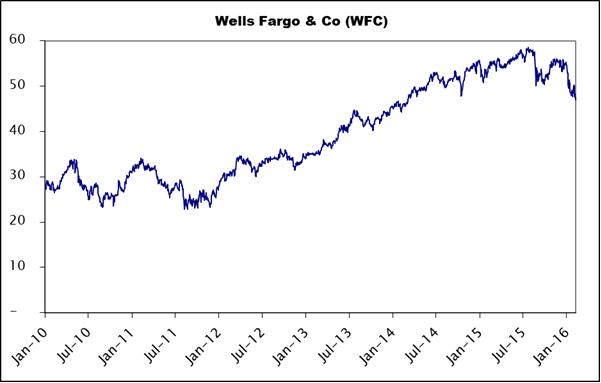
| · | Wells Fargo & Company is a financial services company providing banking, insurance, investments, mortgage, leasing, credit cards, and consumer finance. Its common stock trades on the NYSE under the symbol “WFC.” |
|
|
|
|
Bullish Barrier Enhanced Return Notes
Linked to a Basket of 10 Financial Sector Stocks, Due August 9, 2018 |
|
|
|
|
Bullish Barrier Enhanced Return Notes
Linked to a Basket of 10 Financial Sector Stocks, Due August 9, 2018 |
|
Period-Start Date
|
Period-End Date
|
High Intra-Day
Price of the Reference Stock in ($) |
Low Intra-Day
Price of the Reference Stock in ($) |
Period-End Closing Price of the Reference Stock in ($)
|
||||
|
1/1/2012
|
3/31/2012
|
31.94
|
25.28
|
31.39
|
||||
|
4/1/2012
|
6/30/2012
|
32.74
|
27.40
|
30.85
|
||||
|
7/1/2012
|
9/30/2012
|
34.37
|
30.41
|
33.16
|
||||
|
10/1/2012
|
12/30/2012
|
33.89
|
26.86
|
29.11
|
||||
|
1/1/2013
|
3/30/2013
|
31.81
|
29.54
|
31.39
|
||||
|
4/1/2013
|
6/29/2013
|
34.37
|
29.18
|
33.88
|
||||
|
7/1/2013
|
9/28/2013
|
36.59
|
33.30
|
33.75
|
||||
|
10/1/2013
|
12/31/2013
|
37.42
|
32.65
|
37.32
|
||||
|
1/1/2014
|
3/28/2014
|
41.04
|
36.28
|
40.17
|
||||
|
4/1/2014
|
6/28/2014
|
40.95
|
36.38
|
39.43
|
||||
|
7/1/2014
|
9/30/2014
|
40.21
|
35.86
|
37.23
|
||||
|
10/1/2014
|
12/31/2014
|
39.69
|
34.50
|
38.89
|
||||
|
1/1/2015
|
3/31/2015
|
40.17
|
36.28
|
40.17
|
||||
|
4/1/2015
|
6/30/2015
|
40.95
|
36.38
|
39.43
|
||||
|
7/1/2015
|
9/30/2015
|
40.21
|
35.86
|
37.21
|
||||
|
10/1/2015
|
12/31/2015
|
39.69
|
34.50
|
38.89
|
||||
|
1/1/2016
|
2/5/2016
|
37.03
|
30.99
|
31.91
|
|
|
|
|
Bullish Barrier Enhanced Return Notes
Linked to a Basket of 10 Financial Sector Stocks, Due August 9, 2018 |

|
Period-Start Date
|
Period-End Date
|
High Intra-Day
Price of the Reference Stock in ($) |
Low Intra-Day
Price of the Reference Stock in ($) |
Period-End Closing Price of the Reference Stock in ($)
|
||||
|
1/1/2012
|
3/30/2012
|
23.20
|
14.10
|
20.50
|
||||
|
4/1/2012
|
6/29/2012
|
21.40
|
13.51
|
16.61
|
||||
|
7/1/2012
|
9/28/2012
|
19.26
|
13.38
|
17.45
|
||||
|
10/1/2012
|
12/31/2012
|
20.91
|
17.27
|
20.79
|
||||
|
1/1/2013
|
3/28/2013
|
29.78
|
21.01
|
27.60
|
||||
|
4/1/2013
|
6/28/2013
|
31.00
|
26.60
|
30.37
|
||||
|
7/1/2013
|
9/30/2013
|
34.34
|
25.80
|
26.25
|
||||
|
10/1/2013
|
12/31/2013
|
29.34
|
23.97
|
28.73
|
||||
|
1/1/2014
|
3/31/2014
|
32.74
|
24.71
|
30.99
|
||||
|
4/1/2014
|
6/30/2014
|
34.75
|
27.90
|
34.18
|
||||
|
7/1/2014
|
9/30/2014
|
34.95
|
29.10
|
29.44
|
||||
|
10/1/2014
|
12/31/2014
|
34.44
|
26.53
|
34.05
|
||||
|
1/1/2015
|
3/31/2015
|
35.83
|
30.29
|
34.39
|
||||
|
4/1/2015
|
6/30/2015
|
35.81
|
27.38
|
28.86
|
||||
|
7/1/2015
|
9/30/2015
|
31.99
|
27.17
|
30.23
|
||||
|
10/1/2015
|
12/31/2015
|
32.79
|
26.60
|
28.34
|
||||
|
1/1/2016
|
2/5/2016
|
28.18
|
22.40
|
25.08
|
|
|
|
|
Bullish Barrier Enhanced Return Notes
Linked to a Basket of 10 Financial Sector Stocks, Due August 9, 2018 |

|
Period-Start Date
|
Period-End Date
|
High Intra-Day
Price of the Reference Stock in ($) |
Low Intra-Day
Price of the Reference Stock in ($) |
Period-End Closing Price of the Reference Stock in ($)
|
||||
|
1/1/2012
|
3/31/2012
|
34.00
|
26.25
|
32.36
|
||||
|
4/1/2012
|
6/30/2012
|
32.88
|
27.88
|
30.71
|
||||
|
7/1/2012
|
9/30/2012
|
33.38
|
29.32
|
31.05
|
||||
|
10/1/2012
|
12/30/2012
|
32.14
|
27.72
|
30.34
|
||||
|
1/1/2013
|
3/30/2013
|
36.99
|
30.73
|
35.95
|
||||
|
4/1/2013
|
6/29/2013
|
40.44
|
33.55
|
39.83
|
||||
|
7/1/2013
|
9/28/2013
|
43.49
|
38.56
|
39.31
|
||||
|
10/1/2013
|
12/31/2013
|
48.69
|
38.64
|
47.54
|
||||
|
1/1/2014
|
3/28/2014
|
53.50
|
43.96
|
51.80
|
||||
|
4/1/2014
|
6/28/2014
|
52.60
|
45.34
|
50.16
|
||||
|
7/1/2014
|
9/30/2014
|
52.72
|
48.33
|
49.86
|
||||
|
10/1/2014
|
12/31/2014
|
50.14
|
42.73
|
46.84
|
||||
|
1/1/2015
|
3/31/2015
|
47.94
|
40.09
|
45.13
|
||||
|
4/1/2015
|
6/30/2015
|
53.45
|
44.38
|
51.32
|
||||
|
7/1/2015
|
9/30/2015
|
52.93
|
40.01
|
41.10
|
||||
|
10/1/2015
|
12/31/2015
|
47.44
|
39.52
|
41.83
|
||||
|
1/1/2016
|
2/5/2016
|
41.74
|
31.92
|
34.57
|
|
|
|
|
Bullish Barrier Enhanced Return Notes
Linked to a Basket of 10 Financial Sector Stocks, Due August 9, 2018 |

|
Period-Start Date
|
Period-End Date
|
High Intra-Day
Price of the Reference Stock in ($) |
Low Intra-Day
Price of the Reference Stock in ($) |
Period-End Closing Price of the Reference Stock in ($)
|
||||
|
1/1/2012
|
3/30/2012
|
14.73
|
12.79
|
14.05
|
||||
|
4/1/2012
|
6/29/2012
|
14.66
|
12.04
|
13.40
|
||||
|
7/1/2012
|
9/28/2012
|
15.95
|
13.08
|
15.51
|
||||
|
10/1/2012
|
12/31/2012
|
16.15
|
13.75
|
15.19
|
||||
|
1/1/2013
|
3/28/2013
|
16.77
|
15.19
|
16.31
|
||||
|
4/1/2013
|
6/28/2013
|
18.73
|
15.64
|
18.05
|
||||
|
7/1/2013
|
9/30/2013
|
19.78
|
17.80
|
18.04
|
||||
|
10/1/2013
|
12/31/2013
|
21.13
|
17.49
|
21.03
|
||||
|
1/1/2014
|
3/31/2014
|
23.90
|
20.37
|
22.95
|
||||
|
4/1/2014
|
6/30/2014
|
23.40
|
19.82
|
21.35
|
||||
|
7/1/2014
|
9/30/2014
|
21.79
|
19.46
|
20.02
|
||||
|
10/1/2014
|
12/31/2014
|
20.82
|
17.66
|
20.38
|
||||
|
1/1/2015
|
3/31/2015
|
20.53
|
17.14
|
18.85
|
||||
|
4/1/2015
|
6/30/2015
|
21.90
|
18.63
|
20.82
|
||||
|
7/1/2015
|
9/30/2015
|
21.92
|
18.21
|
18.91
|
||||
|
10/1/2015
|
12/31/2015
|
21.13
|
18.16
|
20.10
|
||||
|
1/1/2016
|
2/5/2016
|
19.73
|
14.90
|
15.33
|
|
|
|
|
Bullish Barrier Enhanced Return Notes
Linked to a Basket of 10 Financial Sector Stocks, Due August 9, 2018 |

|
Period-Start Date
|
Period-End Date
|
High Intra-Day
Price of the Reference Stock in ($) |
Low Intra-Day
Price of the Reference Stock in ($) |
Period-End Closing Price of the Reference Stock in ($)
|
||||
|
1/1/2012
|
3/30/2012
|
46.49
|
34.01
|
45.98
|
||||
|
4/1/2012
|
6/29/2012
|
46.35
|
30.83
|
35.73
|
||||
|
7/1/2012
|
9/28/2012
|
42.09
|
33.10
|
40.48
|
||||
|
10/1/2012
|
12/31/2012
|
44.54
|
38.83
|
43.97
|
||||
|
1/1/2013
|
3/28/2013
|
51.00
|
44.20
|
47.46
|
||||
|
4/1/2013
|
6/28/2013
|
55.90
|
46.05
|
52.79
|
||||
|
7/1/2013
|
9/30/2013
|
56.93
|
50.06
|
51.69
|
||||
|
10/1/2013
|
12/31/2013
|
58.55
|
50.25
|
58.48
|
||||
|
1/1/2014
|
3/31/2014
|
61.48
|
54.20
|
60.71
|
||||
|
4/1/2014
|
6/30/2014
|
61.29
|
52.97
|
57.62
|
||||
|
7/1/2014
|
9/30/2014
|
61.85
|
54.96
|
60.24
|
||||
|
10/1/2014
|
12/31/2014
|
63.49
|
54.26
|
62.58
|
||||
|
1/1/2015
|
3/31/2015
|
62.96
|
54.27
|
60.58
|
||||
|
4/1/2015
|
6/30/2015
|
69.82
|
59.65
|
67.76
|
||||
|
7/1/2015
|
9/30/2015
|
70.61
|
50.07
|
60.97
|
||||
|
10/1/2015
|
12/31/2015
|
69.03
|
58.53
|
66.03
|
||||
|
1/1/2016
|
2/5/2016
|
64.13
|
54.66
|
57.75
|
|
|
|
|
Bullish Barrier Enhanced Return Notes
Linked to a Basket of 10 Financial Sector Stocks, Due August 9, 2018 |

|
Period-Start Date
|
Period-End Date
|
High Intra-Day
Price of the Reference Stock in ($) |
Low Intra-Day
Price of the Reference Stock in ($) |
Period-End Closing Price of the Reference Stock in ($)
|
||||
|
1/1/2012
|
3/30/2012
|
21.19
|
15.43
|
19.64
|
||||
|
4/1/2012
|
6/29/2012
|
20.05
|
12.26
|
14.59
|
||||
|
7/1/2012
|
9/28/2012
|
18.50
|
12.29
|
16.74
|
||||
|
10/1/2012
|
12/31/2012
|
19.45
|
15.95
|
19.12
|
||||
|
1/1/2013
|
3/28/2013
|
24.47
|
19.32
|
21.98
|
||||
|
4/1/2013
|
6/28/2013
|
27.17
|
20.16
|
24.43
|
||||
|
7/1/2013
|
9/30/2013
|
29.50
|
23.83
|
26.95
|
||||
|
10/1/2013
|
12/31/2013
|
31.85
|
26.41
|
31.36
|
||||
|
1/1/2014
|
3/31/2014
|
33.52
|
28.78
|
31.17
|
||||
|
4/1/2014
|
6/30/2014
|
32.82
|
28.31
|
32.33
|
||||
|
7/1/2014
|
9/30/2014
|
36.44
|
31.12
|
34.57
|
||||
|
10/1/2014
|
12/31/2014
|
39.19
|
31.35
|
38.80
|
||||
|
1/1/2015
|
3/31/2015
|
39.15
|
33.72
|
35.69
|
||||
|
4/1/2015
|
6/30/2015
|
40.26
|
35.36
|
38.79
|
||||
|
7/1/2015
|
9/30/2015
|
41.04
|
30.40
|
31.50
|
||||
|
10/1/2015
|
12/31/2015
|
35.74
|
30.15
|
31.81
|
||||
|
1/1/2016
|
2/5/2016
|
31.70
|
23.29
|
24.35
|
|
|
|
|
Bullish Barrier Enhanced Return Notes
Linked to a Basket of 10 Financial Sector Stocks, Due August 9, 2018 |

|
Period-Start Date
|
Period-End Date
|
High Intra-Day
Price of the Reference Stock in ($) |
Low Intra-Day
Price of the Reference Stock in ($) |
Period-End Closing Price of the Reference Stock in ($)
|
||||
|
1/1/2012
|
3/30/2012
|
87.37
|
76.82
|
86.88
|
||||
|
4/1/2012
|
6/29/2012
|
88.00
|
76.92
|
82.57
|
||||
|
7/1/2012
|
9/28/2012
|
95.98
|
82.29
|
95.16
|
||||
|
10/1/2012
|
12/31/2012
|
105.33
|
95.02
|
98.47
|
||||
|
1/1/2013
|
3/28/2013
|
105.90
|
99.59
|
103.16
|
||||
|
4/1/2013
|
6/28/2013
|
112.01
|
95.68
|
111.75
|
||||
|
7/1/2013
|
9/30/2013
|
119.54
|
109.47
|
111.92
|
||||
|
10/1/2013
|
12/31/2013
|
117.29
|
109.23
|
116.42
|
||||
|
1/1/2014
|
3/31/2014
|
123.04
|
109.16
|
121.30
|
||||
|
4/1/2014
|
6/30/2014
|
125.90
|
116.10
|
124.05
|
||||
|
7/1/2014
|
9/30/2014
|
128.69
|
118.51
|
123.29
|
||||
|
10/1/2014
|
12/31/2014
|
128.96
|
112.42
|
125.62
|
||||
|
1/1/2015
|
3/31/2015
|
129.58
|
111.78
|
127.00
|
||||
|
4/1/2015
|
6/30/2015
|
128.70
|
117.86
|
129.43
|
||||
|
7/1/2015
|
9/30/2015
|
134.00
|
111.86
|
121.95
|
||||
|
10/1/2015
|
12/31/2015
|
127.39
|
11.50
|
121.18
|
||||
|
1/1/2016
|
2/5/2016
|
119.24
|
101.51
|
107.80
|
|
|
|
|
Bullish Barrier Enhanced Return Notes
Linked to a Basket of 10 Financial Sector Stocks, Due August 9, 2018 |

|
Period-Start Date
|
Period-End Date
|
High Intra-Day
Price of the Reference Stock in ($) |
Low Intra-Day
Price of the Reference Stock in ($) |
Period-End Closing Price of the Reference Stock in ($)
|
||||
|
1/1/2012
|
3/30/2012
|
64.79
|
56.88
|
64.49
|
||||
|
4/1/2012
|
6/29/2012
|
67.89
|
55.60
|
61.11
|
||||
|
7/1/2012
|
9/28/2012
|
67.04
|
56.76
|
63.10
|
||||
|
10/1/2012
|
12/31/2012
|
65.73
|
53.36
|
58.31
|
||||
|
1/1/2013
|
3/28/2013
|
66.94
|
58.96
|
66.50
|
||||
|
4/1/2013
|
6/28/2013
|
74.19
|
63.69
|
72.92
|
||||
|
7/1/2013
|
9/30/2013
|
77.93
|
71.48
|
72.45
|
||||
|
10/1/2013
|
12/31/2013
|
78.36
|
70.63
|
77.58
|
||||
|
1/1/2014
|
3/31/2014
|
87.80
|
76.06
|
87.00
|
||||
|
4/1/2014
|
6/30/2014
|
89.85
|
79.80
|
89.05
|
||||
|
7/1/2014
|
9/30/2014
|
90.00
|
80.43
|
85.58
|
||||
|
10/1/2014
|
12/31/2014
|
93.45
|
76.69
|
91.23
|
||||
|
1/1/2015
|
3/31/2015
|
96.71
|
81.84
|
93.24
|
||||
|
4/1/2015
|
6/30/2015
|
99.61
|
90.42
|
95.65
|
||||
|
7/1/2015
|
9/30/2015
|
100.52
|
82.77
|
89.20
|
||||
|
10/1/2015
|
12/31/2015
|
97.50
|
84.93
|
95.31
|
||||
|
1/1/2016
|
2/5/2016
|
94.26
|
81.38
|
83.57
|
|
|
|
|
Bullish Barrier Enhanced Return Notes
Linked to a Basket of 10 Financial Sector Stocks, Due August 9, 2018 |

|
Period-Start Date
|
Period-End Date
|
High Intra-Day
Price of the Reference Stock in ($) |
Low Intra-Day
Price of the Reference Stock in ($) |
Period-End Closing Price of the Reference Stock in ($)
|
||||
|
1/1/2012
|
3/30/2012
|
32.23
|
27.21
|
31.68
|
||||
|
4/1/2012
|
6/29/2012
|
32.98
|
28.58
|
32.16
|
||||
|
7/1/2012
|
9/28/2012
|
35.15
|
31.76
|
34.30
|
||||
|
10/1/2012
|
12/31/2012
|
35.46
|
30.96
|
31.94
|
||||
|
1/1/2013
|
3/28/2013
|
34.73
|
32.40
|
33.93
|
||||
|
4/1/2013
|
6/28/2013
|
36.40
|
31.99
|
36.15
|
||||
|
7/1/2013
|
9/30/2013
|
38.23
|
35.83
|
36.58
|
||||
|
10/1/2013
|
12/31/2013
|
40.83
|
35.69
|
40.40
|
||||
|
1/1/2014
|
3/31/2014
|
43.66
|
38.72
|
42.86
|
||||
|
4/1/2014
|
6/30/2014
|
43.92
|
39.86
|
43.32
|
||||
|
7/1/2014
|
9/30/2014
|
43.75
|
40.58
|
41.83
|
||||
|
10/1/2014
|
12/31/2014
|
46.10
|
38.10
|
44.95
|
||||
|
1/1/2015
|
3/31/2015
|
45.49
|
40.70
|
43.67
|
||||
|
4/1/2015
|
6/30/2015
|
45.29
|
42.14
|
43.40
|
||||
|
7/1/2015
|
9/30/2015
|
46.26
|
38.81
|
41.01
|
||||
|
10/1/2015
|
12/31/2015
|
44.58
|
39.28
|
42.67
|
||||
|
1/1/2016
|
2/5/2016
|
41.82
|
37.97
|
40.09
|
|
|
|
|
Bullish Barrier Enhanced Return Notes
Linked to a Basket of 10 Financial Sector Stocks, Due August 9, 2018 |
|
Period-Start Date
|
Period-End Date
|
High Intra-Day
Price of the Reference Stock in ($) |
Low Intra-Day
Price of the Reference Stock in ($) |
Period-End Closing Price of the Reference Stock in ($)
|
||||
|
1/1/2012
|
3/30/2012
|
34.59
|
27.94
|
34.14
|
||||
|
4/1/2012
|
6/29/2012
|
34.59
|
29.80
|
33.44
|
||||
|
7/1/2012
|
9/28/2012
|
36.60
|
32.62
|
34.53
|
||||
|
10/1/2012
|
12/31/2012
|
36.34
|
31.25
|
34.18
|
||||
|
1/1/2013
|
3/28/2013
|
38.20
|
34.43
|
36.99
|
||||
|
4/1/2013
|
6/28/2013
|
41.74
|
36.19
|
41.27
|
||||
|
7/1/2013
|
9/30/2013
|
44.79
|
40.79
|
41.32
|
||||
|
10/1/2013
|
12/31/2013
|
45.64
|
40.07
|
45.40
|
||||
|
1/1/2014
|
3/31/2014
|
49.97
|
44.17
|
49.74
|
||||
|
4/1/2014
|
6/30/2014
|
53.05
|
46.72
|
52.56
|
||||
|
7/1/2014
|
9/30/2014
|
53.80
|
49.47
|
51.87
|
||||
|
10/1/2014
|
12/31/2014
|
55.95
|
46.44
|
54.82
|
||||
|
1/1/2015
|
3/31/2015
|
56.29
|
50.42
|
54.40
|
||||
|
4/1/2015
|
6/30/2015
|
58.26
|
53.65
|
56.24
|
||||
|
7/1/2015
|
9/30/2015
|
58.77
|
47.75
|
51.35
|
||||
|
10/1/2015
|
12/31/2015
|
56.34
|
49.51
|
54.36
|
||||
|
1/1/2016
|
2/5/2016
|
53.27
|
46.51
|
47.86
|
|
|
|
|
Bullish Barrier Enhanced Return Notes
Linked to a Basket of 10 Financial Sector Stocks, Due August 9, 2018 |
|
|
|
|
Bullish Barrier Enhanced Return Notes
Linked to a Basket of 10 Financial Sector Stocks, Due August 9, 2018 |
1 Year Royal Bank of Canada Chart |
1 Month Royal Bank of Canada Chart |

It looks like you are not logged in. Click the button below to log in and keep track of your recent history.
Support: +44 (0) 203 8794 460 | support@advfn.com
By accessing the services available at ADVFN you are agreeing to be bound by ADVFN's Terms & Conditions
 Hot Features