ADVFN Logo ADVFN

We could not find any results for:
Make sure your spelling is correct or try broadening your search.

Trending Now

Toplists

It looks like you aren't logged in.
Click the button below to log in and view your recent history.

Hot Features

Registration Strip Icon for monitor Customisable watchlists with full streaming quotes from leading exchanges, such as LSE, NASDAQ, NYSE, AMEX, Bovespa, BIT and more.

RPM RPM International Inc

118.47
7.59 (6.85%)
25 Jul 2024 - Closed
Delayed by 15 minutes
Share Name Share Symbol Market Type
RPM International Inc NYSE:RPM NYSE Common Stock
  Price Change % Change Share Price High Price Low Price Open Price Shares Traded Last Trade
  7.59 6.85% 118.47 121.63 113.52 114.25 1,934,264 22:46:16

RPM Reports Fiscal 2009 Fourth-Quarter and Year-End Results

27/07/2009 12:30pm

PR Newswire (US)


RPM (NYSE:RPM)
Historical Stock Chart


From Jul 2019 to Jul 2024
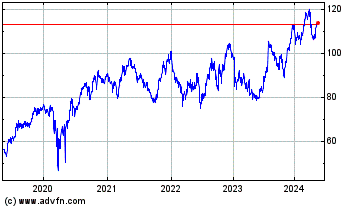
Click Here for more RPM Charts.
- Despite sales declines for quarter and year, net income exceeds year-ago levels, which included one-time charge - Operating cash flow sets record, up 13.8% over fiscal 2008 levels - Lower cost structure improves earnings outlook for Fiscal 2010 MEDINA, Ohio, July 27 /PRNewswire-FirstCall/ -- RPM International Inc. (NYSE:RPM) today reported higher net income for its fourth quarter and fiscal year ended May 31, 2009. Fiscal 2008 net income included a one-time pre-tax charge of $288.1 million in the fourth quarter to increase the company's accrual for asbestos-related liabilities, while the fiscal 2009 fourth quarter and year included a one-time charge of $15.5 million for goodwill and other intangible asset impairments in the company's industrial segment. Excluding these one-time charges, fiscal 2009 net income declined for both the quarter and full year. Sales also declined for both the fourth quarter and fiscal year. Fiscal Fourth-Quarter Results Sales for the quarter fell 20.3% to $857.3 million from $1.08 billion in the 2008 fourth quarter, with the company's industrial and consumer segments both reporting lower results. Fourth-quarter net income was $39.3 million, or $0.31 per diluted share, compared to a year-ago loss of $87.6 million, or $0.73 per diluted share, as a result of the one-time fiscal 2008 charge. Excluding asbestos and impairment-related charges, fiscal 2009 fourth-quarter net income declined 44.0% to $54.6 million, or $0.43 per diluted share, from the $97.5 million, or $0.75 per diluted share, earned a year ago. Earnings before interest and taxes (EBIT) of $83.4 million in the fiscal 2009 fourth quarter compares to a loss of $145.0 million a year ago. Excluding one-time charges for both asbestos and impairment, fiscal 2009 fourth-quarter EBIT dropped 30.9% to $98.9 million from $143.1 million a year ago. Fourth-Quarter Segment Sales and Earnings Sales in RPM's industrial segment declined 21.9% in the fiscal 2009 fourth quarter, to $536.1 million from $686.0 million a year ago. Organic sales fell 23.5%, including a net foreign exchange loss of 7.2%, partially offset by a gain of 1.6% from acquisitions. Industrial segment EBIT declined to $35.2 million from $89.4 million in the fiscal 2008 fourth quarter. Excluding the one-time impairment charge in this segment during fiscal 2009, EBIT declined 43.3% to $50.7 million. Consumer segment sales fell 17.6%, to $321.2 million from $390.0 million in the fiscal 2008 fourth quarter. The decline was all organic, including a net foreign exchange loss of 3.2%. Segment EBIT declined by 21.1% to $52.6 million from $66.7 million a year ago. Fiscal 2009 Sales and Earnings Fiscal 2009 sales fell 7.6% to $3.37 billion from $3.64 billion a year ago. Net income was $119.6 million, or $0.93 per diluted share, compared to $47.7 million, or $0.39 per diluted share in fiscal 2008. Excluding one-time asbestos and impairment-related charges, RPM's fiscal 2009 net income fell 42.1% to $134.9 million, or $1.05 per diluted share, from the $232.8 million, or $1.81 per diluted share, earned a year ago. EBIT for the year was $241.1 million compared to $86.0 million in fiscal 2008. Excluding one-time charges in both years, EBIT fell by 31.4% to $256.6 million from $374.1 million in fiscal 2008. Industrial segment sales, which represented 67% of total sales, declined 4.3% in fiscal 2009 to $2.27 billion from $2.37 billion a year ago. The organic sales decline was 9.5%, including net foreign exchange losses of 4.1%, partially offset by acquisition growth of 5.2%. Industrial segment EBIT in fiscal 2009 was off 32.5% from the prior year, to $176.8 million from $261.8 million. Excluding the one-time impairment charge in fiscal 2009, industrial segment EBIT was down 26.6% to $192.3 million. RPM's consumer segment sales, accounting for 33% of total sales, fell 13.6% to $1.10 billion from $1.28 billion in fiscal 2008. The organic decline was 11.3%, including 2.1% in net foreign exchange losses, while net divestitures represented 2.3% of the total. Consumer segment EBIT was off 33.7% in fiscal 2009, to $106.8 million from $161.1 million a year ago. Capital Structure, Cash Flow and Liquidity RPM's fiscal 2009 cash from operations was a record $267.0 million, up 13.8% from the $234.7 million reported a year ago. Capital expenditures for the year were $55.0 million, compared to depreciation of $62.4 million. After capital expenditures and cash dividends to shareholders, free cash flow for the year totaled $110.2 million, a 52.5% increase over last year. Total debt at May 31, 2009 was $930.8 million compared to $1.1 billion a year ago. The company's net (of cash) debt-to-total capitalization ratio was 37.2%, compared to 42.6% at the end of fiscal 2008, with liquidity, including cash and long-term credit facilities, at $622 million. During the fourth quarter of fiscal 2009, RPM paid $17.2 million pre-tax for indemnity and defense costs for asbestos litigation, compared to $15.0 million in the fiscal 2008 final period. For the full fiscal year, RPM paid $69.4 million in pre-tax asbestos-related indemnity and defense costs, compared to $82.6 million a year ago. The company's total accrual for future asbestos liabilities at year-end was $490.3 million. "I am proud of the extraordinary actions of RPM employees worldwide to respond to these unprecedented economic challenges," stated Frank C. Sullivan, chairman and chief executive officer. "A significant part of that response was the generation of record levels of after-tax cash from operations and free cash flow. With a strong balance sheet, historically high levels of liquidity and record cash flow, we have been able to maintain our employee retirement, health care and benefit plans without change. We've also maintained our cash dividend to shareholders, which has increased for 35 consecutive years, and provides a real cash return during this period of market dislocation." Business Outlook "Our outlook has improved since we first provided guidance for our 2010 fiscal year in April. Our consumer businesses have turned the corner in this difficult economy. With housing turnover, the sale of foreclosed homes and new home construction beginning to show improvement on a regionbyregion basis, we are seeing an uptick in the sale of small project redecoration, patch-and-repair and weatherization products. This, along with the aggressive expense reduction actions taken during the past fiscal year, will enable our consumer businesses to generate consistent earnings growth throughout the year with a modest increase in sales," stated Sullivan. "While our industrial businesses will continue to face economic challenges as a result of weak commercial construction and industrial capital spending activity, our prior-year actions have effectively reduced the breakeven point at every RPM business. This lower cost structure will allow our industrial operations to improve performance compared to the final six months of fiscal 2009. We expect a recovery in our industrial markets sometime in the spring of 2010. Depending on the timing of the expected industrial market turnaround, we expect earnings per share for RPM to grow in the range of 5% to 25% on a consolidated basis for the fiscal year ending May 31, 2010, from the adjusted $1.05 per diluted share earned in fiscal 2009," he stated. Webcast and Conference Call Information Management will host a conference call to further discuss these results beginning at 10:00 a.m. EDT today. The call can be accessed by dialing 800-706-7749 or 617-614-3474 for international callers. Participants are asked to call the assigned number approximately 10 minutes before the conference call begins. The call, which will last approximately one hour, will be open to the public, but only financial analysts will be permitted to ask questions. The media and all other participants will be in a listen-only mode. For those unable to listen to the live call, a replay will be available from approximately 12:00 p.m. EDT on July 27, 2009 until 11:59 p.m. EDT on August 3, 2009. The replay can be accessed by dialing 888-286-8010 or 617-801-6888 for international callers. The access code is 25665861. The call also will be available both live and for replay, and as a written transcript, via the RPM web site at http://www.rpminc.com/. About RPM RPM International Inc., a holding company, owns subsidiaries that are world leaders in specialty coatings and sealants serving both industrial and consumer markets. RPM's industrial products include roofing systems, sealants, corrosion control coatings, flooring coatings and specialty chemicals. Industrial brands include Stonhard, Tremco, illbruck, Carboline, Day-Glo, Euco and Dryvit. RPM's consumer products are used by professionals and do-it-yourselfers for home maintenance and improvement, boat repair and maintenance, and by hobbyists. Consumer brands include Zinsser, Rust-Oleum, DAP, Varathane and Testors. For more information, contact P. Kelly Tompkins, executive vice president - administration and chief financial officer, at 330-273-5090 or . This press release contains "forward-looking statements" relating to our business. These forward-looking statements, or other statements made by us, are made based on our expectations and beliefs concerning future events impacting us, and are subject to uncertainties and factors (including those specified below) which are difficult to predict and, in many instances, are beyond our control. As a result, our actual results could differ materially from those expressed in or implied by any such forward-looking statements. These uncertainties and factors include (a) general economic conditions; (b) the price, supply and capacity of raw materials, including assorted pigments, resins, solvents and other natural gas- and oil-based materials; packaging, including plastic containers; and transportation services, including fuel surcharges; (c) continued growth in demand for our products; (d) legal, environmental and litigation risks inherent in our construction and chemicals businesses and risks related to the adequacy of our insurance coverage for such matters; (e) the effect of changes in interest rates; (f) the effect of fluctuations in currency exchange rates upon our foreign operations; (g) the effect of non-currency risks of investing in and conducting operations in foreign countries, including those relating to domestic and international political, social, economic and regulatory factors; (h) risks and uncertainties associated with our ongoing acquisition and divestiture activities; (i) risks related to the adequacy of our contingent liabilities, including for asbestos-related claims; and (j) other risks detailed in our filings with the Securities and Exchange Commission, including the risk factors set forth in our Annual Report on Form 10-K for the year ended May 31, 2008, as the same may be updated from time to time. We do not undertake any obligation to publicly update or revise any forward-looking statements to reflect future events, information or circumstances that arise after the date of this release. CONSOLIDATED STATEMENTS OF INCOME IN THOUSANDS, EXCEPT PER SHARE DATA AS REPORTED ------------------------------------------ Three Months Ended Year Ended May 31, May 31, -------------------- --------------------- 2009 2008 2009 2008 ---------- --------- ---------- ---------- (Unaudited) ------------------------------- Net Sales $857,341 $1,075,971 $3,368,167 $3,643,791 Cost of sales 499,225 620,319 2,015,078 2,145,254 --------- ---------- ---------- ---------- Gross profit 358,116 455,652 1,353,089 1,498,537 Selling, general & administrative expenses 259,215 312,506 1,096,505 1,124,419 Asbestos-related charges 288,100 288,100 Goodwill and other intangible asset impairments 15,462 15,462 Interest expense 12,151 15,500 54,460 60,476 Investment expense (income), net 6,603 (2,823) 5,794 (13,512) --------- ---------- ---------- ---------- Income (loss) before income taxes 64,685 (157,631) 180,868 39,054 Provision (benefit) for income taxes 25,379 (70,067) 61,252 (8,655) --------- ---------- ---------- ---------- Net Income (Loss) $39,306 $(87,564) $119,616 $47,709 ========= ========== ========== ========== Basic earnings (loss) per share of common stock $0.31 $(0.73) $0.95 $0.40 ========= ========== ========== ========== Diluted earnings (loss) per share of common stock $0.31 $(0.73) $0.93 $0.39 ========= ========== ========== ========== Average shares of common stock outstanding - basic 126,603 120,296 126,373 120,151 ========= ========== ========== ========== Average shares of common stock outstanding - diluted 127,499 120,296 128,255 130,539 ========= ========== ========== ========== ADJUSTED (a) ------------------------------------------ Three Months Ended Year Ended May 31, May 31, -------------------- --------------------- 2009 2008 2009 2008 ---------- --------- ---------- ---------- (Unaudited) ------------------------------------------ Net Sales $857,341 $1,075,971 $3,368,167 $3,643,791 Cost of sales 499,225 620,319 2,015,078 2,145,254 --------- ---------- ---------- ---------- Gross profit 358,116 455,652 1,353,089 1,498,537 Selling, general & administrative expenses 259,215 312,506 1,096,505 1,124,419 Asbestos-related charges Goodwill and other intangible asset impairments Interest expense 12,151 15,500 54,460 60,476 Investment expense (income), net 6,603 (2,823) 5,794 (13,512) --------- ---------- ---------- ---------- Income (loss) before income taxes 80,147 130,469 196,330 327,154 Provision (benefit) for income taxes 25,569 32,981 61,442 94,393 --------- ---------- ---------- ---------- Net Income (Loss) $54,578 $97,488 $134,888 $232,761 ========= ========== ========== ========== Basic earnings (loss) per share of common stock $0.43 $0.81 $1.07 $1.94 ========= ========== ========== ========== Diluted earnings (loss) per share of common stock $0.43 $0.75 $1.05 $1.81 ========= ========== ========== ========== Average shares of common stock outstanding - basic 126,603 120,296 126,373 120,151 ========= ========== ========== ========== Average shares of common stock outstanding - diluted 127,499 130,569 128,255 130,539 ========= ========== ========== ========== (a) Adjusted figures presented remove the impact of the asbestos- related charge recorded during the fourth fiscal quarter ended May 31, 2008, and the impact of the goodwill and other intangibles impairments recorded during the fourth fiscal quarter ended May 31, 2009. SUPPLEMENTAL SEGMENT INFORMATION IN THOUSANDS AS REPORTED ------------------------------------------ Three Months Ended Year Ended May 31, May 31, -------------------- --------------------- 2009 2008 2009 2008 ---------- --------- ---------- ---------- (Unaudited) ------------------------------- Industrial Segment $536,106 $685,986 $2,265,957 $2,367,970 Consumer Segment 321,235 389,985 1,102,210 1,275,821 --------- ---------- ---------- ---------- Total $857,341 $1,075,971 $3,368,167 $3,643,791 ========= ========== ========== ========== Gross Profit: Industrial Segment $229,791 $298,413 $942,820 $999,989 Consumer Segment 128,325 157,239 410,269 498,548 --------- ---------- ---------- ---------- Total $358,116 $455,652 $1,353,089 $1,498,537 ========= ========== ========== ========== Income (Loss) Before Income Taxes (b): Industrial Segment Income Before Income Taxes (b) $34,781 $89,202 $176,116 $259,630 Interest (Expense), Net (c) (439) (220) (676) (2,188) --------- ---------- ---------- ---------- EBIT (d) $35,220 $89,422 $176,792 $261,818 ========= ========== ========== ========== Consumer Segment Income Before Income Taxes (b) $51,523 $63,927 $102,311 $155,600 Interest (Expense), Net (c) (1,091) (2,746) (4,529) (5,451) --------- ---------- ---------- ---------- EBIT (d) $52,614 $66,673 $106,840 $161,051 ========= ========== ========== ========== Corporate/Other (Expense) Before Income Taxes (b) $(21,619) $(310,760) $(97,559) $(376,176) Interest (Expense), Net (c) (17,224) (9,711) (55,049) (39,325) --------- ---------- ---------- ---------- EBIT (d) $(4,395) $(301,049) $(42,510) $(336,851) ========= ========== ========== ========== Consolidated Income Before Income Taxes (b) $64,685 $(157,631) $180,868 $39,054 Interest (Expense), Net (c) (18,754) (12,677) (60,254) (46,964) --------- ---------- ---------- ---------- EBIT (d) $83,439 $(144,954) $241,122 $86,018 ========= ========== ========== ========== ADJUSTED (a) ------------------------------------------ Three Months Ended Year Ended May 31, May 31, -------------------- --------------------- 2009 2008 2009 2008 ---------- --------- ---------- ---------- (Unaudited) ------------------------------------------ Net Sales: Industrial Segment $536,106 $685,986 $2,265,957 $2,367,970 Consumer Segment 321,235 389,985 1,102,210 1,275,821 --------- ---------- ---------- ---------- Total $857,341 $1,075,971 $3,368,167 $3,643,791 ========= ========== ========== ========== Gross Profit: Industrial Segment $229,791 $298,413 $942,820 $999,989 Consumer Segment 128,325 157,239 410,269 498,548 --------- ---------- ---------- ---------- Total $358,116 $455,652 $1,353,089 $1,498,537 ========= ========== ========== ========== Income (Loss) Before Income Taxes (b): Industrial Segment Income Before Income Taxes (b) $50,243 $89,202 $191,578 $259,630 Interest (Expense), Net (c) (439) (220) (676) (2,188) --------- ---------- ---------- ---------- EBIT (d) $50,682 $89,422 $192,254 $261,818 ========= ========== ========== ========== Consumer Segment Income Before Income Taxes (b) $51,523 $63,927 $102,311 $155,600 Interest (Expense), Net (c) (1,091) (2,746) (4,529) (5,451) --------- ---------- ---------- ---------- EBIT (d) $52,614 $66,673 $106,840 $161,051 ========= ========== ========== ========== Corporate/Other (Expense) Before Income Taxes (b) $(21,619) $(22,660) $(97,559) $(88,076) Interest (Expense), Net (c) (17,224) (9,711) (55,049) (39,325) --------- ---------- ---------- ---------- EBIT (d) $(4,395) $(12,949) $(42,510) $(48,751) ========= ========== ========== ========== Consolidated Income Before Income Taxes (b) $80,147 $130,469 $196,330 $327,154 Interest (Expense), Net (c) (18,754) (12,677) (60,254) (46,964) --------- ---------- ---------- ---------- EBIT (d) $98,901 $143,146 $256,584 $374,118 ========= ========== ========== ========== (a) Adjusted figures presented remove the impact of the asbestos-related charge recorded during the fourth fiscal quarter ended May 31, 2008, and the impact of the goodwill and other intangibles impairments recorded during the fourth fiscal quarter ended May 31, 2009. (b) The presentation includes a reconciliation of Income (Loss) Before Income Taxes, a measure defined by Generally Accepted Accounting Principles (GAAP) in the United States, to EBIT. (c) Interest (expense), net includes the combination of interest expense and investment expense (income), net. (d) EBIT is defined as earnings (loss) before interest and taxes. We evaluate the profit performance of our segments based on income before income taxes, but also look to EBIT as a performance evaluation measure because interest expense is essentially related to corporate acquisitions, as opposed to segment operations. We believe EBIT is useful to investors for this purpose as well, using EBIT as a metric in their investment decisions. EBIT should not be considered an alternative to, or more meaningful than, operating income as determined in accordance with GAAP, since EBIT omits the impact of interest and taxes in determining operating performance, which represent items necessary to our continued operations, given our level of indebtedness and ongoing tax obligations. Nonetheless, EBIT is a key measure expected by and useful to our fixed income investors, rating agencies and the banking community all of whom believe, and we concur, that this measure is critical to the capital markets' analysis of our segments' core operating performance. We also evaluate EBIT because it is clear that movements in EBIT impact our ability to attract financing. Our underwriters and bankers consistently require inclusion of this measure in offering memoranda in conjunction with any debt underwriting or bank financing. EBIT may not be indicative of our historical operating results, nor is it meant to be predictive of potential future results. CONSOLIDATED BALANCE SHEETS IN THOUSANDS May 31, 2009 May 31, 2008 ------------ ------------ (Unaudited) Assets Current Assets Cash and cash equivalents $253,387 $231,251 Trade accounts receivable 661,593 841,795 Allowance for doubtful accounts (22,934) (24,554) ------- ------- Net trade accounts receivable 638,659 817,241 Inventories 406,175 476,149 Deferred income taxes 44,540 37,644 Prepaid expenses and other current assets 210,155 221,690 ------- ------- Total current assets 1,552,916 1,783,975 --------- --------- Property, Plant and Equipment, at Cost 1,056,555 1,054,719 Allowance for depreciation and amortization (586,452) (556,998) -------- -------- Property, plant and equipment, net 470,103 497,721 ------- ------- Other Assets Goodwill 856,166 908,358 Other intangible assets, net of amortization 358,097 384,370 Deferred income taxes, non-current 92,500 88,754 Other 80,139 100,389 ------ ------- Total other assets 1,386,902 1,481,871 --------- --------- Total Assets $3,409,921 $3,763,567 ========== ========== Liabilities and Stockholders' Equity Current Liabilities Accounts payable $294,814 $411,448 Current portion of long-term debt 168,547 6,934 Accrued compensation and benefits 124,138 151,493 Accrued loss reserves 77,393 71,981 Asbestos-related liabilities 65,000 65,000 Other accrued liabilities 119,270 139,505 ------- ------- Total current liabilities 849,162 846,361 ------- ------- Long-Term Liabilities Long-term debt, less current maturities 762,295 1,066,687 Asbestos-related liabilities 425,328 494,745 Other long-term liabilities 205,650 192,412 Deferred income taxes 23,815 26,806 ------ ------ Total long-term liabilities 1,417,088 1,780,650 --------- --------- Total liabilities 2,266,250 2,627,011 --------- --------- Stockholders' Equity Preferred stock; none issued Common stock (outstanding 128,501; 122,189) 1,285 1,222 Paid-in capital 780,967 612,441 Treasury stock, at cost (50,453) (6,057) Accumulated other comprehensive income (loss) (31,557) 101,162 Retained earnings 443,429 427,788 ------- ------- Total stockholders' equity 1,143,671 1,136,556 --------- --------- Total Liabilities and Stockholders' Equity $3,409,921 $3,763,567 ========== ========== CONSOLIDATED STATEMENTS OF CASH FLOWS IN THOUSANDS Year Ended ---------- May 31, May 31, 2009 2008 -------- -------- (Unaudited) Cash Flows From Operating Activities: Net income $119,616 $47,709 Adjustments to reconcile net income to net cash provided by operating activities: Depreciation 62,379 62,238 Amortization 22,765 23,128 Goodwill and other intangible asset impairments 15,462 Other-than-temporary impairments on marketable securities 15,062 1,409 Provision for asbestos-related liabilities 288,100 Deferred income taxes 1,136 (73,888) Other 6,692 11,751 Changes in assets and liabilities, net of effect from purchases and sales of businesses: Decrease (increase) in receivables 181,617 (55,056) Decrease (increase) in inventory 75,014 (28,361) Decrease (increase) in prepaid expenses and other current and long-term assets 18,024 (5,858) (Decrease) increase in accounts payable (119,327) 10,654 (Decrease) increase in accrued compensation and benefits (29,039) 15,810 Increase (decrease) in accrued loss reserves 5,167 (5,382) (Decrease) increase in other accrued liabilities (11,695) 14,426 Payments made for asbestos-related claims (69,417) (82,623) Other (26,461) 10,657 ------- ------ Cash From Operating Activities 266,995 234,714 ------- ------- Cash Flows From Investing Activities: Capital expenditures (54,986) (71,840) Acquisition of businesses, net of cash acquired (16,669) (123,130) Purchase of marketable securities (75,410) (110,225) Proceeds from sales of marketable securities 65,862 92,383 Proceeds from the sales of assets or businesses 852 46,544 Other (1,196) (2,946) ------ ------ Cash (Used For) Investing Activities (81,547) (169,214) ------- -------- Cash Flows From Financing Activities: Additions to long-term and short-term debt 56,816 251,765 Reductions of long-term and short-term debt (51,412) (181,074) Cash dividends (101,836) (90,638) Repurchase of stock (45,360) (6,057) Exercise of stock options 3,057 10,689 Tax benefit from exercise of stock options 131 3,792 --- ----- Cash (Used For) Financing Activities (138,604) (11,523) -------- ------- Effect of Exchange Rate Changes on Cash and Cash Equivalents (24,708) 18,258 ------- ------ Net Change in Cash and Cash Equivalents 22,136 72,235 Cash and Cash Equivalents at Beginning of Period 231,251 159,016 ------- ------- Cash and Cash Equivalents at End of Period $253,387 $231,251 ======== ======== DATASOURCE: RPM International Inc. CONTACT: P. Kelly Tompkins, executive vice president - administration and chief financial officer, RPM International Inc., +1-330-273-5090, Web Site: http://www.rpminc.com/

Copyright

1 Year RPM Chart

1 Year RPM Chart

1 Month RPM Chart

1 Month RPM Chart

Your Recent History

Delayed Upgrade Clock