
We could not find any results for:
Make sure your spelling is correct or try broadening your search.
| Share Name | Share Symbol | Market | Type |
|---|---|---|---|
| Offerpad Solutions Inc | NYSE:OPAD | NYSE | Common Stock |
| Price Change | % Change | Share Price | High Price | Low Price | Open Price | Shares Traded | Last Trade | |
|---|---|---|---|---|---|---|---|---|
| -0.08 | -1.65% | 4.77 | 5.06 | 4.769 | 4.99 | 17,632 | 17:20:36 |
UNITED STATES
SECURITIES AND EXCHANGE COMMISSION
WASHINGTON, D.C. 20549
FORM
CURRENT REPORT
Pursuant to Section 13 or 15(d)
of the Securities Exchange Act of 1934
Date of Report (Date of earliest event reported):
(Exact name of Registrant as Specified in Its Charter)
| (State or Other Jurisdiction of Incorporation) |
(Commission File Number) |
(IRS Employer Identification No.) |
| |
||
| (Address of Principal Executive Offices) | (Zip Code) |
Registrant’s Telephone Number, Including Area Code:
N/A
(Former Name or Former Address, if Changed Since Last Report)
Check the appropriate box below if the Form 8-K filing is intended to simultaneously satisfy the filing obligation of the registrant under any of the following provisions:
| Written communications pursuant to Rule 425 under the Securities Act (17 CFR 230.425) |
| Soliciting material pursuant to Rule 14a-12 under the Exchange Act (17 CFR 240.14a-12) |
| Pre-commencement communications pursuant to Rule 14d-2(b) under the Exchange Act (17 CFR 240.14d-2(b)) |
| Pre-commencement communications pursuant to Rule 13e-4(c) under the Exchange Act (17 CFR 240.13e-4(c)) |
Securities registered pursuant to Section 12(b) of the Act:
| Title of each class |
Trading Symbol(s) |
Name of each exchange on which registered | ||
Indicate by check mark whether the registrant is an emerging growth company as defined in Rule 405 of the Securities Act of 1933 (§ 230.405 of this chapter) or Rule 12b-2 of the Securities Exchange Act of 1934 (§ 240.12b-2 of this chapter).
Emerging growth company
If an emerging growth company, indicate by check mark if the registrant has elected not to use the extended transition period for complying with any new or revised financial accounting standards provided pursuant to Section 13(a) of the Exchange Act. ☐
| Item 2.02 | Results of Operations and Financial Condition. |
On August 2, 2023, Offerpad Solutions Inc. issued a press release announcing its financial results for the three and six months ended June 30, 2023 and a Shareholder Letter. A copy of the press release and the Shareholder Letter are furnished as Exhibit 99.1 and Exhibit 99.2, respectively, to this Current Report on Form 8-K.
The information in this Item 2.02, including the information contained in Exhibit 99.1 and Exhibit 99.2 of this Current Report on Form 8-K, is furnished herewith and shall not be deemed “filed” for purposes of Section 18 of the Securities Exchange Act of 1934, as amended (the “Exchange Act”), or otherwise subject to the liabilities under that section, nor shall it be deemed incorporated by reference in any filing under the Securities Act of 1933, as amended, or the Exchange Act, regardless of any general incorporation language in such filing.
| Item 9.01 | Financial Statements and Exhibits. |
(d) Exhibits
| Exhibit |
Exhibit Description | |
| 99.1 | Press Release of Offerpad Solutions Inc. dated August 2, 2023 | |
| 99.2 | Offerpad Solutions Inc. Shareholder Letter dated August 2, 2023 | |
| 104 | Cover Page Interactive Data File - the cover page XBRL tags are embedded within the Inline XBRL document. | |
SIGNATURES
Pursuant to the requirements of the Securities Exchange Act of 1934, the registrant has duly caused this report to be signed on its behalf by the undersigned thereunto duly authorized.
| Offerpad Solutions Inc. | ||||||
| Date: August 2, 2023 | By: | /s/ Jawad Ahsan | ||||
| Jawad Ahsan | ||||||
| Chief Financial Officer | ||||||
Exhibit 99.1

Offerpad Reports Second Quarter 2023 Results
Gross Profit increases 205% quarter over quarter
CHANDLER, Ariz. – August 2, 2023 – (BUSINESS WIRE) – Offerpad Solutions Inc. (“Offerpad”) (NYSE: OPAD), a leading tech-enabled platform for residential real estate, today released financial results for the three months ended June 30, 2023.
“We exceeded our financial expectations across the board,” said Brian Bair, Chairman and CEO of Offerpad. “Our outperformance in the second quarter reflects the improvements we have made to our business processes and our elevated focus on profitability through margin expansion and cost discipline. Our agile business model makes integrating improvements and adapting to changing market conditions part of our everyday culture,” said Bair.
Second quarter highlights include:
| • | Reported the highest gross margin since Q3 2021 at 9.7%; |
| • | Achieved gross margin per home sold on homes acquired after September 1, 2022 of 13.5%; |
| • | Achieved contribution margin after interest per home sold on homes acquired after September 1, 2022 of 9.5%, which is above Offerpad’s target range of 3% to 6%; |
| • | Reduced inventory aged over 180 days to less than 2%, well below Offerpad’s 10% target; and |
| • | Increased home acquisition volume from 364 homes in Q1 to 840 homes in Q2. |
“The combination of completing the sale of our legacy inventory and the high-quality homes currently on our balance sheet provides a strong foundation for performance going forward. The favorable quarter-over-quarter trends we saw during the first half of this year support our expectation to achieve positive Adjusted EBITDA by year-end,” said Bair.
Second Quarter 2023 Financial Results – compared with the prior quarter:
| • | Revenue was $230.1 million compared to $609.6 million |
| • | Gross Profit increased over 200% to $22.2 million from $7.3 million |
| • | Net Loss improved to ($22.3) million from ($59.4) million |
| • | Adjusted EBITDA improved to ($17.3) million from ($44.8) million |
| • | Diluted Loss Per Share improved to ($0.82) from ($2.51) |
Q2 2023 Financial Results (quarter over quarter)
| Q2 2023 | Q1 2023 | Percentage Change | ||||||||||
| Homes acquired |
840 | 364 | 131 | % | ||||||||
| Homes sold |
650 | 1,609 | (60 | %) | ||||||||
| Revenue |
$ | 230.1M | $ | 609.6M | (62 | %) | ||||||
| Gross profit1 |
$ | 22.2M | $ | 7.3M | 205 | % | ||||||
| Net loss1, 2 |
($ | 22.3M | ) | ($ | 59.4M | ) | 62 | % | ||||
| Adjusted EBITDA1 |
($ | 17.3M | ) | ($ | 44.8M | ) | 61 | % | ||||
| Gross profit per home sold |
$ | 34,200 | $ | 4,500 | 655 | % | ||||||
| Contribution loss after interest per home sold |
($ | 2,900 | ) | ($ | 46,900 | ) | 94 | % | ||||
| Cash and cash equivalents |
$ | 115.6M | $ | 107.7M | 7 | % | ||||||
| 1 | Includes $0.2 million charge in Q2 2023 and $7.3 million charge in Q1 2023 for an inventory valuation adjustment. |
| 2 | Includes $0.4 million non-cash credit in Q2 2023 and a $0.4 million non-cash charge in Q1 2023 to mark to market the Warrant Liability. |
Q2 2023 Financial Results (year over year)
| Q2 2023 | Q2 2022 | Percentage Change | ||||||||||
| Homes acquired |
840 | 3,792 | (78 | %) | ||||||||
| Homes sold |
650 | 2,888 | (77 | %) | ||||||||
| Revenue |
$ | 230.1M | $ | 1.1B | (79 | %) | ||||||
| Gross profit1 |
$ | 22.2M | $ | 93.0M | (76 | %) | ||||||
| Net (loss) income1, 2 |
($ | 22.3M | ) | $ | 11.6M | n.a. | ||||||
| Adjusted net loss1 |
($ | 22.8M | ) | ($ | 1.0M | ) | 2,225 | % | ||||
| Adjusted EBITDA1 |
($ | 17.3M | ) | $ | 13.7M | n.a. | ||||||
| Gross profit per home sold |
$ | 34,200 | $ | 32,200 | 6 | % | ||||||
| Contribution (loss) profit after interest per home sold |
($ | 2,900 | ) | $ | 28,500 | n.a. | ||||||
| Cash and cash equivalents |
$ | 115.6M | $ | 155.5M | (26 | %) | ||||||
| 1 | Includes $0.2 million charge in Q2 2023 and $21.2 million charge in Q2 2022 for an inventory valuation adjustment. |
| 2 | Includes $0.4 million non-cash credit in Q2 2023 and a $12.5 million non-cash credit in Q2 2022 to mark to market the Warrant Liability. |
Additional information regarding Offerpad’s second quarter 2023 financial results and management commentary can be found by accessing the Company’s Quarterly Letter to Shareholders on the Offerpad investor relations at investor.offerpad.com.
Third Quarter 2023 Outlook
“Our results in the first half of this year indicate that the business has stabilized and positive momentum is building,” said Jawad Ahsan, CFO of Offerpad. “In the third quarter, we expect that momentum to continue with sequential improvement in our key performance metrics, including Gross Margin, Net Loss and Adjusted EBITDA. We also expect Q3 to reflect quarter-over-quarter improvement in time to cash, as well as increases in Acquisitions, Inventory and Contribution Margin after Interest,” said Ahsan.
Offerpad is providing its third quarter outlook for 2023 as follows:
| Q3 2023 Outlook | ||||
| Homes Sold |
600 – 700 | |||
| Revenue |
$ | 200M – $240M | ||
| Adjusted EBITDA3 |
($17)M – ($9)M | |||
| 3 | See Non-GAAP financial measures below for an explanation of why a reconciliation of this guidance cannot be provided. |
Conference Call and Webcast Details
Offerpad Chairman and CEO Brian Bair and CFO Jawad Ahsan will host a conference call and accompanying webcast on August 2, 2023, at 12:30 p.m. ET. The webcast can be accessed on Offerpad’s Investor Relations at https://events.q4inc.com/attendee/385889934. Participants can register at https://www.netroadshow.com/events/login?show=5f5e222c&confId=51290 to receive a personalized dial in number and PIN. Access to a replay of the webcast will be available from the same website address shortly after the live webcast concludes.
About Offerpad
Offerpad’s mission is to deliver the best home buying and selling experience. From cash offers and flexible listing options to mortgages and buyer services, Offerpad has been helping homeowners since 2015. We pair our local expertise in residential real estate with proprietary technology to put you in control of the process and help find the right solution that fits your needs. Visit Offerpad.com for more information.
#OPAD_IR
Contacts
Investors
Investors@offerpad.com
Media
Press@Offerpad.com
Forward-Looking Statements
Certain statements in this press release may be considered forward-looking statements within the meaning of the Private Securities Litigation Reform Act of 1995. Forward-looking statements generally relate to future events or Offerpad’s future financial or operating performance. For example, statements regarding the anticipated quarter-over-quarter improvement in Offerpad’s time from acquisition to sale and increase in Offerpad’s acquisition volume, inventory and contribution margin for the third quarter 2023, Offerpad’s financial outlook, including increases in Offerpad’s key performance metrics, including Gross Margin, Net Loss and Adjusted EBITDA, for the third quarter 2023, and expectations regarding profitability, including the timing of reaching positive Adjusted EBITDA, are forward-looking statements. In some cases, you can identify forward-looking statements by
terminology such as “pro forma,” “may,” “should,” “could,” “might,” “plan,” “possible,” “project,” “strive,” “budget,” “forecast,” “expect,” “intend,” “will,” “estimate,” “anticipate,” “believe,” “predict,” “potential” or “continue,” or the negatives of these terms or variations of them or similar terminology. Such forward-looking statements are subject to risks, uncertainties, and other important factors that could cause actual results to differ materially from those expressed or implied by such forward-looking statements. Factors that may impact such forward-looking statements include, but are not limited to, Offerpad’s ability to respond to general economic conditions; the health of the U.S. residential real estate industry; Offerpad’s ability to grow market share in its existing markets or any new markets it may enter; Offerpad’s ability to manage its growth effectively; Offerpad’s ability to accurately value and manage inventory, and to maintain an adequate and desirable supply of inventory; Offerpad’s ability to successfully launch new product and service offerings, and to manage, develop and refine its technology platform; Offerpad’s ability to maintain and enhance its products and brand, and to attract customers; Offerpad’s ability to achieve and maintain profitability in the future; the success of strategic relationships with third parties; and Offerpad’s failure to meet the New York Stock Exchange’s continued listing standards. These and other important factors discussed under the caption “Risk Factors” in Offerpad’s Annual Report on Form 10-K for the year ended December 31, 2022 filed with the Securities and Exchange Commission on February 28, 2023, and Offerpad’s other reports filed with the Securities and Exchange Commission could cause actual results to differ materially from those indicated by the forward-looking statements made in this press release. These forward-looking statements are based upon estimates and assumptions that, while considered reasonable by Offerpad and its management, are inherently uncertain. Nothing in this press release should be regarded as a representation by any person that the forward-looking statements set forth herein will be achieved or that any of the contemplated results of such forward-looking statements will be achieved. You should not place undue reliance on forward-looking statements, which speak only as of the date they are made. Offerpad undertakes no obligation to update or revise any forward-looking statements, whether as a result of new information, future events or otherwise, except as may be required under applicable securities laws.
OFFERPAD SOLUTIONS INC.
Condensed Consolidated Statements of Operations
| Three Months Ended June 30, |
Six Months Ended June 30, |
|||||||||||||||
| (in thousands, except per share data) (Unaudited) | 2023 | 2022 | 2023 | 2022 | ||||||||||||
| Revenue |
$ | 230,147 | $ | 1,079,531 | $ | 839,726 | $ | 2,453,368 | ||||||||
| Cost of revenue |
207,916 | 986,550 | 810,210 | 2,228,245 | ||||||||||||
|
|
|
|
|
|
|
|
|
|||||||||
| Gross profit |
22,231 | 92,981 | 29,516 | 225,123 | ||||||||||||
|
|
|
|
|
|
|
|
|
|||||||||
| Operating expenses: |
||||||||||||||||
| Sales, marketing and operating |
29,040 | 65,239 | 71,391 | 135,127 | ||||||||||||
| General and administrative |
12,713 | 16,121 | 27,192 | 30,778 | ||||||||||||
| Technology and development |
2,312 | 3,243 | 4,553 | 6,425 | ||||||||||||
|
|
|
|
|
|
|
|
|
|||||||||
| Total operating expenses |
44,065 | 84,603 | 103,136 | 172,330 | ||||||||||||
|
|
|
|
|
|
|
|
|
|||||||||
| (Loss) income from operations |
(21,834 | ) | 8,378 | (73,620 | ) | 52,793 | ||||||||||
| Other income (expense): |
||||||||||||||||
| Change in fair value of warrant liabilities |
435 | 12,537 | 46 | 18,201 | ||||||||||||
| Interest expense |
(1,867 | ) | (7,771 | ) | (9,299 | ) | (14,967 | ) | ||||||||
| Other income, net |
965 | 24 | 1,247 | 28 | ||||||||||||
|
|
|
|
|
|
|
|
|
|||||||||
| Total other (expense) income |
(467 | ) | 4,790 | (8,006 | ) | 3,262 | ||||||||||
|
|
|
|
|
|
|
|
|
|||||||||
| (Loss) income before income taxes |
(22,301 | ) | 13,168 | (81,626 | ) | 56,055 | ||||||||||
| Income tax expense |
(43 | ) | (1,610 | ) | (165 | ) | (3,509 | ) | ||||||||
|
|
|
|
|
|
|
|
|
|||||||||
| Net (loss) income |
$ | (22,344 | ) | $ | 11,558 | $ | (81,791 | ) | $ | 52,546 | ||||||
|
|
|
|
|
|
|
|
|
|||||||||
| Net (loss) income per share, basic |
$ | (0.82 | ) | $ | 0.71 | $ | (3.21 | ) | $ | 3.24 | ||||||
|
|
|
|
|
|
|
|
|
|||||||||
| Net (loss) income per share, diluted |
$ | (0.82 | ) | $ | 0.66 | $ | (3.21 | ) | $ | 3.03 | ||||||
|
|
|
|
|
|
|
|
|
|||||||||
| Weighted average common shares outstanding, basic |
27,258 | 16,390 | 25,470 | 16,200 | ||||||||||||
|
|
|
|
|
|
|
|
|
|||||||||
| Weighted average common shares outstanding, diluted |
27,258 | 17,383 | 25,470 | 17,346 | ||||||||||||
|
|
|
|
|
|
|
|
|
|||||||||
OFFERPAD SOLUTIONS INC.
Condensed Consolidated Balance Sheets
| (in thousands, except par value per share) (Unaudited) | June 30, 2023 |
December 31, 2022 |
||||||
| ASSETS |
||||||||
| Current assets: |
||||||||
| Cash and cash equivalents |
$ | 115,599 | $ | 97,241 | ||||
| Restricted cash |
6,658 | 43,058 | ||||||
| Accounts receivable |
1,479 | 2,350 | ||||||
| Real estate inventory |
211,119 | 664,697 | ||||||
| Prepaid expenses and other current assets |
8,731 | 6,833 | ||||||
|
|
|
|
|
|||||
| Total current assets |
343,586 | 814,179 | ||||||
| Property and equipment, net |
4,874 | 5,194 | ||||||
| Other non-current assets |
4,641 | 5,696 | ||||||
|
|
|
|
|
|||||
| TOTAL ASSETS |
$ | 353,101 | $ | 825,069 | ||||
|
|
|
|
|
|||||
| LIABILITIES AND STOCKHOLDERS’ EQUITY |
||||||||
| Current liabilities: |
||||||||
| Accounts payable |
$ | 6,340 | $ | 4,647 | ||||
| Accrued and other current liabilities |
19,272 | 28,252 | ||||||
| Secured credit facilities and other debt, net |
161,316 | 605,889 | ||||||
| Secured credit facilities and other debt - related party |
29,926 | 60,176 | ||||||
|
|
|
|
|
|||||
| Total current liabilities |
216,854 | 698,964 | ||||||
| Warrant liabilities |
493 | 539 | ||||||
| Other long-term liabilities |
2,543 | 3,689 | ||||||
|
|
|
|
|
|||||
| Total liabilities |
219,890 | 703,192 | ||||||
|
|
|
|
|
|||||
| Commitments and contingencies |
||||||||
| Stockholders’ equity: |
||||||||
| Class A common stock, $0.0001 par value; 2,000,000 shares authorized; 27,225 and 15,491 shares issued and outstanding as of June 30, 2023 and December 31, 2022, respectively |
3 | 2 | ||||||
| Class B common stock, zero shares authorized, issued and outstanding as of June 30, 2023; and $0.0001 par value, 20,000 shares authorized; 988 shares issued and outstanding as of December 31, 2022 |
— | — | ||||||
| Additional paid in capital |
495,668 | 402,544 | ||||||
| Accumulated deficit |
(362,460 | ) | (280,669 | ) | ||||
|
|
|
|
|
|||||
| Total stockholders’ equity |
133,211 | 121,877 | ||||||
|
|
|
|
|
|||||
| TOTAL LIABILITIES AND STOCKHOLDERS’ EQUITY |
$ | 353,101 | $ | 825,069 | ||||
|
|
|
|
|
|||||
OFFERPAD SOLUTIONS INC.
Condensed Consolidated Statements of Cash Flows
| Six Months Ended June 30, |
||||||||
| ($ in thousands) (Unaudited) | 2023 | 2022 | ||||||
| Cash flows from operating activities: |
||||||||
| Net (loss) income |
$ | (81,791 | ) | $ | 52,546 | |||
| Adjustments to reconcile net (loss) income to net cash provided by (used in) operating activities: |
||||||||
| Depreciation |
380 | 249 | ||||||
| Amortization of debt financing costs |
1,980 | 1,546 | ||||||
| Real estate inventory valuation adjustment |
7,454 | 22,205 | ||||||
| Stock-based compensation |
3,898 | 4,028 | ||||||
| Change in fair value of warrant liabilities |
(46 | ) | (18,201 | ) | ||||
| Change in fair value of derivative instrument |
715 | — | ||||||
| Loss on disposal of property and equipment |
30 | — | ||||||
| Changes in operating assets and liabilities: |
||||||||
| Accounts receivable |
871 | (6,764 | ) | |||||
| Real estate inventory |
446,124 | (179,060 | ) | |||||
| Prepaid expenses and other assets |
313 | (5,847 | ) | |||||
| Accounts payable |
1,693 | 4,306 | ||||||
| Accrued and other liabilities |
(10,126 | ) | 12,513 | |||||
|
|
|
|
|
|||||
| Net cash provided by (used in) operating activities |
371,495 | (112,479 | ) | |||||
|
|
|
|
|
|||||
| Cash flows from investing activities: |
||||||||
| Purchases of property and equipment |
(90 | ) | (725 | ) | ||||
| Purchases of derivative instruments |
(1,872 | ) | — | |||||
|
|
|
|
|
|||||
| Net cash used in investing activities |
(1,962 | ) | (725 | ) | ||||
|
|
|
|
|
|||||
| Cash flows from financing activities: |
||||||||
| Borrowings from credit facilities and other debt |
411,990 | 2,132,189 | ||||||
| Repayments of credit facilities and other debt |
(889,773 | ) | (2,017,985 | ) | ||||
| Payment of debt financing costs |
(172 | ) | (35 | ) | ||||
| Borrowings from warehouse lending facility |
18,488 | — | ||||||
| Repayments of warehouse lending facility |
(17,336 | ) | — | |||||
| Proceeds from issuance of pre-funded warrants |
90,000 | — | ||||||
| Proceeds from exercise of pre-funded warrants |
11 | — | ||||||
| Issuance cost of pre-funded warrants |
(784 | ) | — | |||||
| Proceeds from exercise of stock options |
53 | 4,775 | ||||||
| Payments for taxes related to stock-based awards |
(52 | ) | (235 | ) | ||||
|
|
|
|
|
|||||
| Net cash (used in) provided by financing activities |
(387,575 | ) | 118,709 | |||||
|
|
|
|
|
|||||
| Net change in cash, cash equivalents and restricted cash |
(18,042 | ) | 5,505 | |||||
| Cash, cash equivalents and restricted cash, beginning of period |
140,299 | 194,433 | ||||||
|
|
|
|
|
|||||
| Cash, cash equivalents and restricted cash, end of period |
$ | 122,257 | $ | 199,938 | ||||
|
|
|
|
|
|||||
| Reconciliation of cash, cash equivalents and restricted cash to the condensed consolidated balance sheet: |
||||||||
| Cash and cash equivalents |
$ | 115,599 | $ | 155,464 | ||||
| Restricted cash |
6,658 | 44,474 | ||||||
|
|
|
|
|
|||||
| Total cash, cash equivalents and restricted cash |
$ | 122,257 | $ | 199,938 | ||||
|
|
|
|
|
|||||
| Supplemental disclosure of cash flow information: |
||||||||
| Cash payments for interest |
$ | 13,932 | $ | 19,941 | ||||
Non-GAAP Financial Measures
In addition to Offerpad’s results of operations above, Offerpad reports certain financial measures that are not required by, or presented in accordance with, U.S. generally accepted accounting principles (“GAAP”). These measures have limitations as analytical tools when assessing Offerpad’s operating performance and should not be considered in isolation or as a substitute for GAAP measures, including gross profit and net income.
Offerpad may calculate or present its non-GAAP financial measures differently than other companies who report measures with similar titles and, as a result, the non-GAAP financial measures Offerpad reports may not be comparable with those of companies in Offerpad’s industry or in other industries. Offerpad has not provided a quantitative reconciliation of forecasted Adjusted EBITDA to forecasted net income (loss) within this press release because Offerpad is unable to calculate certain reconciling items without making unreasonable efforts. These items, which include, but are not limited to, stock-based compensation with respect to future grants and forfeitures, could materially affect the computation of forward-looking net income (loss), are inherently uncertain and depend on various factors, some of which are outside of Offerpad’s control.
Adjusted Gross Profit, Contribution Profit, and Contribution Profit After Interest (and related margins)
To provide investors with additional information regarding Offerpad’s margins, Offerpad has included Adjusted Gross Profit, Contribution Profit, and Contribution Profit After Interest (and related margins), which are non-GAAP financial measures. Offerpad believes that Adjusted Gross Profit, Contribution Profit, and Contribution Profit After Interest are useful financial measures for investors as they are used by management in evaluating unit level economics and operating performance across Offerpad’s markets. Each of these measures is intended to present the economics related to homes sold during a given period. Offerpad does so by including revenue generated from homes sold (and ancillary services) in the period and only the expenses that are directly attributable to such home sales, even if such expenses were recognized in prior periods, and excluding expenses related to homes that remain in real estate inventory as of the end of the period presented. Contribution Profit provides investors a measure to assess Offerpad’s ability to generate returns on homes sold during a reporting period after considering home acquisition costs, renovation and repair costs, and adjusting for holding costs and selling costs. Contribution Profit After Interest further impacts gross profit by including interest costs (including senior and mezzanine secured credit facilities) attributable to homes sold during a reporting period. Offerpad believes these measures facilitate meaningful period over period comparisons and illustrate Offerpad’s ability to generate returns on assets sold after considering the costs directly related to the assets sold in a presented period.
Adjusted Gross Profit, Contribution Profit and Contribution Profit After Interest (and related margins) are supplemental measures of Offerpad’s operating performance and have limitations as analytical tools. For example, these measures include costs that were recorded in prior periods under GAAP and exclude, in connection with homes held in real estate inventory at the end of the period, costs required to be recorded under GAAP in the same period.
Accordingly, these measures should not be considered in isolation or as a substitute for analysis of Offerpad’s results as reported under GAAP. Offerpad includes a reconciliation of these measures to the most directly comparable GAAP financial measure, which is gross profit.
Adjusted Gross Profit / Margin
Offerpad calculates Adjusted Gross Profit as gross profit under GAAP adjusted for (1) net real estate inventory valuation adjustment plus (2) interest expense associated with homes sold in the presented period and recorded in cost of revenue. Net real estate inventory valuation adjustment is calculated by adding back the real estate inventory valuation adjustment charges recorded during the period on homes that remain in real estate inventory at period end and subtracting the real estate inventory valuation adjustment charges recorded in prior periods on homes sold in the current period. Offerpad defines Adjusted Gross Margin as Adjusted Gross Profit as a percentage of revenue.
Offerpad views this metric as an important measure of business performance, as it captures gross margin performance isolated to homes sold in a given period and provides comparability across reporting periods. Adjusted Gross Profit helps management assess performance across the key phases of processing a home (acquisitions, renovations, and resale) for a specific resale cohort.
Contribution Profit / Margin
Offerpad calculates Contribution Profit as Adjusted Gross Profit, minus (1) direct selling costs incurred on homes sold during the presented period, minus (2) holding costs incurred in the current period on homes sold during the period recorded in sales, marketing, and operating, minus (3) holding costs incurred in prior periods on homes sold in the current period recorded in sales, marketing, and operating, plus (4) other income, net which is primarily comprised of interest income earned on our cash and cash equivalents and fair value adjustments of derivative financial instruments. The composition of Offerpad’s holding costs is described in the footnotes to the reconciliation table below. Offerpad defines Contribution Margin as Contribution Profit as a percentage of revenue.
Offerpad views this metric as an important measure of business performance as it captures the unit level performance isolated to homes sold in a given period and provides comparability across reporting periods. Contribution Profit helps management assess inflows and outflow directly associated with a specific resale cohort.
Contribution Profit / Margin After Interest
Offerpad defines Contribution Profit After Interest as Contribution Profit, minus (1) interest expense associated with homes sold in the presented period and recorded in cost of revenue, minus (2) interest expense associated with homes sold in the presented period, recorded in costs of sales, and previously excluded from Adjusted Gross Profit, and minus (3) interest expense under Offerpad’s senior and mezzanine secured credit facilities incurred on homes sold during the period. This includes interest expense recorded in prior periods in which the sale occurred. Offerpad’s senior and mezzanine secured credit facilities are secured by their homes in real estate inventory and drawdowns are made on a per-home basis at the time of purchase and are required to be repaid at the time the homes are sold. Offerpad defines Contribution Margin After Interest as Contribution Profit After Interest as a percentage of revenue.
Offerpad views this metric as an important measure of business performance. Contribution Profit After Interest helps management assess Contribution Margin performance, per above, when fully burdened with costs of financing.
The following tables present a reconciliation of Offerpad’s Adjusted Gross (Loss) Profit, Contribution (Loss) Profit and Contribution (Loss) Profit After Interest to Offerpad’s Gross (Loss) Profit, which is the most directly comparable GAAP measure, and Contribution (Loss) Profit Per Home Sold and Contribution (Loss) Profit After Interest Per Home Sold to Offerpad’s Gross (Loss) Profit Per Home Sold, which is the most directly comparable GAAP measure, for the periods indicated:
| Three Months Ended June 30, |
Six Months Ended June 30, |
|||||||||||||||
| (in thousands, except percentages and homes sold, unaudited) | 2023 | 2022 | 2023 | 2022 | ||||||||||||
| Gross profit (GAAP) |
$ | 22,231 | $ | 92,981 | $ | 29,516 | $ | 225,123 | ||||||||
| Gross margin |
9.7 | % | 8.6 | % | 3.5 | % | 9.2 | % | ||||||||
| Homes sold |
650 | 2,888 | 2,259 | 6,490 | ||||||||||||
| Gross profit per home sold |
$ | 34.2 | $ | 32.2 | $ | 13.1 | $ | 34.7 | ||||||||
| Adjustments: |
||||||||||||||||
| Real estate inventory valuation adjustment - current period (1) |
169 | 20,995 | 290 | 21,233 | ||||||||||||
| Real estate inventory valuation adjustment - prior period (2) |
(13,679 | ) | (287 | ) | (58,030 | ) | (1,205 | ) | ||||||||
| Interest expense capitalized (3) |
1,358 | 2,793 | 6,035 | 7,071 | ||||||||||||
|
|
|
|
|
|
|
|
|
|||||||||
| Adjusted gross profit (loss) |
$ | 10,079 | $ | 116,482 | $ | (22,189 | ) | $ | 252,222 | |||||||
| Adjusted gross margin |
4.4 | % | 10.8 | % | -2.6 | % | 10.3 | % | ||||||||
| Adjustments: |
||||||||||||||||
| Direct selling costs (4) |
(5,743 | ) | (23,524 | ) | (23,804 | ) | (55,378 | ) | ||||||||
| Holding costs on sales - current period (5)(6) |
(269 | ) | (1,293 | ) | (1,811 | ) | (3,723 | ) | ||||||||
| Holding costs on sales - prior period (5)(7) |
(567 | ) | (526 | ) | (2,158 | ) | (907 | ) | ||||||||
| Other income, net (8) |
965 | 24 | 1,247 | 28 | ||||||||||||
|
|
|
|
|
|
|
|
|
|||||||||
| Contribution profit (loss) |
$ | 4,465 | $ | 91,163 | $ | (48,715 | ) | $ | 192,242 | |||||||
| Contribution margin |
1.9 | % | 8.4 | % | -5.8 | % | 7.8 | % | ||||||||
| Homes sold |
650 | 2,888 | 2,259 | 6,490 | ||||||||||||
| Contribution profit (loss) per home sold |
$ | 6.9 | $ | 31.6 | $ | (21.6 | ) | $ | 29.6 | |||||||
| Adjustments: |
||||||||||||||||
| Interest expense capitalized (3) |
(1,358 | ) | (2,793 | ) | (6,035 | ) | (7,071 | ) | ||||||||
| Interest expense on homes sold - current period (9) |
(1,292 | ) | (4,115 | ) | (8,631 | ) | (11,149 | ) | ||||||||
| Interest expense on homes sold - prior period (10) |
(3,708 | ) | (1,999 | ) | (13,899 | ) | (3,721 | ) | ||||||||
|
|
|
|
|
|
|
|
|
|||||||||
| Contribution (loss) profit after interest |
$ | (1,893 | ) | $ | 82,256 | $ | (77,280 | ) | $ | 170,301 | ||||||
| Contribution margin after interest |
-0.8 | % | 7.6 | % | -9.2 | % | 6.9 | % | ||||||||
| Homes sold |
650 | 2,888 | 2,259 | 6,490 | ||||||||||||
| Contribution (loss) profit after interest per home sold |
$ | (2.9 | ) | $ | 28.5 | $ | (34.2 | ) | $ | 26.2 | ||||||
| (1) | Real estate inventory valuation adjustment – current period is the real estate inventory valuation adjustments recorded during the period presented associated with homes that remain in real estate inventory at period end. |
| (2) | Real estate inventory valuation adjustment – prior period is the Real estate inventory valuation adjustments recorded in prior periods associated with homes that sold in the period presented. |
| (3) | Interest expense capitalized represents all interest related costs, including senior and mezzanine secured credit facilities, incurred on homes sold in the period presented that were capitalized and expensed in cost of sales at the time of sale. |
| (4) | Direct selling costs represents selling costs incurred related to homes sold in the period presented. This primarily includes broker commissions and title and escrow closing fees. |
| (5) | Holding costs primarily include insurance, utilities, homeowners association dues, property taxes, cleaning, and maintenance costs. |
| (6) | Represents holding costs incurred on homes sold in the period presented and expensed to Sales, marketing, and operating on the Condensed Consolidated Statements of Operations. |
| (7) | Represents holding costs incurred in prior periods on homes sold in the period presented and expensed to Sales, marketing, and operating on the Condensed Consolidated Statements of Operations. |
| (8) | Other income, net principally represents interest income earned on our cash and cash equivalents and fair value adjustments of derivative financial instruments. |
| (9) | Represents both senior and mezzanine interest expense incurred on homes sold in the period presented and expensed to interest expense on the Condensed Consolidated Statements of Operations. |
| (10) | Represents both senior and mezzanine secured credit facilities interest expense incurred in prior periods on homes sold in the period presented and expensed to Interest expense on the Condensed Consolidated Statements of Operations. |
| Three Months Ended June 30, 2023 |
||||||||||||
| (in thousands, except percentages and homes sold, unaudited) | Acquired Aug’22 & Prior | Acquired Sep’22 & Later Cohort | Total | |||||||||
| Gross profit (GAAP) |
$ | 329.00 | $ | 21,902.00 | $ | 22,231.00 | ||||||
| Gross margin |
0.5 | % | 13.5 | % | 9.7 | % | ||||||
| Homes sold |
159 | 491 | 650 | |||||||||
| Gross profit per home sold |
$ | 2.1 | $ | 44.6 | $ | 34.2 | ||||||
| Adjustments: |
||||||||||||
| Inventory valuation adjustment - current period (1) |
105 | 64 | 169 | |||||||||
| Inventory valuation adjustment - prior period (2) |
(11,990 | ) | (1,689 | ) | (13,679 | ) | ||||||
| Interest expense capitalized (3) |
669 | 689 | 1,358 | |||||||||
|
|
|
|
|
|
|
|||||||
| Adjusted (loss) gross profit |
$ | (10,887 | ) | $ | 20,966 | $ | 10,079 | |||||
| Adjusted gross margin |
-16.0 | % | 12.9 | % | 4.4 | % | ||||||
| Adjustments: |
||||||||||||
| Direct selling costs (4) |
(1,790 | ) | (3,953 | ) | (5,743 | ) | ||||||
| Holding costs on sales - current period (5)(6) |
(93 | ) | (176 | ) | (269 | ) | ||||||
| Holding costs on sales - prior period (5)(7) |
(467 | ) | (100 | ) | (567 | ) | ||||||
| Other income, net (8) |
— | 965 | 965 | |||||||||
|
|
|
|
|
|
|
|||||||
| Contribution (loss) profit |
$ | (13,237 | ) | $ | 17,702 | $ | 4,465 | |||||
| Contribution margin |
-19.5 | % | 10.9 | % | 1.9 | % | ||||||
| Homes sold |
159 | 491 | 650 | |||||||||
| Contribution (loss) profit per home sold |
$ | (83.3 | ) | $ | 36.1 | $ | 6.9 | |||||
| Adjustments: |
||||||||||||
| Interest expense capitalized (3) |
(669 | ) | (689 | ) | (1,358 | ) | ||||||
| Interest expense on homes sold - current period (9) |
(397 | ) | (895 | ) | (1,292 | ) | ||||||
| Interest expense on homes sold - prior period (10) |
(2,962 | ) | (746 | ) | (3,708 | ) | ||||||
|
|
|
|
|
|
|
|||||||
| Contribution (loss) profit after interest |
$ | (17,265 | ) | $ | 15,372 | $ | (1,893 | ) | ||||
| Contribution margin after interest |
-25.4 | % | 9.5 | % | -0.8 | % | ||||||
| Homes sold |
159 | 491 | 650 | |||||||||
| Contribution (loss) profit after interest per home sold |
$ | (108.6 | ) | $ | 31.3 | $ | (2.9 | ) | ||||
Adjusted Net Income (Loss) and Adjusted EBITDA
Offerpad also presents Adjusted Net Income (Loss) and Adjusted EBITDA, which are non-GAAP financial measures, which the management team uses to assess Offerpad’s underlying financial performance. Offerpad believes these measures provide insight into period over period performance, adjusted for non-recurring or non-cash items.
Offerpad calculates Adjusted Net Income (Loss) as GAAP Net Income (Loss) adjusted for the change in fair value of warrant liabilities. Offerpad defines Adjusted Net Income (Loss) Margin as Adjusted Net Income (Loss) as a percentage of revenue.
Offerpad calculates Adjusted EBITDA as Adjusted Net Income (Loss) adjusted for interest expense, amortization of capitalized interest, taxes, depreciation and amortization and stock-based compensation expense. Offerpad defines Adjusted EBITDA Margin as Adjusted EBITDA as a percentage of revenue.
Adjusted Net Income (Loss) and Adjusted EBITDA are supplemental to Offerpad’s operating performance measures calculated in accordance with GAAP and have important limitations. For
example, Adjusted Net Income (Loss) and Adjusted EBITDA exclude the impact of certain costs required to be recorded under GAAP and could differ substantially from similarly titled measures presented by other companies in Offerpad’s industry or companies in other industries. Accordingly, these measures should not be considered in isolation or as a substitute for analysis of Offerpad’s results as reported under GAAP.
The following table presents a reconciliation of Offerpad’s Adjusted Net Income (Loss) and Adjusted EBITDA to their GAAP Net Income (Loss), which is the most directly comparable GAAP measure, for the periods indicated:
| Three Months Ended June 30, |
Six Months Ended June 30, |
|||||||||||||||
| (in thousands, except percentages, unaudited) | 2023 | 2022 | 2023 | 2022 | ||||||||||||
| Net (loss) income (GAAP) |
$ | (22,344 | ) | $ | 11,558 | $ | (81,791 | ) | $ | 52,546 | ||||||
| Change in fair value of warrant liabilities |
(435 | ) | (12,537 | ) | (46 | ) | (18,201 | ) | ||||||||
|
|
|
|
|
|
|
|
|
|||||||||
| Adjusted net (loss) income |
$ | (22,779 | ) | $ | (979 | ) | $ | (81,837 | ) | $ | 34,345 | |||||
| Adjusted net (loss) income margin |
(9.9 | %) | (0.1 | %) | (9.7 | %) | 1.4 | % | ||||||||
| Adjustments: |
||||||||||||||||
| Interest expense |
1,867 | 7,771 | 9,299 | 14,967 | ||||||||||||
| Amortization of capitalized interest (1) |
1,358 | 2,793 | 6,035 | 7,071 | ||||||||||||
| Income tax expense |
43 | 1,610 | 165 | 3,509 | ||||||||||||
| Depreciation and amortization |
178 | 130 | 380 | 249 | ||||||||||||
| Amortization of stock-based compensation |
2,055 | 2,400 | 3,898 | 4,028 | ||||||||||||
|
|
|
|
|
|
|
|
|
|||||||||
| Adjusted EBITDA |
(17,278 | ) | 13,725 | (62,060 | ) | 64,169 | ||||||||||
| Adjusted EBITDA margin |
(7.5 | %) | 1.3 | % | (7.4 | %) | 2.6 | % | ||||||||
| (1) | Amortization of capitalized interest represents all interest related costs, including senior and mezzanine interest related costs, incurred on homes sold in the period presented that were capitalized and expensed in cost of sales at the time of sale. |
Exhibit 99.2

Offerpad Offerpad SOLD LETTER TO SHAREHOLDERS Q2 | 2023

Q2 2023 RESULTS REVENUE $230.1M GROSS PROFIT $22.2M or 9.7% HOMES SOLD 650 HOMES ACQUIRED 840 MOVE FREELY America More than doubled our acquisition volume from Q1 to Q2 Reduced aged inventory over 180 days to less than 2% Reported our highest Gross Margin since Q3 2021 at 9.7% 2 | Q2 2023

Offerpad OUR MISSION PROVIDE YOUR BEST WAY TO BUY AND SELL A HOME. PERIOD 04 Welcome to Offerpad 05 Letter to Shareholders 06 Investment Highlights 07 Customer Feedback 08 Business Highlights 09 Financial Results Summary 12 Third Quarter 2023 Outlook 13 Appendix 3 | Q2 2023o
WELCOME TO OFFERPAD HOW ARE WE DIFFERENT? 1 Providing Solutions for All Things Home We are offering services to meet homeowners’ needs beyond just buying and selling. 2 Offering Customizable Options With multiple service offerings to choose from, homeowners can create customizable solutions to best meet their needs. 3 Building Sustainable Growth Our focus is on growing in a responsible and disciplined manner that balances our goal of increasing market share with achieving long-term sustainable profitability. 4 Utilizing Industry Expertise Our real estate experts provide deep, local real estate expertise to ensure we are accounting for the unique market conditions in each location to optimize performance. 5 Adding Value Through Renovations Our renovations team can navigate both less traditional and larger renovation projects, expanding our customer base and adding value to each home. 6 Applying Flexibility We use real time market data and sentiment to anticipate and integrate changes in market conditions into our model. Our agility and flexibility mitigate external risk factors. 4 | Q2 2023 Offerpad SOLD

DEAR SHAREHOLDERS, The first half of 2023 has brought new optimism and increased confidence across the real estate industry. Visibility has improved and the market has continued to stabilize. Even better, the changes we have made to our processes and the strategy we have established for 2023 are paying off. Our second quarter operational performance and financial results continued the quarter over quarter sequential improvement that started in Q1. In the second quarter, we beat our financial guidance expectations. Our homes sold, Revenue and Adjusted EBITDA all exceeded the top end of our second-quarter guidance ranges. We sold 650 homes exceeding the top end of our range by 100 homes, and we produced $230 million of Revenue, 15% above the high end of our range. Adjusted EBITDA was negative $17.3 million which is a 61% improvement over Q1 and exceeded the top end of our Q2 range by 31%. This outperformance reflects the improvements we have made to our business processes and our elevated focus on profitability through margin expansion and cost discipline. Other highlights for the quarter include: Reported our highest Gross Margin since Q3 2021 at 9.7%; Achieved gross margin per home sold on homes acquired after September 1, 2022 of 13.5%; Achieved contribution margin after interest per home sold on homes acquired after September 1, 2022 of 9.5%, which is above our target range of 3% to 6%; Reduced inventory aged over 180 days to less than 2%, well below our 10% target; and Increased home acquisition volume from 364 homes in Q1 to 840 homes in Q2. We emphasized last quarter that our plan to produce positive Adjusted EBITDA by year-end is not dependent on market acceleration. We were prepared to perform through this period of depressed residential resale transaction volumes and that is exactly what we did in the second quarter. We remain confident in our ability to execute our 2023 plan. We have proven our ability to scale before and we have the opportunity to do it again, but with the added benefit of additional experience. Our processes, products and people continue to evolve providing more efficiency and increased value. We set out to change the way real estate transacts forever and that is exactly what we are doing. Brian Bair | Chairman and CEO 5 | Q2 2023

INVESTMENT HIGHLIGHTS Large Addressable Market Offerpad operates in the residential real estate industry with a Total Addressable Market of approximately $2.3T. Focused Business Model Offerpad is focused on responsible, long-term growth powered by our real estate expertise and advanced, proprietary algorithms that help optimize each transaction. Competitive Differentiation Offerpad’s suite of real estate services provides customizable options to meet each customer’s needs. Attractive Growth Profile Offerpad’s growth is fueled by increasing our existing market penetration and the rollout of additional ancillary services that create diversified revenue streams and increase the value proposition for our shareholders. AWESOME DIFFERENT 6 | Q2 2023

9 OUT OF 10 WOULD RECOMMEND TO A FRIEND* +64 NET PROMOTER SCORE* “Above and beyond” Donald and Barbara in Missouri “Amazing from start to finish” Jeremy and Dana in Florida 92% CUSTOMER SATISFACTION* “Very pleased with the entire process” Richard and Kimberly in Texas * Based on survey of approximately 382 customers who sold their home to Offerpad in Q2 2023. 7 | Q2 2023

BUSINESS HIGHLIGHTS Technology updates support process efficiencies and customer experience Offerpad’s continuous improvement culture has been a key driver supporting its ability to meet and exceed their financial goals this year. The company recently made technology advances with its customer facing app. Upgraded features deliver meaningful and relevant information to sellers, granting full visibility from request to closing. Customer App Upgrades Offerpad’s enhanced customer app supports its commitment to provide a simple and convenient customer experience. Customers can manage the entire transaction from their phone or laptop. New features will include: a seller to-do list, next steps, a calendar for tracking important dates, a resource center, and a tracker to instantly check the status of a transaction. Photos, and documents can be uploaded, signed and saved within the app. Customers can also chat with their dedicated Offerpad Customer Success team member. 8 | Q2 2023

Q2 2023 FINANCIAL RESULTS SUMMARY Compared with Q1 2023 Revenue decreased 62% to $230.1M Acquired 840 homes, an increase of 131% Sold 650 homes, a decrease of 60% Gross profit increased from $7.3M to $22.2M1 Net loss improved from ($59.4M) to ($22.3M)1 Net loss includes a $0.4M non-cash credit in Q2 2023 and a $0.4 million non-cash charge in Q1 2023 to mark to market the Warrant Liability Adjusted EBITDA improved from ($44.8M) to ($17.3M)1 Gross profit per home sold improved from $4,500 to $34,200 Achieved gross margin per home sold on homes acquired after September 1, 2022 of 13.5%; Contribution loss after interest per home sold improved from ($46,900) to ($2,900) 1 Includes $0.2 million charge in Q2 2023 and $7.3 million charge in Q1 2023 for inventory valuation adjustment Live, Laugh, Offerpad 9 | Q2 2023
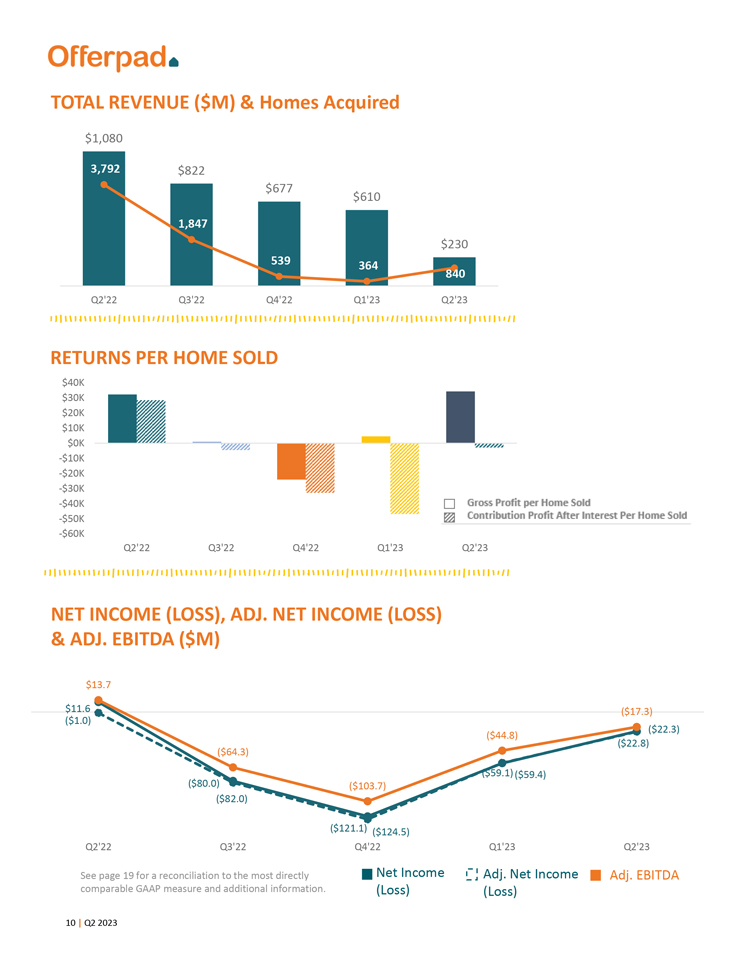
Offerpad TOTAL REVENUE ($M) & Homes Acquired $1,080 3,792 Q2’22 $822 1,847 Q3’22 $677 539 Q4’22 $610 364 Q1’23 $230 840 Q2’23 RETURNS PER HOME SOLD $40K $30K $20K $10K $0K -$10K -$20K -$30K -$40K -$50K -$60K Q2’22 Q3’22 Q4’22 Q1’23 Q2’23 Gross Profit per Home Sold Contribution Profit After Interest Per Home Sold NET INCOME (LOSS), ADJ. NET INCOME (LOSS) & ADJ. EBITDA ($M) $13.7 $11.6 ($1.0) ($64.3) ($80.0) ($82.0) ($103.7) ($121.1) ($124.5) ($44.8) ($59.1) ($59.4) ($17.3) ($22.3) ($22.8) Q2’22 Q3’22 Q4’22 Q1’23 Q2’23 See page 19 for a reconciliation to the most directly comparable GAAP measure and additional information. Net Income (Loss) Adj. Net Income (Loss) Adj. EBITDA 10 | Q2 2023

Offerpad Q2’23 Total Contribution Margin After Interest Per Home Sold $15k 4.3% ($4k) -1.0% ($11k) -3.1% $1k ($9k) -2.6% $6k 1.8% ($3k) -0.8% Net Sale Proceeds Holding Costs Selling Costs Contribution Margin Contribution Margin After Interest Other Services Total Contribution Margin After Interest Q2’23 Total Contribution Margin After Interest Per Home Sold, Excluding Inventory Acquired August’22 & Earlier $40K 12.0% ($2K) -0.6% ($10K) -3.0% $28K 8.4% $23K 7.0% $8K 2.5% $31K 9.5% Net Sale Proceeds Holding Costs Selling Costs Contribution Margin Contribution Margin After Interest Other Services Total Contribution Margin After Interest See page 19 for a reconciliation to the most directly comparable GAAP measure and additional information. 11 | Q2 2023

THIRD QUARTER 2023 OUTLOOK HOMES SOLD 600 – 700 REVENUE $200M – $240M ADJUSTED EBITDA1 ($17)M – ($9)M 1 See Non-GAAP financial measures on page 16 for an explanation of why a reconciliation of this guidance cannot be provided. 12 | Q2 2023
APPENDIX

|
Forward-Looking Statements |
Certain statements in this shareholder letter may be considered forward-looking statements within the meaning of the Private Securities Litigation Reform Act of 1995. Forward-looking statements generally relate to future events or Offerpad’s future financial or operating performance. For example, statements regarding Offerpad’s financial outlook, and expectations regarding profitability, including the timing of reaching positive adjusted EBITDA, and anticipated market conditions in the industry in which Offerpad operates are forward-looking statements. In some cases, you can identify forward-looking statements by terminology such as “may,” “should,” “could,” “might,” “plan,” “possible,” “project,” “strive,” “budget,” “forecast,” “expect,” “intend,” “will,” “estimate,” “anticipate,” “believe,” “predict,” “potential” or “continue,” or the negatives of these terms or variations of them or similar terminology. Such forward-looking statements are subject to risks, uncertainties, and other important factors that could cause actual results to differ materially from those expressed or implied by such forward-looking statements. Factors that may impact such forward-looking statements include, but are not limited to, Offerpad’s ability to respond to general economic conditions; the health of the U.S. residential real estate industry; Offerpad’s ability to grow market share in its existing markets or any new markets it may enter; Offerpad’s ability to manage its growth effectively; Offerpad’s ability to accurately value and manage inventory, and to maintain an adequate and desirable supply of inventory; Offerpad’s ability to successfully launch new product and service offerings, and to manage, develop and refine its technology platform; Offerpad’s ability to maintain and enhance its products and brand, and to attract customers; Offerpad’s ability to achieve and maintain profitability in the future; the success of strategic relationships with third parties; and Offerpad’s failure to meet the New York Stock Exchange’s continued listing standards. These and other important factors discussed under the caption “Risk Factors” in our Annual Report on Form 10-K for the year ended December 31, 2022 filed with the Securities and Exchange Commission on February 28, 2023, and our other reports filed with the Securities and Exchange Commission could cause actual results to differ materially from those indicated by the forward-looking statements made in this shareholder letter. These forward-looking statements are based upon estimates and assumptions that, while considered reasonable by Offerpad and its management, are inherently uncertain. Nothing in this shareholder letter should be regarded as a representation by any person that the forward-looking statements set forth herein will be achieved or that any of the contemplated results of such forward-looking statements will be achieved. You should not place undue reliance on forward-looking statements, which speak only as of the date they are made. Offerpad undertakes no obligation to update or revise any forward-looking statements, whether as a result of new information, future events or otherwise, except as may be required under applicable securities laws.
13 | Q2 2023
OFFERPAD SOLUTIONS INC.
CONDENSED CONSOLIDATED STATEMENTS OF OPERATIONS
| Three Months Ended June 30, |
Six Months Ended June 30, |
|||||||||||||||
| (in thousands, except per share data) (Unaudited) | 2023 | 2022 | 2023 | 2022 | ||||||||||||
| Revenue |
$ | 230,147 | $ | 1,079,531 | $ | 839,726 | $ | 2,453,368 | ||||||||
| Cost of revenue |
207,916 | 986,550 | 810,210 | 2,228,245 | ||||||||||||
|
|
|
|
|
|
|
|
|
|||||||||
| Gross profit |
22,231 | 92,981 | 29,516 | 225,123 | ||||||||||||
|
|
|
|
|
|
|
|
|
|||||||||
| Operating expenses: |
||||||||||||||||
| Sales, marketing and operating |
29,040 | 65,239 | 71,391 | 135,127 | ||||||||||||
| General and administrative |
12,713 | 16,121 | 27,192 | 30,778 | ||||||||||||
| Technology and development |
2,312 | 3,243 | 4,553 | 6,425 | ||||||||||||
|
|
|
|
|
|
|
|
|
|||||||||
| Total operating expenses |
44,065 | 84,603 | 103,136 | 172,330 | ||||||||||||
|
|
|
|
|
|
|
|
|
|||||||||
| (Loss) income from operations |
(21,834 | ) | 8,378 | (73,620 | ) | 52,793 | ||||||||||
| Other income (expense): |
||||||||||||||||
| Change in fair value of warrant liabilities |
435 | 12,537 | 46 | 18,201 | ||||||||||||
| Interest expense |
(1,867 | ) | (7,771 | ) | (9,299 | ) | (14,967 | ) | ||||||||
| Other income, net |
965 | 24 | 1,247 | 28 | ||||||||||||
|
|
|
|
|
|
|
|
|
|||||||||
| Total other (expense) income |
(467 | ) | 4,790 | (8,006 | ) | 3,262 | ||||||||||
|
|
|
|
|
|
|
|
|
|||||||||
| (Loss) income before income taxes |
(22,301 | ) | 13,168 | (81,626 | ) | 56,055 | ||||||||||
| Income tax expense |
(43 | ) | (1,610 | ) | (165 | ) | (3,509 | ) | ||||||||
|
|
|
|
|
|
|
|
|
|||||||||
| Net (loss) income |
$ | (22,344 | ) | $ | 11,558 | $ | (81,791 | ) | $ | 52,546 | ||||||
|
|
|
|
|
|
|
|
|
|||||||||
| Net (loss) income per share, basic |
$ | (0.82 | ) | $ | 0.71 | $ | (3.21 | ) | $ | 3.24 | ||||||
|
|
|
|
|
|
|
|
|
|||||||||
| Net (loss) income per share, diluted |
$ | (0.82 | ) | $ | 0.66 | $ | (3.21 | ) | $ | 3.03 | ||||||
|
|
|
|
|
|
|
|
|
|||||||||
| Weighted average common shares outstanding, basic |
27,258 | 16,390 | 25,470 | 16,200 | ||||||||||||
|
|
|
|
|
|
|
|
|
|||||||||
| Weighted average common shares outstanding, diluted |
27,258 | 17,383 | 25,470 | 17,346 | ||||||||||||
|
|
|
|
|
|
|
|
|
|||||||||
14 | Q2 2023
OFFERPAD SOLUTIONS INC.
CONDENSED CONSOLIDATED BALANCE SHEETS
| (in thousands, except par value per share) (Unaudited) | June 30, 2023 |
December 31, 2022 |
||||||
| ASSETS |
||||||||
| Current assets: |
||||||||
| Cash and cash equivalents |
$ | 115,599 | $ | 97,241 | ||||
| Restricted cash |
6,658 | 43,058 | ||||||
| Accounts receivable |
1,479 | 2,350 | ||||||
| Real estate inventory |
211,119 | 664,697 | ||||||
| Prepaid expenses and other current assets |
8,731 | 6,833 | ||||||
|
|
|
|
|
|||||
| Total current assets |
343,586 | 814,179 | ||||||
| Property and equipment, net |
4,874 | 5,194 | ||||||
| Other non-current assets |
4,641 | 5,696 | ||||||
|
|
|
|
|
|||||
| TOTAL ASSETS |
$ | 353,101 | $ | 825,069 | ||||
|
|
|
|
|
|||||
| LIABILITIES AND STOCKHOLDERS’ EQUITY |
||||||||
| Current liabilities: |
||||||||
| Accounts payable |
$ | 6,340 | $ | 4,647 | ||||
| Accrued and other current liabilities |
19,272 | 28,252 | ||||||
| Secured credit facilities and other debt, net |
161,316 | 605,889 | ||||||
| Secured credit facilities and other debt - related party |
29,926 | 60,176 | ||||||
|
|
|
|
|
|||||
| Total current liabilities |
216,854 | 698,964 | ||||||
| Warrant liabilities |
493 | 539 | ||||||
| Other long-term liabilities |
2,543 | 3,689 | ||||||
|
|
|
|
|
|||||
| Total liabilities |
219,890 | 703,192 | ||||||
|
|
|
|
|
|||||
| Commitments and contingencies |
||||||||
| Stockholders’ equity: |
||||||||
| Class A common stock, $0.0001 par value; 2,000,000 shares authorized; 27,225 and 15,491 shares issued and outstanding as of June 30, 2023 and December 31, 2022, respectively |
3 | 2 | ||||||
| Class B common stock, zero shares authorized, issued and outstanding as of June 30, 2023; and $0.0001 par value, 20,000 shares authorized; 988 shares issued and outstanding as of December 31, 2022 |
— | — | ||||||
| Additional paid in capital |
495,668 | 402,544 | ||||||
| Accumulated deficit |
(362,460 | ) | (280,669 | ) | ||||
|
|
|
|
|
|||||
| Total stockholders’ equity |
133,211 | 121,877 | ||||||
|
|
|
|
|
|||||
| TOTAL LIABILITIES AND STOCKHOLDERS’ EQUITY |
$ | 353,101 | $ | 825,069 | ||||
|
|
|
|
|
|||||
15 | Q2 2023
OFFERPAD SOLUTIONS INC.
CONDENSED CONSOLIDATED STATEMENTS OF CASH FLOWS
| Six Months Ended June 30, |
||||||||
| ($ in thousands) (Unaudited) | 2023 | 2022 | ||||||
| Cash flows from operating activities: |
||||||||
| Net (loss) income |
$ | (81,791 | ) | $ | 52,546 | |||
| Adjustments to reconcile net (loss) income to net cash provided by (used in) operating activities: |
||||||||
| Depreciation |
380 | 249 | ||||||
| Amortization of debt financing costs |
1,980 | 1,546 | ||||||
| Real estate inventory valuation adjustment |
7,454 | 22,205 | ||||||
| Stock-based compensation |
3,898 | 4,028 | ||||||
| Change in fair value of warrant liabilities |
(46 | ) | (18,201 | ) | ||||
| Change in fair value of derivative instrument |
715 | — | ||||||
| Loss on disposal of property and equipment |
30 | — | ||||||
| Changes in operating assets and liabilities: |
||||||||
| Accounts receivable |
871 | (6,764 | ) | |||||
| Real estate inventory |
446,124 | (179,060 | ) | |||||
| Prepaid expenses and other assets |
313 | (5,847 | ) | |||||
| Accounts payable |
1,693 | 4,306 | ||||||
| Accrued and other liabilities |
(10,126 | ) | 12,513 | |||||
|
|
|
|
|
|||||
| Net cash provided by (used in) operating activities |
371,495 | (112,479 | ) | |||||
|
|
|
|
|
|||||
| Cash flows from investing activities: |
||||||||
| Purchases of property and equipment |
(90 | ) | (725 | ) | ||||
| Purchases of derivative instruments |
(1,872 | ) | — | |||||
|
|
|
|
|
|||||
| Net cash used in investing activities |
(1,962 | ) | (725 | ) | ||||
|
|
|
|
|
|||||
| Cash flows from financing activities: |
||||||||
| Borrowings from credit facilities and other debt |
411,990 | 2,132,189 | ||||||
| Repayments of credit facilities and other debt |
(889,773 | ) | (2,017,985 | ) | ||||
| Payment of debt financing costs |
(172 | ) | (35 | ) | ||||
| Borrowings from warehouse lending facility |
18,488 | — | ||||||
| Repayments of warehouse lending facility |
(17,336 | ) | — | |||||
| Proceeds from issuance of pre-funded warrants |
90,000 | — | ||||||
| Proceeds from exercise of pre-funded warrants |
11 | — | ||||||
| Issuance cost of pre-funded warrants |
(784 | ) | — | |||||
| Proceeds from exercise of stock options |
53 | 4,775 | ||||||
| Payments for taxes related to stock-based awards |
(52 | ) | (235 | ) | ||||
|
|
|
|
|
|||||
| Net cash (used in) provided by financing activities |
(387,575 | ) | 118,709 | |||||
|
|
|
|
|
|||||
| Net change in cash, cash equivalents and restricted cash |
(18,042 | ) | 5,505 | |||||
| Cash, cash equivalents and restricted cash, beginning of period |
140,299 | 194,433 | ||||||
|
|
|
|
|
|||||
| Cash, cash equivalents and restricted cash, end of period |
$ | 122,257 | $ | 199,938 | ||||
|
|
|
|
|
|||||
| Reconciliation of cash, cash equivalents and restricted cash to the condensed consolidated balance sheet: |
||||||||
| Cash and cash equivalents |
$ | 115,599 | $ | 155,464 | ||||
| Restricted cash |
6,658 | 44,474 | ||||||
|
|
|
|
|
|||||
| Total cash, cash equivalents and restricted cash |
$ | 122,257 | $ | 199,938 | ||||
|
|
|
|
|
|||||
| Supplemental disclosure of cash flow information: |
||||||||
| Cash payments for interest |
$ | 13,932 | $ | 19,941 | ||||
16 | Q2 2023
Non-GAAP Financial Measures
In addition to our results of operations above, we report certain financial measures that are not required by, or presented in accordance with, U.S. generally accepted accounting principles (“GAAP”). These measures have limitations as analytical tools when assessing our operating performance and should not be considered in isolation or as a substitute for GAAP measures, including gross profit and net income.
We may calculate or present our non-GAAP financial measures differently than other companies who report measures with similar titles and, as a result, the non-GAAP financial measures we report may not be comparable with those of companies in our industry or in other industries. We have not provided a quantitative reconciliation of forecasted Adjusted EBITDA to forecasted net income (loss) or Contribution Profit After Interest to Gross profit within this shareholder letter because we are unable to calculate certain reconciling items without making unreasonable efforts. With respect to Adjusted EBITDA, these items include, but are not limited to, stock-based compensation with respect to future grants and forfeitures, and with respect to Contribution Profit After Interest, these items include, but are not limited to, inventory valuation adjustments, inventory sales timing or product mix, which could materially affect the computation of forward-looking net income (loss) and Gross Profit, respectively, and are inherently uncertain and depend on various factors, some of which are outside of our control.
Adjusted Gross Profit, Contribution Profit, and Contribution Profit After Interest (and related margins)
To provide investors with additional information regarding our margins, we have included Adjusted Gross Profit, Contribution Profit, and Contribution Profit After Interest (and related margins), which are non-GAAP financial measures. We believe that Adjusted Gross Profit, Contribution Profit, and Contribution Profit After Interest are useful financial measures for investors as they are used by management in evaluating unit level economics and operating performance across our markets. Each of these measures is intended to present the economics related to homes sold during a given period. We do so by including revenue generated from homes sold (and ancillary services) in the period and only the expenses that are directly attributable to such home sales, even if such expenses were recognized in prior periods, and excluding expenses related to homes that remain in real estate inventory as of the end of the period presented. Contribution Profit provides investors a measure to assess Offerpad’s ability to generate returns on homes sold during a reporting period after considering home acquisition costs, renovation and repair costs, and adjusting for holding costs and selling costs. Contribution Profit After Interest further impacts gross profit by including interest costs (including senior and mezzanine secured credit facilities) attributable to homes sold during a reporting period. We believe these measures facilitate meaningful period over period comparisons and illustrate our ability to generate returns on assets sold after considering the costs directly related to the assets sold in a presented period.
Adjusted Gross Profit, Contribution Profit and Contribution Profit After Interest (and related margins) are supplemental measures of our operating performance and have limitations as analytical tools. For example, these measures include costs that were recorded in prior periods under GAAP and exclude, in connection with homes held in real estate inventory at the end of the period, costs required to be recorded under GAAP in the same period.
Accordingly, these measures should not be considered in isolation or as a substitute for analysis of our results as reported under GAAP. We include a reconciliation of these measures to the most directly comparable GAAP financial measure, which is gross profit.
17 | Q2 2023
Adjusted Gross Profit / Margin
We calculate Adjusted Gross Profit as gross profit under GAAP adjusted for (1) net real estate inventory valuation adjustment plus (2) interest expense associated with homes sold in the presented period and recorded in cost of revenue. Net real estate inventory valuation adjustment is calculated by adding back the real estate inventory valuation adjustment charges recorded during the period on homes that remain in real estate inventory at period end and subtracting the real estate inventory valuation adjustment charges recorded in prior periods on homes sold in the current period. We define Adjusted Gross Margin as Adjusted Gross Profit as a percentage of revenue.
We view this metric as an important measure of business performance, as it captures gross margin performance isolated to homes sold in a given period and provides comparability across reporting periods. Adjusted Gross Profit helps management assess performance across the key phases of processing a home (acquisitions, renovations, and resale) for a specific resale cohort.
Contribution Profit / Margin
We calculate Contribution Profit as Adjusted Gross Profit, minus (1) direct selling costs incurred on homes sold during the presented period, minus (2) holding costs incurred in the current period on homes sold during the period recorded in sales, marketing, and operating, minus (3) holding costs incurred in prior periods on homes sold in the current period recorded in sales, marketing, and operating, plus (4) other income, net which is primarily comprised of interest income earned on our cash and cash equivalents and fair value adjustments of derivative financial instruments. The composition of our holding costs is described in the footnotes to the reconciliation table below. We define Contribution Margin as Contribution Profit as a percentage of revenue.
We view this metric as an important measure of business performance as it captures the unit level performance isolated to homes sold in a given period and provides comparability across reporting periods. Contribution Profit helps management assess inflows and outflow directly associated with a specific resale cohort.
Contribution Profit / Margin After Interest
We define Contribution Profit After Interest as Contribution Profit, minus (1) interest expense associated with homes sold in the presented period and recorded in cost of revenue, minus (2) interest expense associated with homes sold in the presented period, recorded in costs of sales, and previously excluded from Adjusted Gross Profit, and minus (3) interest expense under our senior and mezzanine secured credit facilities incurred on homes sold during the period. This includes interest expense recorded in prior periods in which the sale occurred. Our senior and mezzanine secured credit facilities are secured by our homes in real estate inventory and drawdowns are made on a per-home basis at the time of purchase and are required to be repaid at the time the homes are sold. We define Contribution Margin After Interest as Contribution Profit After Interest as a percentage of revenue.
We view this metric as an important measure of business performance. Contribution Profit After Interest helps management assess Contribution Margin performance, per above, when fully burdened with costs of financing.
18 | Q2 2023
The following tables present a reconciliation of our Adjusted Gross Profit, Contribution Profit and Contribution Profit After Interest to our Gross (Loss) Profit, which is the most directly comparable GAAP measure, and Contribution (Loss) Profit Per Home Sold and Contribution (Loss) Profit After Interest Per Home Sold to Offerpad’s Gross (Loss) Profit Per Home Sold, which is the most directly comparable GAAP measure, for the periods indicated:
| Three Months Ended | ||||||||||||||||||||
| (in thousands, except percentages and homes sold, unaudited) | June 30, 2023 | March 31, 2023 | December 31, 2022 | September 30, 2022 | June 30, 2022 | |||||||||||||||
| Gross (loss) profit |
$ | 22,231 | $ | 7,285 | $ | (44,860 | ) | $ | 2,159 | $ | 92,981 | |||||||||
| Gross margin |
9.7 | % | 1.2 | % | -6.6 | % | 0.3 | % | 8.6 | % | ||||||||||
| Homes sold |
650 | 1,609 | 1,865 | 2,280 | 2,888 | |||||||||||||||
| Gross profit (loss) per home sold |
34.2 | 4.5 | (24.1 | ) | 0.9 | 32.2 | ||||||||||||||
| Adjustments: |
||||||||||||||||||||
| Inventory valuation adjustment - current period |
169 | 7,285 | 44,075 | 27,529 | 20,995 | |||||||||||||||
| Inventory valuation adjustment - prior period |
(13,679 | ) | (51,515 | ) | (25,469 | ) | (8,955 | ) | (287 | ) | ||||||||||
| Interest expense capitalized |
1,358 | 4,677 | 3,081 | 2,508 | 2,793 | |||||||||||||||
|
|
|
|
|
|
|
|
|
|
|
|||||||||||
| Adjusted gross profit (loss) |
10,079 | (32,268 | ) | (23,173 | ) | 23,241 | 116,482 | |||||||||||||
| Adjusted gross margin |
4.4 | % | -5.3 | % | -3.4 | % | 2.8 | % | 10.8 | % | ||||||||||
| Adjustments: |
||||||||||||||||||||
| Direct selling costs |
(5,743 | ) | (18,061 | ) | (20,584 | ) | (21,419 | ) | (23,524 | ) | ||||||||||
| Holding costs on sales - current period |
(269 | ) | (1,248 | ) | (1,251 | ) | (1,765 | ) | (1,293 | ) | ||||||||||
| Holding costs on sales - prior period |
(567 | ) | (1,886 | ) | (1,209 | ) | (405 | ) | (526 | ) | ||||||||||
| Other income, net |
965 | 282 | 861 | 643 | 24 | |||||||||||||||
|
|
|
|
|
|
|
|
|
|
|
|||||||||||
| Contribution profit (loss) |
4,465 | (53,181 | ) | (45,356 | ) | 295 | 91,163 | |||||||||||||
| Contribution margin |
1.9 | % | -8.7 | % | -6.7 | % | 0.0 | % | 8.4 | % | ||||||||||
| Homes sold |
650 | 1,609 | 1,865 | 2,280 | 2,888 | |||||||||||||||
| Contribution profit (loss) per home sold |
6.9 | (33.1 | ) | (24.3 | ) | 0.1 | 31.6 | |||||||||||||
| Adjustments: |
||||||||||||||||||||
| Interest expense capitalized |
(1,358 | ) | (4,677 | ) | (3,081 | ) | (2,508 | ) | (2,793 | ) | ||||||||||
| Interest expense on homes sold - current period |
(1,292 | ) | (5,498 | ) | (5,858 | ) | (5,707 | ) | (4,115 | ) | ||||||||||
| Interest expense on homes sold - prior period |
(3,708 | ) | (12,032 | ) | (6,943 | ) | (2,382 | ) | (1,999 | ) | ||||||||||
|
|
|
|
|
|
|
|
|
|
|
|||||||||||
| Contribution profit (loss) after interest |
(1,893 | ) | (75,388 | ) | (61,238 | ) | (10,301 | ) | 82,256 | |||||||||||
| Contribution margin after interest |
-0.8 | % | -12.4 | % | -9.0 | % | -1.3 | % | 7.6 | % | ||||||||||
| Homes sold |
650 | 1,609 | 1,865 | 2,280 | 2,888 | |||||||||||||||
| Contribution (loss) profit after interest per home sold |
(2.9 | ) | (46.9 | ) | (32.8 | ) | (4.5 | ) | 28.5 | |||||||||||
| Three Months Ended June 30, 2023 |
||||||||||||
| (in thousands, except percentages and homes sold, unaudited) | Acquired Aug’22 & Prior | Acquired Sep’22 & Later Cohort | Total | |||||||||
| Gross profit (GAAP) |
$ | 329.00 | $ | 21,902.00 | $ | 22,231.00 | ||||||
| Gross margin |
0.5 | % | 13.5 | % | 9.7 | % | ||||||
| Homes sold |
159 | 491 | 650 | |||||||||
| Gross profit per home sold |
$ | 2.1 | $ | 44.6 | $ | 34.2 | ||||||
| Adjustments: |
||||||||||||
| Inventory valuation adjustment - current period (1) |
105 | 64 | 169 | |||||||||
| Inventory valuation adjustment - prior period (2) |
(11,990 | ) | (1,689 | ) | (13,679 | ) | ||||||
| Interest expense capitalized (3) |
669 | 689 | 1,358 | |||||||||
|
|
|
|
|
|
|
|||||||
| Adjusted (loss) gross profit |
$ | (10,887 | ) | $ | 20,966 | $ | 10,079 | |||||
| Adjusted gross margin |
-16.0 | % | 12.9 | % | 4.4 | % | ||||||
| Adjustments: |
||||||||||||
| Direct selling costs (4) |
(1,790 | ) | (3,953 | ) | (5,743 | ) | ||||||
| Holding costs on sales - current period (5)(6) |
(93 | ) | (176 | ) | (269 | ) | ||||||
| Holding costs on sales - prior period (5)(7) |
(467 | ) | (100 | ) | (567 | ) | ||||||
| Other income, net (8) |
— | 965 | 965 | |||||||||
|
|
|
|
|
|
|
|||||||
| Contribution (loss) profit |
$ | (13,237 | ) | $ | 17,702 | $ | 4,465 | |||||
| Contribution margin |
-19.5 | % | 10.9 | % | 1.9 | % | ||||||
| Homes sold |
159 | 491 | 650 | |||||||||
| Contribution (loss) profit per home sold |
$ | (83.3 | ) | $ | 36.1 | $ | 6.9 | |||||
| Adjustments: |
||||||||||||
| Interest expense capitalized (3) |
(669 | ) | (689 | ) | (1,358 | ) | ||||||
| Interest expense on homes sold - current period (9) |
(397 | ) | (895 | ) | (1,292 | ) | ||||||
| Interest expense on homes sold - prior period (10) |
(2,962 | ) | (746 | ) | (3,708 | ) | ||||||
|
|
|
|
|
|
|
|||||||
| Contribution (loss) profit after interest |
$ | (17,265 | ) | $ | 15,372 | $ | (1,893 | ) | ||||
| Contribution margin after interest |
-25.4 | % | 9.5 | % | -0.8 | % | ||||||
| Homes sold |
159 | 491 | 650 | |||||||||
| Contribution (loss) profit after interest per home sold |
$ | (108.6 | ) | $ | 31.3 | $ | (2.9 | ) | ||||
19 | Q2 2023
Adjusted Net (Loss) Income and Adjusted EBITDA
We also present Adjusted Net Income (Loss) and Adjusted EBITDA, which are non-GAAP financial measures, which our management team uses to assess our underlying financial performance. We believe these measures provide insight into period over period performance, adjusted for non-recurring or non-cash items.
We calculate Adjusted Net Income (Loss) as GAAP Net Income (Loss) adjusted for the change in fair value of warrant liabilities. We define Adjusted Net Income (Loss) Margin as Adjusted Net Income (Loss) as a percentage of revenue.
We calculate Adjusted EBITDA as Adjusted Net Income (Loss) adjusted for interest expense, amortization of capitalized interest, taxes, depreciation and amortization and stock-based compensation expense. We define Adjusted EBITDA Margin as Adjusted EBITDA as a percentage of revenue.
Adjusted Net Income (Loss) and Adjusted EBITDA are supplemental to our operating performance measures calculated in accordance with GAAP and have important limitations. For example, Adjusted Net Income (Loss) and Adjusted EBITDA exclude the impact of certain costs required to be recorded under GAAP and could differ substantially from similarly titled measures presented by other companies in our industry or companies in other industries. Accordingly, these measures should not be considered in isolation or as a substitute for analysis of our results as reported under GAAP.
The following table presents a reconciliation of our Adjusted Net Income (Loss) and Adjusted EBITDA to our GAAP Net Income (Loss), which is the most directly comparable GAAP measure, for the periods indicated:
| Three Months Ended | ||||||||||||||||||||
| (in thousands, except percentages, unaudited) | June 30, 2023 | March 31, 2023 | December 31, 2022 | September 30, 2022 | June 30, 2022 | |||||||||||||||
| Net (loss) income (GAAP) |
$ | (22,344 | ) | $ | (59,447 | ) | $ | (121,137 | ) | $ | (80,022 | ) | $ | 11,558 | ||||||
| Change in fair value of warrant liabilities |
(435 | ) | 389 | (3,360 | ) | (1,961 | ) | (12,537 | ) | |||||||||||
|
|
|
|
|
|
|
|
|
|
|
|||||||||||
| Adjusted net (loss) income |
$ | (22,779 | ) | $ | (59,058 | ) | $ | (124,497 | ) | $ | (81,983 | ) | $ | (979 | ) | |||||
| Adjusted net (loss) income margin |
(9.9 | %) | (9.7 | %) | (18.4 | %) | (10.0 | %) | (0.1 | %) | ||||||||||
| Adjustments: |
||||||||||||||||||||
| Interest expense |
1,867 | 7,432 | 15,135 | 15,889 | 7,771 | |||||||||||||||
| Amortization of capitalized interest (1) |
1,358 | 4,677 | 3,081 | 2,508 | 2,793 | |||||||||||||||
| Income tax expense |
43 | 122 | 324 | (3,474 | ) | 1,610 | ||||||||||||||
| Depreciation and amortization |
178 | 202 | 258 | 515 | 130 | |||||||||||||||
| Amortization of stock-based compensation |
2,055 | 1,843 | 2,014 | 2,265 | 2,400 | |||||||||||||||
|
|
|
|
|
|
|
|
|
|
|
|||||||||||
| Adjusted EBITDA |
(17,278 | ) | (44,782 | ) | (103,685 | ) | (64,280 | ) | 13,725 | |||||||||||
| Adjusted EBITDA margin |
(7.5 | %) | (7.3 | %) | (15.3 | %) | (7.8 | %) | 1.3 | % | ||||||||||
| (1) | Amortization of capitalized interest represents all interest related costs, including senior and mezzanine interest related costs, incurred on homes sold in the period presented that were capitalized and expensed in cost of sales at the time of sale. |
20 | Q2 2023

investor.offerpad.com
1 Year Offerpad Solutions Chart |
1 Month Offerpad Solutions Chart |

It looks like you are not logged in. Click the button below to log in and keep track of your recent history.
Support: +44 (0) 203 8794 460 | support@advfn.com
By accessing the services available at ADVFN you are agreeing to be bound by ADVFN's Terms & Conditions
 Hot Features