
We could not find any results for:
Make sure your spelling is correct or try broadening your search.
| Share Name | Share Symbol | Market | Type |
|---|---|---|---|
| JP Morgan Chase and Co | NYSE:JPM | NYSE | Common Stock |
| Price Change | % Change | Share Price | High Price | Low Price | Open Price | Shares Traded | Last Trade | |
|---|---|---|---|---|---|---|---|---|
| -0.86 | -0.45% | 190.80 | 192.529 | 188.46 | 192.00 | 8,922,779 | 01:00:00 |
From May 2019 to May 2024
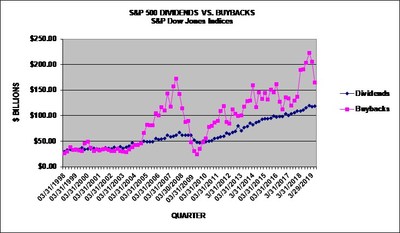
NEW YORK, Sept. 16, 2019 /PRNewswire/ -- S&P Dow Jones Indices ("S&P DJI") announced today that preliminary Q2 2019 S&P 500® stock buybacks, or share repurchases, were $164.5 billion. This was the second consecutive quarterly decline after four consecutive quarters of record buybacks. Q2 2019 buybacks were 20.1% lower than Q1 2019's $205.6 billion, 13.7% lower year-over-year from Q2 2018's $190.6 billion, and 26.2% lower than the Q4 2018 record expenditure of $223.0 billion.
Historical data on S&P 500 buybacks are available at www.spdji.com/indices/equity/sp-500.
Key Takeaways:
"In what may have been a reaction to their tax-inspired record-setting buying spree of 2018, companies significantly pulled back on their Q2 2019 buybacks, said Howard Silverblatt, Senior Index Analyst at S&P Dow Jones Indices. "While the decline is significant compared to 2018, it remains higher than the pre-2018 levels. Estimates vary, but a base amount of $170 billion a quarter has been emerging as the consensus level of buybacks going forward."
Silverblatt also found that buybacks continue to be top heavy, with the top 20 issues accounting for 51.4% of the buybacks, up a tick from the Q1 2019 51.2%, as the 10-year average is 44.1%.
Q2 2019 GICS® Sector Analysis:
Information Technology buybacks continued to dominate, even as they decreased 20.3% to $54.2 billion compared to $68.0 billion for Q1 2019. Twelve-month expenditures were up 33.8% to $265.8 billion from $198.7 billion spent for the same period in 2018. The sector represents 33.0% of the index's buybacks for the quarter, flat from last quarter.
Materials buyback declined 49.3% to $2.4 billion compared to $4.8 billion for Q1 2018. Utilities declined 40.4%, to 0.9 billion from 1.5 billion in Q1 2019.
Health Care buybacks continued to be volatile, as they decreased 44.5% to $17.1 billion, down from $30.7 billion for Q1 2019, as the 12-months ending in Q2 2019, buybacks were $93.6 billion, up 6.1% from the $88.2 billion spent in the corresponding 2018 period.
Issues:
The five issues with the highest total buybacks for Q2 2019 are:
For more information about S&P Dow Jones Indices, please visit www.spdji.com.
S&P Dow Jones Indices | ||||||||
S&P 500, $ U.S. BILLIONS (preliminary and estimates in bold) | ||||||||
PERIOD | MARKET | OPERATING | AS REPORTED | DIVIDEND & | ||||
VALUE | EARNINGS | EARNINGS | DIVIDENDS | BUYBACKS | DIVIDEND | BUYBACK | BUYBACK | |
$ BILLIONS | $ BILLIONS | $ BILLIONS | $ BILLIONS | $ BILLIONS | YIELD | YIELD | YIELD | |
12 Mo Jun,'19 Prelim. | $24,423.49 | $1,295.01 | $1,132.67 | $471.54 | $797.03 | 1.93% | 3.26% | 5.19% |
12 Mo Jun,'18 | $23,036.32 | $1,196.08 | $1,043.63 | $435.69 | $645.81 | 1.89% | 2.80% | 4.69% |
2018 | $21,026.90 | $1,281.66 | $1,119.43 | $456.31 | $806.41 | 2.17% | 3.84% | 6.01% |
2017 | $22,821.24 | $1,066.00 | $940.86 | $419.77 | $519.40 | 1.84% | 2.28% | 4.12% |
2016 | $19,267.93 | $919.85 | $818.55 | $397.21 | $536.38 | 2.06% | 2.78% | 4.85% |
6/28/2019 Prelim | $24,423 | $335.58 | $291.25 | $118.68 | $164.48 | 1.93% | 3.26% | 5.19% |
3/29/2019 | $23,619 | $316.48 | $291.23 | $117.33 | $205.81 | 1.97% | 3.49% | 5.45% |
12/31/2018 | $21,027 | $293.82 | $242.91 | $119.81 | $222.98 | 2.17% | 3.84% | 6.01% |
9/30/2018 | $24,579 | $349.04 | $306.70 | $115.72 | $203.76 | 1.81% | 2.93% | 4.75% |
6/30/2018 | $23,036 | $327.53 | $288.55 | $111.60 | $190.62 | 1.89% | 2.80% | 4.69% |
3/29/2018 | $22,496 | $311.26 | $281.28 | $109.18 | $189.05 | 1.90% | 2.56% | 4.46% |
12/29/2017 | $22,821 | $288.93 | $230.12 | $109.46 | $136.97 | 1.84% | 2.28% | 4.12% |
9/29/2017 | $21,579 | $268.35 | $243.68 | $105.45 | $129.17 | 1.92% | 2.40% | 4.32% |
6/30/2017 | $20,762 | $261.39 | $231.40 | $104.01 | $120.11 | 1.96% | 2.41% | 4.37% |
3/31/2017 | $20,276 | $247.32 | $235.65 | $100.86 | $133.15 | 1.98% | 2.51% | 4.49% |
12/31/2016 | $19,268 | $240.11 | $207.93 | $103.82 | $135.29 | 2.06% | 2.78% | 4.85% |
9/30/2016 | $18,742 | $247.98 | $219.46 | $98.43 | $112.20 | 2.10% | 2.92% | 5.01% |
6/30/2016 | $18,193 | $222.77 | $201.79 | $98.30 | $127.50 | 2.14% | 3.22% | 5.36% |
3/31/2016 | $17,958 | $208.99 | $189.37 | $96.67 | $161.39 | 2.15% | 3.28% | 5.43% |
12/31/2015 | $17,900 | $201.95 | $163.76 | $99.39 | $145.88 | 2.14% | 3.20% | 5.33% |
9/30/2015 | $16,917 | $224.14 | $204.58 | $95.07 | $150.58 | 2.22% | 3.30% | 5.52% |
6/30/2015 | $18,219 | $230.84 | $201.35 | $94.45 | $131.56 | 2.03% | 3.04% | 5.07% |
S&P Dow Jones Indices | |||||||
S&P 500 SECTOR BUYBACKS | |||||||
SECTOR $ MILLIONS | Q2,'18 | Q1,'19 | Q2,'18 | 12MoJun,'19 | 12MoJun,'18 | 5-YEARS | 10-YEARS |
Consumer Discretionary | $15,764 | $17,721 | $22,656 | $78,825 | $86,352 | $429,464 | $728,807 |
Consumer Staples | $7,114 | $9,786 | $6,580 | $36,512 | $39,904 | $211,298 | $439,981 |
Energy | $4,552 | $4,294 | $4,285 | $24,874 | $21,922 | $92,142 | $263,972 |
Financials | $37,819 | $42,845 | $29,968 | $166,948 | $131,925 | $593,911 | $813,978 |
Healthcare | $17,066 | $30,749 | $27,241 | $93,633 | $88,210 | $408,431 | $686,549 |
Industrials | $16,967 | $19,426 | $23,426 | $74,578 | $64,702 | $356,504 | $543,959 |
Information Technology | $54,210 | $67,986 | $71,511 | $265,787 | $198,677 | $864,307 | $1,333,335 |
Materials | $2,420 | $4,771 | $3,237 | $16,062 | $8,998 | $67,230 | $108,265 |
Real Estate | $555 | $409 | $884 | $2,963 | $3,888 | $9,334 | $9,334 |
Communication Services | $7,132 | $6,345 | $419 | $33,125 | $601 | $41,328 | $72,197 |
Utilities | $882 | $1,479 | $413 | $3,720 | $631 | $8,517 | $18,596 |
TOTAL | $164,481 | $205,811 | $190,621 | $797,028 | $645,811 | $3,082,465 | $5,018,974 |
S&P Dow Jones Indices | ||||||||
S&P 500 20 LARGEST Q2 2019 BUYBACKS, $ MILLIONS | ||||||||
Company | Ticker | Sector | Q2 2019 | 12-Months | 12-Months | 5-Year | 10-Year | Indicated |
Buybacks | Jun,'19 | Jun,'18 | Buybacks | Buybacks | Dividend | |||
$ Million | $ Million | $ Million | $ Million | $ Million | $ Million | |||
Apple | AAPL | Information Technology | $18,154 | $71,443 | $63,924 | $247,481 | $302,414 | $14,917 |
Bank of America | BAC | Financials | $6,507 | $23,041 | $17,673 | $53,164 | $58,059 | $7,361 |
Oracle | ORCL | Information Technology | $6,301 | $36,643 | $11,853 | $70,970 | $99,812 | $4,621 |
JPMorgan | JPM | Financials | $5,210 | $20,645 | $19,210 | $63,391 | $83,456 | $11,678 |
Cisco Systems | CSCO | Information Technology | $4,936 | $21,579 | $18,250 | $53,425 | $85,891 | $5,993 |
Wells Fargo | WFC | Financials | $4,906 | $24,691 | $11,734 | $63,997 | $79,914 | $10,187 |
Microsoft | MSFT | Information Technology | $4,633 | $19,543 | $10,721 | $72,464 | $112,993 | $14,100 |
Johnson Controls Internat'l | JCI | Industrials | $4,125 | $5,154 | $484 | $8,011 | $9,537 | $828 |
Alphabet | GOOGL | Communication Services | $3,577 | $11,452 | $6,326 | $25,996 | $26,914 | $0 |
Citigroup | C | Financials | $3,464 | $13,043 | $16,071 | $49,206 | $52,920 | $4,717 |
Intel | INTC | Information Technology | $3,049 | $10,037 | $6,920 | $34,109 | $62,342 | $5,641 |
Booking Holdings | BKNG | Consumer Discretionary | $2,718 | $9,557 | $3,178 | $18,043 | $19,578 | $0 |
Johnson & Johnson | JNJ | Health Care | $2,486 | $8,971 | $2,715 | $36,423 | $58,932 | $10,089 |
Amgen | AMGN | Health Care | $2,415 | $9,426 | $15,730 | $32,349 | $51,126 | $3,538 |
Biogen | BIIB | Health Care | $2,402 | $4,410 | $3,000 | $15,325 | $20,316 | $0 |
Visa | V | Information Technology | $2,152 | $8,178 | $7,418 | $31,863 | $44,473 | $1,739 |
Lowe's Companies | LOW | Consumer Discretionary | $1,944 | $3,961 | $2,535 | $18,373 | $34,586 | $1,722 |
Mastercard | MA | Information Technology | $1,921 | $5,920 | $4,824 | $20,322 | $28,488 | $1,498 |
Honeywell Internat'l | HON | Industrials | $1,900 | $4,946 | $3,601 | $13,875 | $16,396 | $2,387 |
Walgreens Boots Alliance | FB | Communication Services | $1,752 | $12,083 | $10,230 | $24,262 | $28,017 | $0 |
Top 20 | $84,552 | $324,723 | $236,397 | $953,050 | $1,276,164 | $101,017 | ||
S&P 500 | $164,481 | $797,028 | $645,811 | $3,082,465 | $5,073,953 | $530,924 | ||
Top 20 % of S&P 500 | 51.40% | 40.74% | 36.60% | 30.92% | 25.15% | 19.03% | ||
Gross values are not adjusted for float | ||||||||
S&P Dow Jones Indices | ||||
S&P 500 20 Largest Quarterly Buybacks, $ Millions, as of Q2 2019; Apple added at #6 | ||||
$ MILLIONS | QUARTER | COMPANY | SECTOR | |
$23,811 | Q1 2019 | Apple | Information Technology | 1 |
$22,908 | Q1 2018 | Apple | Information Technology | 2 |
$21,860 | Q2 2018 | Apple | Information Technology | 3 |
$21,162 | Q2 2006 | QUALCOMM | Information Technology | 4 |
$19,364 | Q3 2018 | Apple | Information Technology | 5 |
$18,154 | Q2 2019 | Apple | Information Technology | 6 |
$18,036 | Q1 2014 | Apple | Information Technology | 7 |
$17,319 | Q3 2014 | Apple | Information Technology | 8 |
$16,413 | Q2 2013 | Apple | Information Technology | 9 |
$15,707 | Q3 2007 | International Business Machines | Information Technology | 10 |
$13,420 | Q3 2015 | Apple | Information Technology | 11 |
$12,852 | Q4 2013 | Johnson & Johnson | Healthcare | 12 |
$12,318 | Q4 2016 | Allergan plc (AGN) | Healthcare | 13 |
$12,183 | Q2 2012 | Johnson & Johnson | Healthcare | 14 |
$11,480 | Q4 2016 | Apple | Information Technology | 15 |
$11,133 | Q4 2017 | Apple | Information Technology | 16 |
$10,776 | Q2 2016 | Apple | Information Technology | 17 |
$10,724 | Q2 2015 | Apple | Information Technology | 18 |
$10,723 | Q1 2016 | Home Depot | Consumer Discretionary | 19 |
$10,697 | Q1 2018 | Amgen | Healthcare | 20 |
S&P Dow Jones Indices | ||||
S&P 500 Q2 2019 Buyback Report | ||||
SECTOR | DIVIDEND | BUYBACK | COMBINED | |
YIELD | YIELD | YIELD | ||
Consumer Discretionary | 1.43% | 3.12% | 4.54% | |
Consumer Staples | 3.74% | 1.97% | 5.71% | |
Energy | 4.03% | 2.11% | 6.15% | |
Financials | 2.53% | 5.04% | 7.58% | |
HealthCare | 1.87% | 2.77% | 4.64% | |
Industrials | 2.10% | 3.22% | 5.32% | |
Information Technology | 1.52% | 4.90% | 6.42% | |
Materials | 2.35% | 2.46% | 4.82% | |
Real Estate | 3.17% | 0.38% | 3.55% | |
Communications Services | 1.60% | 1.50% | 3.10% | |
Utilities | 3.18% | 0.44% | 3.62% | |
S&P 500 | 2.18% | 3.25% | 5.43% | |
Uses full values (unadjusted for float) | ||||
Dividends based on indicated; buybacks based on the last 12-months ending Q2,'19 | ||||
Share Count Reduction (SCR) | SCR | SCR |
(Y/Y diluted shares used for EPS) | >=4% | <=-4% |
Q2 2019 | 8.00% | 24.20% |
Q1 2019 | 8.03% | 24.90% |
Q4 2018 | 8.45% | 18.71% |
Q3 2018 | 6.43% | 17.67% |
Q2 2018 | 6.20% | 15.60% |
Q1 2018 | 7.01% | 13.63% |
Q4 2017 | 6.83% | 15.06% |
Q3 2017 | 8.62% | 14.23% |
Q2 2017 | 10.00% | 14.00% |
Q1 2017 | 12.00% | 14.80% |
Q4 2016 | 10.48% | 19.35% |
Q3 2016 | 9.94% | 23.73% |
Q2 2016 | 10.48% | 26.61% |
Q1 2016 | 10.06% | 28.17% |
Q4 2015 | 9.48% | 25.81% |
Q3 2015 | 9.64% | 22.69% |
Q2 2015 | 9.04% | 21.08% |
ABOUT S&P DOW JONES INDICES
S&P Dow Jones Indices is the largest global resource for essential index-based concepts, data and research, and home to iconic financial market indicators, such as the S&P 500® and the Dow Jones Industrial Average®. More assets are invested in products based on our indices than products based on indices from any other provider in the world. Since Charles Dow invented the first index in 1884, S&P DJI has been innovating and developing indices across the spectrum of asset classes helping to define the way investors measure and trade the markets.
S&P Dow Jones Indices is a division of S&P Global (NYSE: SPGI), which provides essential intelligence for individuals, companies, and governments to make decisions with confidence. For more information, visit: www.spdji.com.
![]() View original content to download multimedia:http://www.prnewswire.com/news-releases/sp-500-buybacks-decline-significantly-in-q2-2019-expenditures-still-remain-higher-than-the-pre-2018-levels-300918745.html
View original content to download multimedia:http://www.prnewswire.com/news-releases/sp-500-buybacks-decline-significantly-in-q2-2019-expenditures-still-remain-higher-than-the-pre-2018-levels-300918745.html
SOURCE S&P Dow Jones Indices

Copyright 2019 PR Newswire
1 Year JP Morgan Chase Chart |
1 Month JP Morgan Chase Chart |

It looks like you are not logged in. Click the button below to log in and keep track of your recent history.
Support: +44 (0) 203 8794 460 | support@advfn.com
By accessing the services available at ADVFN you are agreeing to be bound by ADVFN's Terms & Conditions
 Hot Features