
We could not find any results for:
Make sure your spelling is correct or try broadening your search.
| Share Name | Share Symbol | Market | Type |
|---|---|---|---|
| JP Morgan Chase and Co | NYSE:JPM | NYSE | Common Stock |
| Price Change | % Change | Share Price | High Price | Low Price | Open Price | Shares Traded | Last Trade | |
|---|---|---|---|---|---|---|---|---|
| 0.59 | 0.31% | 191.10 | 12,277 | 13:38:47 |
The information in this preliminary pricing supplement is not complete and may be changed. This preliminary pricing supplement is not an offer to sell nor does it seek an offer to buy these securities in any jurisdiction where the offer or sale is not permitted.
Subject to completion dated February 11, 2016
|
PRICING SUPPLEMENT NO. |
|
JPMorgan Chase & Co. Buffered Return Optimization Securities
Linked to an equally weighted basket consisting of 10 Underlying Stocks due on or about June 30, 2017
| Features | Key Dates | |||
|
|
Trade Date1 | February 24, 2016 | ||
| Original Issue Date (Settlement Date)1 | February 29, 2016 | |||
| Final Valuation Date2 | June 26, 2017 | |||
| Maturity Date2 | June 30, 2017 | |||
| 1 | Expected. In the event that we make any change to the expected Trade Date and Settlement Date, the Final Valuation Date and/or the Maturity Date will be changed so that the stated term of the Securities remains the same. | |||
| 2 | Subject to postponement in the event of a market disruption event and as described under "General Terms of Notes — Postponement of a Determination Date — Notes Linked to Multiple Underlyings" and "General Terms of Notes — Postponement of a Payment Date" in the accompanying product supplement no. UBS-1a-I | |||
|
THE SECURITIES ARE SIGNIFICANTLY RISKIER THAN CONVENTIONAL DEBT INSTRUMENTS. JPMORGAN CHASE IS NOT NECESSARILY OBLIGATED TO REPAY THE FULL PRINCIPAL AMOUNT OF THE SECURITIES AT MATURITY, AND THE SECURITIES MAY HAVE DOWNSIDE MARKET RISK SIMILAR TO THE BASKET, SUBJECT TO THE BUFFER AMOUNT. THIS MARKET RISK IS IN ADDITION TO THE CREDIT RISK INHERENT IN PURCHASING A DEBT OBLIGATION OF JPMORGAN CHASE. YOU SHOULD NOT PURCHASE THE SECURITIES IF YOU DO NOT UNDERSTAND OR ARE NOT COMFORTABLE WITH THE SIGNIFICANT RISKS INVOLVED IN INVESTING IN THE SECURITIES. YOU SHOULD CAREFULLY CONSIDER THE RISKS DESCRIBED UNDER "KEY RISKS" BEGINNING ON PAGE 5 AND UNDER "RISK FACTORS" BEGINNING ON PAGE PS-9 OF THE ACCOMPANYING PRODUCT SUPPLEMENT NO. UBS-1A-I. BEFORE PURCHASING ANY SECURITIES. EVENTS RELATING TO ANY OF THOSE RISKS, OR OTHER RISKS AND UNCERTAINTIES, COULD ADVERSELY AFFECT THE MARKET VALUE OF, AND THE RETURN ON, YOUR SECURITIES. YOU MAY LOSE UP TO 90% OF YOUR INITIAL INVESTMENT IN THE SECURITIES. THE SECURITIES WILL NOT BE LISTED ON ANY SECURITIES EXCHANGE. |
| Security Offering |
| We are offering Buffered Return Optimization Securities linked to an equally weighted basket consisting of the 10 Underlying Stocks specified below. The Securities are offered for a minimum investment of 100 Securities at the price to public described below. The return on the Securities is subject to, and will not exceed, the Maximum Gain. The Maximum Gain and Initial Basket Level will be finalized on the Trade Date and provided in the pricing supplement. The actual Maximum Gain will not be less than the bottom of the range listed below, but you should be willing to invest in the Securities if the Maximum Gain were set equal to the bottom of that range. |
See "Additional Information about JPMorgan Chase & Co. and the Securities" in this pricing supplement. The Securities will have the terms specified in the prospectus and the prospectus supplement, each dated November 7, 2014, product supplement no. UBS-1a-I dated November 7, 2014, underlying supplement no. 1a-I dated November 7, 2014 and this pricing supplement. The terms of the Securities as set forth in this pricing supplement, to the extent they differ or conflict with those set forth in product supplement no. UBS-1a-I, will supersede the terms set forth in product supplement no. UBS-1a-I.
Neither the Securities and Exchange Commission (the "SEC") nor any state securities commission has approved or disapproved of the Securities or passed upon the accuracy or the adequacy of this pricing supplement or the accompanying prospectus, prospectus supplement and product supplement no. UBS-1a-I. Any representation to the contrary is a criminal offense.
| Price to Public1 | Fees and Commissions2 | Proceeds to Issuer | ||||
| Offering of Securities | Total | Per Security | Total | Per Security | Total | Per Security |
| Securities Linked to a Basket of Underlying Stocks | $10.00 | $0.05 | $9.95 | |||
| 1 | See "Supplemental Use of Proceeds" in this pricing supplement for information about the components of the price to public of the Securities. |
| 2 | All sales of the Securities will be made to certain fee-based advisory accounts for which UBS Financial Services Inc., which we refer to as UBS, is an investment advisor at a purchase price of $10.00 per $10.00 principal amount Security. UBS, acting as placement agent for such advisory accounts, will purchase the Securities from a dealer that is not affiliated with UBS or J.P. Morgan Securities LLC, which we refer to as JPMS, and that dealer will purchase the Securities from JPMS. JPMS will pay all of the selling commissions it receives from us to that dealer. In no event will these selling commissions exceed $0.05 per $10.00 principal amount Security. UBS will forgo any commissions related to these sales. See "Plan of Distribution (Conflicts of Interest)" beginning on page PS-87 of the accompanying product supplement no. UBS-1a-I, as supplemented by "Supplemental Plan of Distribution" in this pricing supplement. |
If the Securities priced today and assuming a Maximum Gain equal to the middle of the range listed above, the estimated value of the Securities as determined by J.P. Morgan Securities LLC, which we refer to as JPMS, would be approximately $9.903 per $10 principal amount Security. JPMS's estimated value of the Securities, when the terms of the Securities are set, will be provided by JPMS in the pricing supplement and will not be less than $9.70 per $10 principal amount Security. See "JPMS's Estimated Value of the Securities" in this pricing supplement for additional information.
The Securities are not bank deposits, are not insured by the Federal Deposit Insurance Corporation or any other governmental agency and are not obligations of, or guaranteed by, a bank.
![]()
Additional Information about JPMorgan Chase & Co. and the Securities
You may revoke your offer to purchase the Securities at any time prior to the time at which we accept such offer by notifying the agent. We reserve the right to change the terms of, or reject any offer to purchase, the Securities prior to their issuance. In the event of any changes to the terms of the Securities, we will notify you and you will be asked to accept such changes in connection with your purchase. You may also choose to reject such changes, in which case we may reject your offer to purchase.
You should read this pricing supplement together with the prospectus, as supplemented by the prospectus supplement, each dated November 7, 2014, relating to our Series E medium-term notes of which these Securities are a part, and the more detailed information contained in product supplement no. UBS-1a-I dated November 7, 2014. This pricing supplement, together with the documents listed below, contains the terms of the Securities and supersedes all other prior or contemporaneous oral statements as well as any other written materials including preliminary or indicative pricing terms, correspondence, trade ideas, structures for implementation, sample structures, fact sheets, brochures or other educational materials of ours. You should carefully consider, among other things, the matters set forth in "Risk Factors" in the accompanying product supplement no. UBS-1a-I, as the Securities involve risks not associated with conventional debt securities.
You may access these on the SEC website at www.sec.gov as follows (or if such address has changed, by reviewing our filing for the relevant date on the SEC website):
| ♦ | Product supplement no. UBS-1a-I dated November 7, 2014: http://www.sec.gov/Archives/edgar/data/19617/000089109214008409/e61360_424b2.pdf |
| ♦ | Prospectus supplement and prospectus, each dated November 7, 2014: http://www.sec.gov/Archives/edgar/data/19617/000089109214008397/e61348_424b2.pdf |
As used in this pricing supplement, the "Issuer," "JPMorgan Chase," "we," "us" and "our" refer to JPMorgan Chase & Co.
2
Investor Suitability
The suitability considerations identified above are not exhaustive. Whether or not the Securities are a suitable investment for you will depend on your individual circumstances, and you should reach an investment decision only after you and your investment, legal, tax, accounting and other advisers have carefully considered the suitability of an investment in the Securities in light of your particular circumstances. You should also review carefully the "Key Risks" beginning on page 5 of this pricing supplement and "Risk Factors" in the accompanying product supplement no. UBS-1a-I a for risks related to an investment in the Securities. For more information on the Underlying Stocks, please see the section titled "The Underlying Stocks" below.
3
1 See footnote 1 under "Key Dates" on the front cover
2 The closing price and the Stock Adjustment Factor of each Underlying Stock are subject to adjustments, in the sole discretion of the calculation agent, in the case of certain corporate events described in the accompanying product supplement no. UBS-1a-1 under "The Underlyings - Underlying Stocks - Anti-Dilution Adjustments" and "The Underlyings - Underlying Stocks - Reorganization Events."
| Investment Timeline | |||
| Trade Date | The Initial Price of each Underlying Stock is observed, the Initial Basket Level is set equal to 100 and the Maximum Gain is determined. | ||

|
|||
| Maturity Date |
The Final Price of each Underlying Stock, the Final Basket Level and the Basket Return are determined. If the Basket Return is positive, JPMorgan Chase will pay you a cash payment at maturity per $10 principal amount Security equal to: $10.00 + ($10.00 × Basket Return × Multiplier) provided, however, that in no event will JPMorgan Chase pay you at maturity an amount greater than: $10.00 + ($10.00 × Maximum Gain) If the Basket Return is zero or negative, and the Final Basket Level is less than the Initial Basket Level by up to the Buffer Amount, JPMorgan Chase will pay you a cash payment at maturity of $10.00 per $10 principal amount Security. If the Basket Return is negative and the Final Basket Level is less than the Initial Basket Level by more than the Buffer Amount, JPMorgan Chase will pay you a cash payment at maturity per $10 principal amount Security equal to: $10.00 + [$10.00 × (Basket Return + Buffer Amount)] Under these circumstances, you may lose up to 90% of your principal amount. |
||
| INVESTING IN THE SECURITIES INVOLVES SIGNIFICANT RISKS. YOU MAY LOSE UP TO 90% OF YOUR PRINCIPAL AMOUNT. ANY PAYMENT ON THE SECURITIES, INCLUDING ANY REPAYMENT OF PRINCIPAL, IS SUBJECT TO THE CREDITWORTHINESS OF JPMORGAN CHASE. IF JPMORGAN CHASE WERE TO DEFAULT ON ITS PAYMENT OBLIGATIONS, YOU MAY NOT RECEIVE ANY AMOUNTS OWED TO YOU UNDER THE SECURITIES AND YOU COULD LOSE YOUR ENTIRE INVESTMENT. | |||
4
What Are the Tax Consequences of the Securities?
You should review carefully the section entitled "Material U.S. Federal Income Tax Consequences" in the accompanying product supplement no. UBS-1a-I. The following discussion, when read in combination with that section, constitutes the full opinion of our special tax counsel, Davis Polk & Wardwell LLP, regarding the material U.S. federal income tax consequences of owning and disposing of Securities.
Based on current market conditions, in the opinion of our special tax counsel it is reasonable to treat the Securities as "open transactions" that are not debt instruments for U.S. federal income tax purposes, as more fully described in "Material U.S. Federal Income Tax Consequences — Tax Consequences to U.S. Holders — Notes Treated as Open Transactions That Are Not Debt Instruments" in the accompanying product supplement no. UBS-1a-I. Assuming this treatment is respected, the gain or loss on your Securities should be treated as long-term capital gain or loss if you hold your Securities for more than a year, whether or not you are an initial purchaser of Securities at the issue price. However, the IRS or a court may not respect this treatment, in which case the timing and character of any income or loss on the Securities could be materially and adversely affected. In addition, in 2007 Treasury and the IRS released a notice requesting comments on the U.S. federal income tax treatment of "prepaid forward contracts" and similar instruments. The notice focuses in particular on whether to require investors in these instruments to accrue income over the term of their investment. It also asks for comments on a number of related topics, including the character of income or loss with respect to these instruments; the relevance of factors such as the nature of the underlying property to which the instruments are linked; the degree, if any, to which income (including any mandated accruals) realized by non-U.S. investors should be subject to withholding tax; and whether these instruments are or should be subject to the "constructive ownership" regime, which very generally can operate to recharacterize certain long-term capital gain as ordinary income and impose a notional interest charge. While the notice requests comments on appropriate transition rules and effective dates, any Treasury regulations or other guidance promulgated after consideration of these issues could materially and adversely affect the tax consequences of an investment in the Securities, possibly with retroactive effect. You should consult your tax adviser regarding the U.S. federal income tax consequences of an investment in the Securities, including possible alternative treatments and the issues presented by this notice.
Withholding under legislation commonly referred to as "FATCA" may (if the Securities are recharacterized as debt instruments) apply to amounts treated as interest paid with respect to the Securities. Notwithstanding anything to the contrary in the accompanying product supplement no. UBS-1a-I, under a recent IRS notice, withholding under FATCA will not apply to payments of gross proceeds (other than any amount treated as interest) of a taxable disposition, including redemption at maturity, of the Securities. You should consult your tax adviser regarding the potential application of FATCA to the Securities.
Non-U.S. holders should also note that, notwithstanding anything to the contrary in the accompanying product supplement no. UBS-1a-I, recently promulgated Treasury regulations imposing a withholding tax on certain "dividend equivalents" under certain "equity linked instruments" will not apply to the Securities.
5
Key Risks
An investment in the Securities involves significant risks. Investing in the Securities is not equivalent to investing directly in the Basket or any of the Underlying Stocks. These risks are explained in more detail in the "Risk Factors" section of the accompanying product supplement no. UBS-1a-I. We also urge you to consult your investment, legal, tax, accounting and other advisers before you invest in the Securities.
Risks Relating to the Securities Generally
6
| The Securities are not designed to be short-term trading instruments. Accordingly, you should be able and willing to hold your Securities to maturity. See "— Lack of Liquidity" below. |
| ♦ | Secondary Market Prices of the Securities Will Be Impacted by Many Economic and Market Factors — The secondary market price of the Securities during their term will be impacted by a number of economic and market factors, which may either offset or magnify each other, aside from the selling commissions, projected hedging profits, if any, estimated hedging costs and the price of one share of each of the Underlying Stocks, including: |
| Additionally, independent pricing vendors and/or third party broker-dealers may publish a price for the Securities, which may also be reflected on customer account statements. This price may be different (higher or lower) than the price of the Securities, if any, at which JPMS may be willing to purchase your Securities in the secondary market. |
| ♦ | Correlation (or Lack of Correlation) of the Underlying Stocks — Changes in the prices of the Underlying Stocks may not correlate with each other. At a time when the price of one or more Underlying Stocks increase, the price of one or more other Underlying Stocks may not increase as much or may even decline. Therefore, in calculating the closing level of the Basket, an increase in the price of one or more of the Underlying Stocks may be moderated, or more than offset, by a lesser increase or decline in the price of one or more other Underlying Stocks. In addition, high correlation of movements in the prices of the Underlying Stocks during periods of negative returns among the Underlying Stocks could have an adverse effect on any payment on the Securities. |
| ♦ | Investing in the Securities Is Not Equivalent to Investing in the Underlying Stocks — Investing in the Securities is not equivalent to investing in the Underlying Stocks. As an investor in the Securities, you will not have any ownership interest or rights in the Underlying Stocks, such as voting rights, dividend payments or other distributions. |
7
Risks Relating to the Ordinary Shares of Medtronic Public Limited Company
| ♦ | Risks Associated with Non-U.S. Companies — An investment in Securities linked to the ordinary shares of Medtronic Public Limited Company involves risks associated with the home country of Medtronic Public Limited Company, which is Ireland. The prices of securities issued by non-U.S. companies may be affected by political, economic, financial and social factors in the home country of the applicable non-U.S. issuer, including changes in that country's government, economic and fiscal policies, currency exchange laws or other laws or restrictions. Moreover, the economy of that country may differ favorably or unfavorably from the economy of the United States in such respects as growth of gross national product, rate of inflation, capital reinvestment, resources and self-sufficiency. That country may be subjected to different and, in some cases, more adverse economic environments. |
8
Hypothetical Examples and Return Table
The following table and hypothetical examples below illustrate the payment at maturity per $10.00 principal amount Security for a hypothetical range of Basket Returns from -100.00% to +100.00%, reflect the Multiplier of 1.50, the Buffer Amount of 10% and the Initial Basket Level of 100 and assume a Maximum Gain of 15.00% (the bottom of the range of 15.00% to 16.00%). The actual Maximum Gain will be finalized on the Trade Date and provided in the pricing supplement and will not be less than 15.00% or greater than 16.00%. The hypothetical payment at maturity examples set forth below are for illustrative purposes only and may not be the actual returns applicable to a purchaser of the Securities. The actual payment at maturity will be determined based on the Initial Basket Level and the Maximum Gain to be finalized on the Trade Date and provided in the pricing supplement and the Final Basket Level on the Final Valuation Date. You should consider carefully whether the Securities are suitable to your investment goals. The numbers appearing in the table below have been rounded for ease of analysis.
| Final Basket Level | Basket Return (%) | Payment at Maturity ($) | Return at Maturity per $10.00 issue price (%) |
| 200.00 | 100.00% | $11.500 | 15.00% |
| 190.00 | 90.00% | $11.500 | 15.00% |
| 180.00 | 80.00% | $11.500 | 15.00% |
| 170.00 | 70.00% | $11.500 | 15.00% |
| 160.00 | 60.00% | $11.500 | 15.00% |
| 150.00 | 50.00% | $11.500 | 15.00% |
| 140.00 | 40.00% | $11.500 | 15.00% |
| 130.00 | 30.00% | $11.500 | 15.00% |
| 120.00 | 20.00% | $11.500 | 15.00% |
| 115.00 | 15.00% | $11.500 | 15.00% |
| 110.00 | 10.00% | $11.500 | 15.00% |
| 105.00 | 5.00% | $10.750 | 7.50% |
| 102.50 | 2.50% | $10.375 | 3.75% |
| 101.00 | 1.00% | $10.150 | 1.50% |
| 100.00 | 0.00% | $10.000 | 0.00% |
| 95.00 | -5.00% | $10.000 | 0.00% |
| 90.00 | -10.00% | $10.000 | 0.00% |
| 89.99 | -10.01% | $9.999 | -0.01% |
| 80.00 | -20.00% | $9.000 | -10.00% |
| 70.00 | -30.00% | $8.000 | -20.00% |
| 60.00 | -40.00% | $7.000 | -30.00% |
| 50.00 | -50.00% | $6.000 | -40.00% |
| 40.00 | -60.00% | $5.000 | -50.00% |
| 30.00 | -70.00% | $4.000 | -60.00% |
| 20.00 | -80.00% | $3.000 | -70.00% |
| 10.00 | -90.00% | $2.000 | -80.00% |
| 0.00 | -100.00% | $1.000 | -90.00% |
Example 1 — The level of the Basket increases by 2.50% from the Initial Basket Level of 100 to the Final Basket Level of 102.50.
Because the Multiplier of 1.50 times the Basket Return of 4% is less than the Maximum Gain of 15.00%, JPMorgan Chase will pay you your principal amount plus a return equal to the Basket Return times the Multiplier, resulting in a payment at maturity of $10.60 per $10 principal amount Security, calculated as follows:
$10.00 + ($10.00 × Basket Return × Multiplier)
$10.00 + ($10.00 × 2.50% × 1.5) = $10.375
Example 2 — The level of the Basket increases by 12% from the Initial Basket Level of 100 to the Final Basket Level of 112.
Because the Multiplier of 1.50 times the Basket Return of 12% is greater than the Maximum Gain of 15.00%, JPMorgan Chase will pay you your principal amount plus a return equal to the Maximum Gain of 15.00%, resulting in a payment at maturity of $11.50 per $10 principal amount Security, calculated as follows:
$10.00 + ($10.00 × Maximum Gain)
$10.00 + ($10.00 × 15.00%) = $11.50
Example 3 — The level of the Basket decreases by 10% from the Initial Basket Level of 100 to the Final Basket Level of 90.
Because the Basket Return is negative and the Final Basket Level is less than the Initial Basket Level by up to the Buffer Amount of 10%, at maturity, JPMorgan Chase will repay your principal amount of $10.00 per $10 principal amount Security.
9
Example 4 — The level of the Basket decreases by 40% from the Initial Basket Level of 100 to the Final Basket Level of 60.
Because the Basket Return is -40% and the Final Basket Level is less than the Initial Basket Level by more than the Buffer Amount of 10%, at maturity, JPMorgan Chase will pay you a payment at maturity of $7.00 per $10 principal amount Security, calculated as follows:
$10.00 + [$10.00 × (Basket Return + Buffer Amount)]
$10.00 + [$10.00 × (-40.00% + 10.00%)] = $7.00
If the Basket Return is negative and the Final Basket Level is less than the Initial Basket Level by more than the Buffer Amount, investors will lose 1% of their principal amount for every 1% that the Basket has declined in excess of the Buffer Amount. Investors could lose up to 90% of their principal amount.
The hypothetical returns and hypothetical payments on the Securities shown above apply only if you hold the Securities for their entire term. These hypotheticals do not reflect fees or expenses that would be associated with any sale in the secondary market. If these fees and expenses were included, the hypothetical returns and hypothetical payments shown above would likely be lower.
10
Hypothetical Examples of Calculations of the Closing Levels of the Basket
The examples below illustrate the hypothetical closing levels of the Basket on the Final Valuation Date under different hypothetical scenarios with the following assumptions (the actual terms will be finalized on the Trade Date and provided in the pricing supplement; amounts have been rounded for ease of reference):
| Underlying Stock | Stock Weight | Initial Price |
| Class A common stock of Alphabet Inc. | 10.00% | $100.00* |
| Common stock of Amazon.com, Inc. | 10.00% | $100.00* |
| Common stock of Apple Inc. | 10.00% | $100.00* |
| Common stock of Cisco Systems, Inc. | 10.00% | $100.00* |
| Class A common stock of Comcast Corporation | 10.00% | $100.00* |
| Class A common stock of Facebook, Inc. | 10.00% | $100.00* |
| Common stock of Gilead Sciences, Inc. | 10.00% | $100.00* |
| Ordinary shares of Medtronic Public Limited Company | 10.00% | $100.00* |
| Common stock of Netflix, Inc. | 10.00% | $100.00* |
| Common stock of Starbucks Corporation | 10.00% | $100.00* |
| *The actual Initial Prices for each Underlying Stock will be determined on the Trade Date and provided in the pricing supplement. The hypothetical Stock Price for each Underlying Stock of $100.00 has been chosen for illustrative purposes only and may not represent a likely actual Initial Price for any Underlying Stock. The actual Initial Price for each Underlying Stock will be based on the closing price of one share of that Underlying Stock on the Trade Date and will be provided in the pricing supplement. For historical data regarding the actual closing prices of one share of each Underlying Stock, please see the historical information set forth under "The Underlying Stocks" in this pricing supplement. | ||
Example 1 — On the Final Valuation Date, each Underlying Stock closes above its Initial Price.
| Underlying Stock | Weight | Initial Price | Final Price | Stock Return |
| Class A common stock of Alphabet Inc. | 10.00% | $100.00 | $108.00 | 8.00% |
| Common stock of Amazon.com, Inc. | 10.00% | $100.00 | $107.00 | 7.00% |
| Common stock of Apple Inc. | 10.00% | $100.00 | $106.00 | 6.00% |
| Common stock of Cisco Systems, Inc. | 10.00% | $100.00 | $110.00 | 10.00% |
| Class A common stock of Comcast Corporation | 10.00% | $100.00 | $102.00 | 2.00% |
| Class A common stock of Facebook, Inc. | 10.00% | $100.00 | $102.00 | 2.00% |
| Common stock of Gilead Sciences, Inc. | 10.00% | $100.00 | $101.00 | 1.00% |
| Ordinary shares of Medtronic Public Limited Company | 10.00% | $100.00 | $102.00 | 2.00% |
| Common stock of Netflix, Inc. | 10.00% | $100.00 | $104.00 | 4.00% |
| Common stock of Starbucks Corporation | 10.00% | $100.00 | $108.00 | 8.00% |
| Closing Level of the Basket: | 100 × [1 + (8.00% × 10.00%) + (7.00% × 10.00%) + (6.00% × 10.00%) + (10.00% × 10.00%) + (2.00% × 10.00%) + (2.00% × 10.00%) + (1.00% × 10.00%) + (2.00% × 10.00%) + (4.00% × 10.00%) + (8.00% × 10.00%)] = 105 | |||
A closing level of the Basket of 105 represents a 5% increase in the level of the Basket from the Initial Basket Level.
Example 2 — On the Final Valuation Date, each Underlying Stock closes below its Initial Price.
| Underlying Stock | Weight | Initial Price | Final Price | Stock Return |
| Class A common stock of Alphabet Inc. | 10.00% | $100.00 | $90.00 | -10.00% |
| Common stock of Amazon.com, Inc. | 10.00% | $100.00 | $80.00 | -20.00% |
| Common stock of Apple Inc. | 10.00% | $100.00 | $77.00 | -23.00% |
| Common stock of Cisco Systems, Inc. | 10.00% | $100.00 | $95.00 | -5.00% |
| Class A common stock of Comcast Corporation | 10.00% | $100.00 | $76.00 | -24.00% |
| Class A common stock of Facebook, Inc. | 10.00% | $100.00 | $74.00 | -26.00% |
| Common stock of Gilead Sciences, Inc. | 10.00% | $100.00 | $86.00 | -14.00% |
| Ordinary shares of Medtronic Public Limited Company | 10.00% | $100.00 | $97.00 | -3.00% |
| Common stock of Netflix, Inc. | 10.00% | $100.00 | $85.00 | -15.00% |
| Common stock of Starbucks Corporation | 10.00% | $100.00 | $90.00 | -10.00% |
| Closing Level of the Basket: | 100 × [1 + (-10.00% × 10.00%) + (-20.00% × 10.00%) + (-23.00% × 10.00%) + (-5.00% × 10.00%) + (-24.00% × 10.00%) + (-26.00% × 10.00%) + (-14.00% × 10.00%) + (-3.00% × 10.00%) + (-15.00% × 10.00%) + (-10.00% × 10.00%)] = 85 | |||
A closing level of the Basket of 85 represents a 15% decline in the level of the Basket from the Initial Basket Level.
11
Example 3 — On the Final Valuation Date, four Underlying Stocks close below their Initial Prices and six Underlying Stocks close above their Initial Prices.
| Underlying Stock | Weight | Initial Price | Final Price | Stock Return |
| Class A common stock of Alphabet Inc. | 10.00% | $100.00 | $60.00 | -40.00% |
| Common stock of Amazon.com, Inc. | 10.00% | $100.00 | $110.00 | 10.00% |
| Common stock of Apple Inc. | 10.00% | $100.00 | $70.00 | -30.00% |
| Common stock of Cisco Systems, Inc. | 10.00% | $100.00 | $138.00 | 38.00% |
| Class A common stock of Comcast Corporation | 10.00% | $100.00 | $74.00 | -26.00% |
| Class A common stock of Facebook, Inc. | 10.00% | $100.00 | $110.00 | 10.00% |
| Common stock of Gilead Sciences, Inc. | 10.00% | $100.00 | $71.00 | -29.00% |
| Ordinary shares of Medtronic Public Limited Company | 10.00% | $100.00 | $108.00 | 8.00% |
| Common stock of Netflix, Inc. | 10.00% | $100.00 | $105.00 | 5.00% |
| Common stock of Starbucks Corporation | 10.00% | $100.00 | $104.00 | 4.00% |
| Closing Level of the Basket: | 100 × [1 + (-40.00% × 10.00%) + (10.00% × 10.00%) + (-30.00% × 10.00%) + (38.00% × 10.00%) + (-26.00% × 10.00%) + (10.00% × 10.00%) + (-29.00% × 10.00%) + (8.00% × 10.00%) + (5.00% × 10.00%) + (4.00% × 10.00%)] = 95 | |||
A closing level of the Basket of 95 represents a 5% decline in the level of the Basket from the Initial Basket Level.
Example 4 — On the Final Valuation Date, six Underlying Stocks close below their Initial Prices and four Underlying Stocks close above their Initial Prices.
| Underlying Stock | Weight | Initial Price | Final Price | Stock Return |
| Class A common stock of Alphabet Inc. | 10.00% | $100.00 | $72.00 | -28.00% |
| Common stock of Amazon.com, Inc. | 10.00% | $100.00 | $70.00 | -30.00% |
| Common stock of Apple Inc. | 10.00% | $100.00 | $60.00 | -40.00% |
| Common stock of Cisco Systems, Inc. | 10.00% | $100.00 | $160.00 | +60.00% |
| Class A common stock of Comcast Corporation | 10.00% | $100.00 | $63.00 | -37.00% |
| Class A common stock of Facebook, Inc. | 10.00% | $100.00 | $150.00 | +50.00% |
| Common stock of Gilead Sciences, Inc. | 10.00% | $100.00 | $66.00 | -34.00% |
| Ordinary shares of Medtronic Public Limited Company | 10.00% | $100.00 | $84.00 | -16.00% |
| Common stock of Netflix, Inc. | 10.00% | $100.00 | $150.00 | +50.00% |
| Common stock of Starbucks Corporation | 10.00% | $100.00 | $155.00 | +55.00% |
| Closing Level of the Basket: | 100 × [1 + (-28.00% × 10.00%) + (-30.00% × 10.00%) + (-40.00% × 10.00%) + (60.00% × 10.00%) + (-37.00% × 10.00%) + (50.00% × 10.00%) + (-34.00% × 10.00%) + (-16.00% × 10.00%) + (50.00% × 10.00%) + (55.00% × 10.00%)] = 103 | |||
A closing level of the Basket of 103 represents a 3% increase in the level of the Basket from the Initial Basket Level.
12
The Basket
The following graph shows the daily hypothetical performance of the Basket from May 18, 2012 through February 10, 2016, assuming that the closing level of the Basket on May 18, 2012 was 100 and that the Underlying Stocks on those dates were weighted as specified in the "Indicative Terms" on page 4 of this pricing supplement. The hypothetical historical daily Basket performance data in this graph was determined using the closing prices of one share of each Underlying Stock reported by the Bloomberg Professional® service ("Bloomberg") for those dates, without independent verification. The hypothetical historical performance of the Basket displayed below is a reflection of the aggregated historical performance of the Underlying Stocks as described above.
Past performance of the Basket is not indicative of the future performance of the Basket. See "Key Risks — Risks Relating to the Securities Generally — Historical Performance of the Basket Should Not be Taken as an Indication of the Future Performance of the Basket During the Term of the Securities."

13
The Underlying Stocks
Included on the following pages is a brief description of the Underlying Stocks. This information has been obtained from publicly available sources, without independent verification. Set forth below is a table that provides the quarterly high and low closing prices of one share of each underlying stock. Except as set forth below, this information given below is for the four calendar quarters in each of 2011, 2012, 2013, 2014 and 2015 and the first calendar quarter of 2016. Partial data is provided for the first calendar quarter of 2016. We obtained the closing price information set forth below from Bloomberg, without independent verification. You should not take the historical prices of any Underlying Stock as an indication of future performance.
Alphabet Inc.
According to its publicly available filings with the SEC, Alphabet Inc., which we refer to as Alphabet, is a holding company that, through its subsidiaries (which include Google Inc.), provides web-based search, advertisements, maps, software applications, mobile operating systems, consumer content, enterprise solutions, commerce and hardware products. Alphabet became the successor SEC registrant to, and parent holding company of, Google Inc. on October 2, 2015, in connection with a holding company reorganization. Alphabet's Class A common stock began trading on October 5, 2015 under the ticker symbol "GOOGL," the same symbol under which Google Inc.'s Class A common stock previously traded. The Class A common stock of Alphabet, par value $0.001 per share (Bloomberg ticker: GOOGL), is listed on The NASDAQ Stock Market, which we refer to as the relevant exchange for purposes of Alphabet in the accompanying product supplement no. UBS-1a-I. Alphabet's SEC file number is 001-37580 and the SEC file number of its predecessor SEC registrant, Google Inc., is 001-36380.
Historical Information Regarding the Class A Common Stock of Google Inc. and the Class A Common Stock of Alphabet
The following table* sets forth the quarterly high and low closing prices of one share of the Class A common stock of Google Inc. or of one share of the Class A common stock of Alphabet, as applicable, based on daily closing prices on the primary exchange for Google Inc. and Alphabet, respectively, as reported by Bloomberg. The closing price of one share of the Class A common stock of Alphabet on February 10, 2016 was $706.85. The actual Initial Price will be the closing price of one share of the Class A common stock of Alphabet on the Trade Date. We obtained the closing prices and other information below from Bloomberg, without independent verification. The closing prices and this other information may have been adjusted by Bloomberg for corporate actions such as stock splits, public offerings, mergers and acquisitions, spin-offs, delistings and bankruptcy.
Since their inception, the price of one share of the Class A common stock of Google Inc. and the price of one share of the Class A common stock of Alphabet have experienced significant fluctuations. The historical performance of the Class A common stock of Google Inc. and the Class A common stock of Alphabet should not be taken as an indication of future performance, and no assurance can be given as to the closing prices of one share of the Class A common stock of Alphabet during the term of the Securities.
| Quarter Begin | Quarter End | Quarterly Closing High | Quarterly Closing Low | Close | ||||||||||
| 1/1/2011 | 3/31/2011 | $320.13 | $278.82 | $293.39 | ||||||||||
| 4/1/2011 | 6/30/2011 | $296.19 | $237.67 | $253.44 | ||||||||||
| 7/1/2011 | 9/30/2011 | $311.53 | $245.70 | $257.44 | ||||||||||
| 10/1/2011 | 12/31/2011 | $323.26 | $248.00 | $323.26 | ||||||||||
| 1/1/2012 | 3/31/2012 | $334.46 | $284.33 | $320.93 | ||||||||||
| 4/1/2012 | 6/30/2012 | $325.82 | $279.80 | $290.32 | ||||||||||
| 7/1/2012 | 9/30/2012 | $378.62 | $285.52 | $377.62 | ||||||||||
| 10/1/2012 | 12/31/2012 | $384.40 | $323.90 | $355.03 | ||||||||||
| 1/1/2013 | 3/31/2013 | $419.75 | $351.78 | $397.40 | ||||||||||
| 4/1/2013 | 6/30/2013 | $458.39 | $383.05 | $440.61 | ||||||||||
| 7/1/2013 | 9/30/2013 | $462.79 | $423.86 | $438.38 | ||||||||||
| 10/1/2013 | 12/31/2013 | $560.90 | $427.25 | $560.90 | ||||||||||
| 1/1/2014 | 3/31/2014 | $610.68 | $551.15 | $557.80 | ||||||||||
| 4/1/2014 | 6/30/2014 | $585.93 | $518.00 | $584.67 | ||||||||||
| 7/1/2014 | 9/30/2014 | $605.40 | $571.81 | $588.41 | ||||||||||
| 10/1/2014 | 12/31/2014 | $587.78 | $498.16 | $530.66 | ||||||||||
| 1/1/2015 | 3/31/2015 | $581.44 | $497.06 | $554.70 | ||||||||||
| 4/1/2015 | 6/30/2015 | $573.66 | $532.74 | $540.04 | ||||||||||
| 7/1/2015 | 9/30/2015 | $699.62 | $541.70 | $638.37 | ||||||||||
| 10/1/2015 | 12/31/2015 | $793.96 | $642.00 | $778.01 | ||||||||||
| 1/1/2016 | 2/10/2016 | ** | $780.91 | $701.02 | $706.85 |
| * | The data in the table above prior to October 5, 2015 reflects the performance of the Class A common stock of Google Inc. and the data on and after October 5, 2015 reflects the performance of the Class A common stock of Alphabet. |
| ** | As of the date of this pricing supplement, available information for the first calendar quarter of 2016 includes data for the period from January 1, 2016 through February 10, 2016. Accordingly, the "Quarterly Closing High," "Quarterly Closing Low" and "Close" data indicated are for this shortened period only and do not reflect complete data for the first calendar quarter of 2016. |
14
The graph below illustrates the daily performance of the Class A common stock of Google Inc. from January 3, 2006 through October 2, 2015 and the daily performance of the Class A common stock of Alphabet from October 5, 2015 through February 10, 2016, based on information from Bloomberg, without independent verification. The Class A common stock of Alphabet began trading on The NASDAQ Stock Market on October 5, 2015.
Past performance of the Class A common stock of Alphabet is not indicative of its future performance.
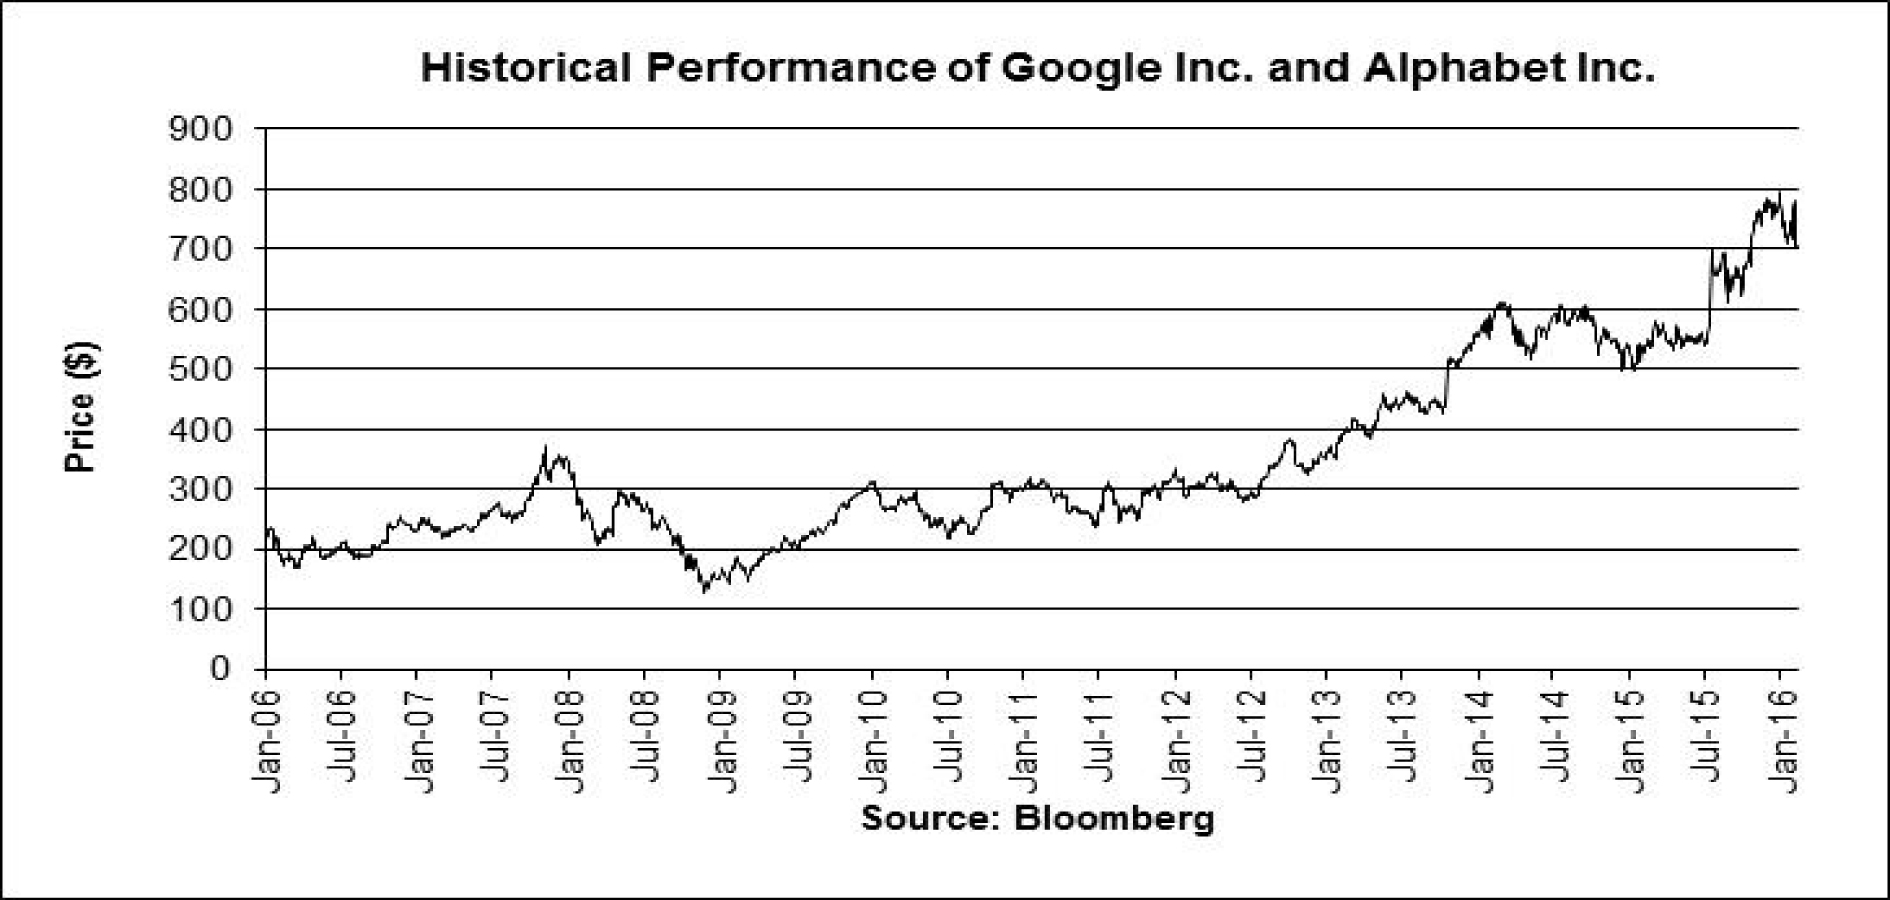
The historical performance of the Underlying Stock should not be taken as an indication of future performance, and no assurance can be given as to the closing price of one share of the Underlying Stock on the Trade Date or the Final Valuation Date. We cannot give you assurance that the performance of the Underlying Stock will result in the return of more than 10% of your principal amount, subject to the credit Risk of JPMorgan Chase & Co.
15
Amazon.com, Inc.
According to its publicly available filings with the SEC, Amazon.com, Inc., which we refer to as Amazon, Amazon operates retail websites, manufactures and sells electronic devices, offers programs that enable selling products on its websites and on sellers' own branded websites and to fulfill orders through Amazon, provides a set of global compute, storage, database and other service offerings to developers and enterprises and provides an online publishing platform. The common stock of Amazon, par value $0.01 per share (Bloomberg ticker: AMZN), is listed on The NASDAQ Stock Market, which we refer to as the relevant exchange for purposes of Amazon in the accompanying product supplement no. UBS-1a-I. Amazon's SEC file number is 000-22513.
Historical Information Regarding the Common Stock of Amazon
The following table sets forth the quarterly high and low closing prices of one share of the common stock of Amazon, based on daily closing prices on the primary exchange for Amazon, as reported by Bloomberg. The closing price of one share of the common stock of Amazon on February 10, 2016 was $490.48. The actual Initial Price will be the closing price of one share of the common stock of Amazon on the Trade Date. We obtained the closing prices and other information below from Bloomberg, without independent verification. The closing prices and this other information may have been adjusted by Bloomberg for corporate actions such as stock splits, public offerings, mergers and acquisitions, spin-offs, delistings and bankruptcy.
Since its inception, the price of one share of the common stock of Amazon has experienced significant fluctuations. The historical performance of the common stock of Amazon should not be taken as an indication of future performance, and no assurance can be given as to the closing prices of one share of the common stock of Amazon during the term of the Securities.
| Quarter Begin | Quarter End | Quarterly Closing High | Quarterly Closing Low | Close | ||||||||||
| 1/1/2011 | 3/31/2011 | $191.25 | $160.97 | $180.13 | ||||||||||
| 4/1/2011 | 6/30/2011 | $206.07 | $178.34 | $204.49 | ||||||||||
| 7/1/2011 | 9/30/2011 | $241.69 | $177.79 | $216.23 | ||||||||||
| 10/1/2011 | 12/31/2011 | $246.71 | $173.10 | $173.10 | ||||||||||
| 1/1/2012 | 3/31/2012 | $205.44 | $175.93 | $202.51 | ||||||||||
| 4/1/2012 | 6/30/2012 | $231.90 | $185.50 | $228.35 | ||||||||||
| 7/1/2012 | 9/30/2012 | $261.68 | $215.36 | $254.32 | ||||||||||
| 10/1/2012 | 12/31/2012 | $261.50 | $220.64 | $251.14 | ||||||||||
| 1/1/2013 | 3/31/2013 | $283.99 | $253.39 | $266.49 | ||||||||||
| 4/1/2013 | 6/30/2013 | $281.76 | $248.23 | $277.69 | ||||||||||
| 7/1/2013 | 9/30/2013 | $318.12 | $280.93 | $312.64 | ||||||||||
| 10/1/2013 | 12/31/2013 | $404.39 | $298.23 | $398.79 | ||||||||||
| 1/1/2014 | 3/31/2014 | $407.05 | $336.52 | $336.52 | ||||||||||
| 4/1/2014 | 6/30/2014 | $342.99 | $288.32 | $324.78 | ||||||||||
| 7/1/2014 | 9/30/2014 | $360.84 | $307.06 | $322.44 | ||||||||||
| 10/1/2014 | 12/31/2014 | $338.64 | $287.06 | $310.35 | ||||||||||
| 1/1/2015 | 3/31/2015 | $387.83 | $286.95 | $372.10 | ||||||||||
| 4/1/2015 | 6/30/2015 | $445.99 | $370.26 | $434.09 | ||||||||||
| 7/1/2015 | 9/30/2015 | $548.39 | $429.70 | $511.89 | ||||||||||
| 10/1/2015 | 12/31/2015 | $693.97 | $520.72 | $675.89 | ||||||||||
| 1/1/2016 | 2/10/2016 | * | $636.99 | $482.07 | $490.48 |
| * | As of the date of this pricing supplement, available information for the first calendar quarter of 2016 includes data for the period from January 1, 2016 through February 10, 2016. Accordingly, the "Quarterly Closing High," "Quarterly Closing Low" and "Close" data indicated are for this shortened period only and do not reflect complete data for the first calendar quarter of 2016. |
16
The graph below illustrates the daily performance of the common stock of Amazon from January 3, 2006 through February 10, 2016, based on information from Bloomberg, without independent verification.
Past performance of the common stock of Amazon is not indicative of its future performance.
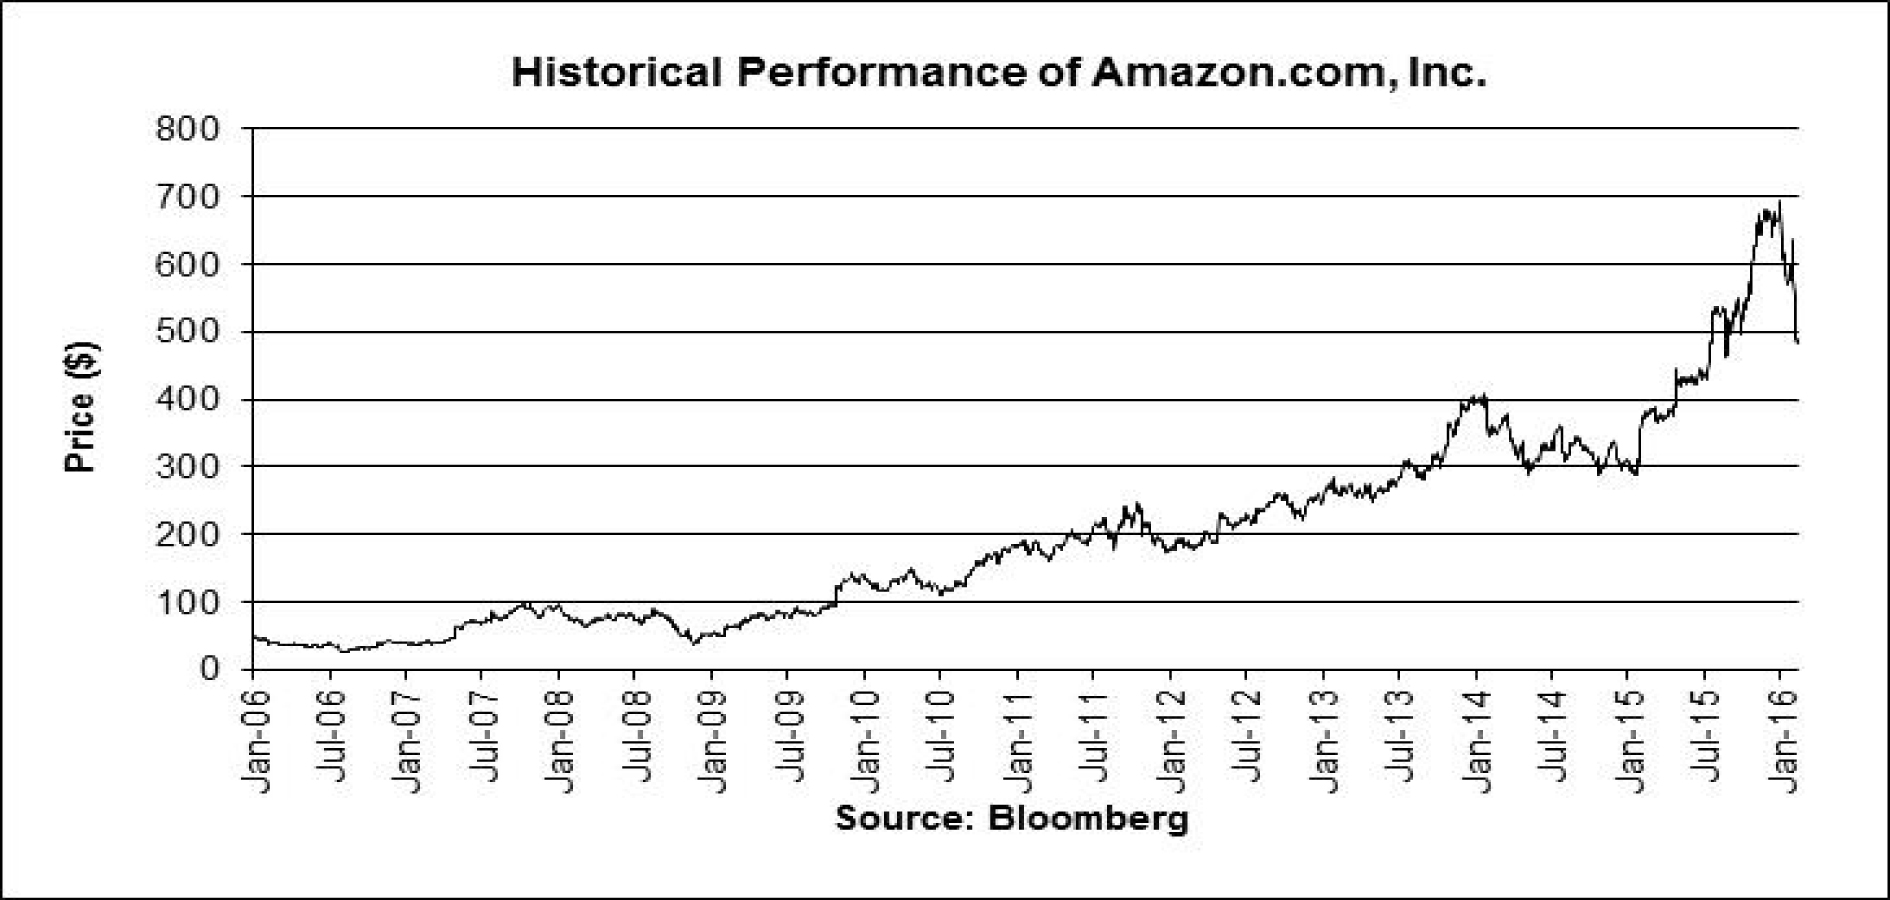
The historical performance of the Underlying Stock should not be taken as an indication of future performance, and no assurance can be given as to the closing price of one share of the Underlying Stock on the Trade Date or the Final Valuation Date. We cannot give you assurance that the performance of the Underlying Stock will result in the return of more than 10% of your principal amount, subject to the credit Risk of JPMorgan Chase & Co.
17
Apple Inc.
According to its publicly available filings with the SEC, Apple Inc., which we refer to as Apple, designs, manufactures and markets mobile communication and media devices, personal computers and portable digital music players, and sells a variety of related software, services, accessories, networking solutions and third-party digital content and applications. The common stock of Apple, par value $0.00001 per share (Bloomberg ticker: AAPL), is listed on The NASDAQ Stock Market, which we refer to as the relevant exchange for purposes of Apple in the accompanying product supplement no. UBS-1a-I. Apple's SEC file number is 001-36743.
Historical Information Regarding the Common Stock of Apple
The following table sets forth the quarterly high and low closing prices of one share of the common stock of Apple, based on daily closing prices on the primary exchange for Apple, as reported by Bloomberg. The closing price of one share of the common stock of Apple on February 10, 2016 was $94.27. The actual Initial Price will be the closing price of one share of the common stock of Apple on the Trade Date. We obtained the closing prices and other information below from Bloomberg, without independent verification. The closing prices and this other information have been adjusted by Bloomberg for corporate actions such as stock splits, public offerings, mergers and acquisitions, spin-offs, delistings and bankruptcy.
Since its inception, the price of one share of the common stock of Apple has experienced significant fluctuations. The historical performance of the common stock of Apple should not be taken as an indication of future performance, and no assurance can be given as to the closing prices of one share of the common stock of Apple during the term of the Securities.
| Quarter Begin | Quarter End | Quarterly Closing High | Quarterly Closing Low | Close | ||||||||||
| 1/1/2011 | 3/31/2011 | $51.88 | $46.67 | $49.78 | ||||||||||
| 4/1/2011 | 6/30/2011 | $50.44 | $45.05 | $47.95 | ||||||||||
| 7/1/2011 | 9/30/2011 | $59.06 | $49.03 | $54.45 | ||||||||||
| 10/1/2011 | 12/31/2011 | $60.32 | $51.93 | $57.86 | ||||||||||
| 1/1/2012 | 3/31/2012 | $88.23 | $58.75 | $85.64 | ||||||||||
| 4/1/2012 | 6/30/2012 | $90.89 | $75.73 | $83.43 | ||||||||||
| 7/1/2012 | 9/30/2012 | $100.30 | $82.13 | $95.32 | ||||||||||
| 10/1/2012 | 12/31/2012 | $95.96 | $72.71 | $76.15 | ||||||||||
| 1/1/2013 | 3/31/2013 | $78.43 | $60.01 | $63.23 | ||||||||||
| 4/1/2013 | 6/30/2013 | $66.26 | $55.79 | $56.58 | ||||||||||
| 7/1/2013 | 9/30/2013 | $72.53 | $58.46 | $68.11 | ||||||||||
| 10/1/2013 | 12/31/2013 | $81.44 | $68.71 | $80.16 | ||||||||||
| 1/1/2014 | 3/31/2014 | $79.62 | $71.35 | $76.68 | ||||||||||
| 4/1/2014 | 6/30/2014 | $94.25 | $73.99 | $92.93 | ||||||||||
| 7/1/2014 | 9/30/2014 | $103.30 | $93.08 | $100.75 | ||||||||||
| 10/1/2014 | 12/31/2014 | $119.00 | $96.26 | $110.38 | ||||||||||
| 1/1/2015 | 3/31/2015 | $133.00 | $105.99 | $124.43 | ||||||||||
| 4/1/2015 | 6/30/2015 | $132.65 | $124.25 | $125.43 | ||||||||||
| 7/1/2015 | 9/30/2015 | $132.07 | $103.12 | $110.30 | ||||||||||
| 10/1/2015 | 12/31/2015 | $122.57 | $105.26 | $105.26 | ||||||||||
| 1/1/2016 | 2/10/2016 | * | $105.35 | $93.42 | $94.27 |
| * | As of the date of this pricing supplement, available information for the first calendar quarter of 2016 includes data for the period from January 1, 2016 through February 10, 2016. Accordingly, the "Quarterly Closing High," "Quarterly Closing Low" and "Close" data indicated are for this shortened period only and do not reflect complete data for the first calendar quarter of 2016. |
18
The graph below illustrates the daily performance of the common stock of Apple from January 3, 2006 through February 10, 2016, based on information from Bloomberg, without independent verification.
Past performance of the common stock of Apple is not indicative of its future performance.
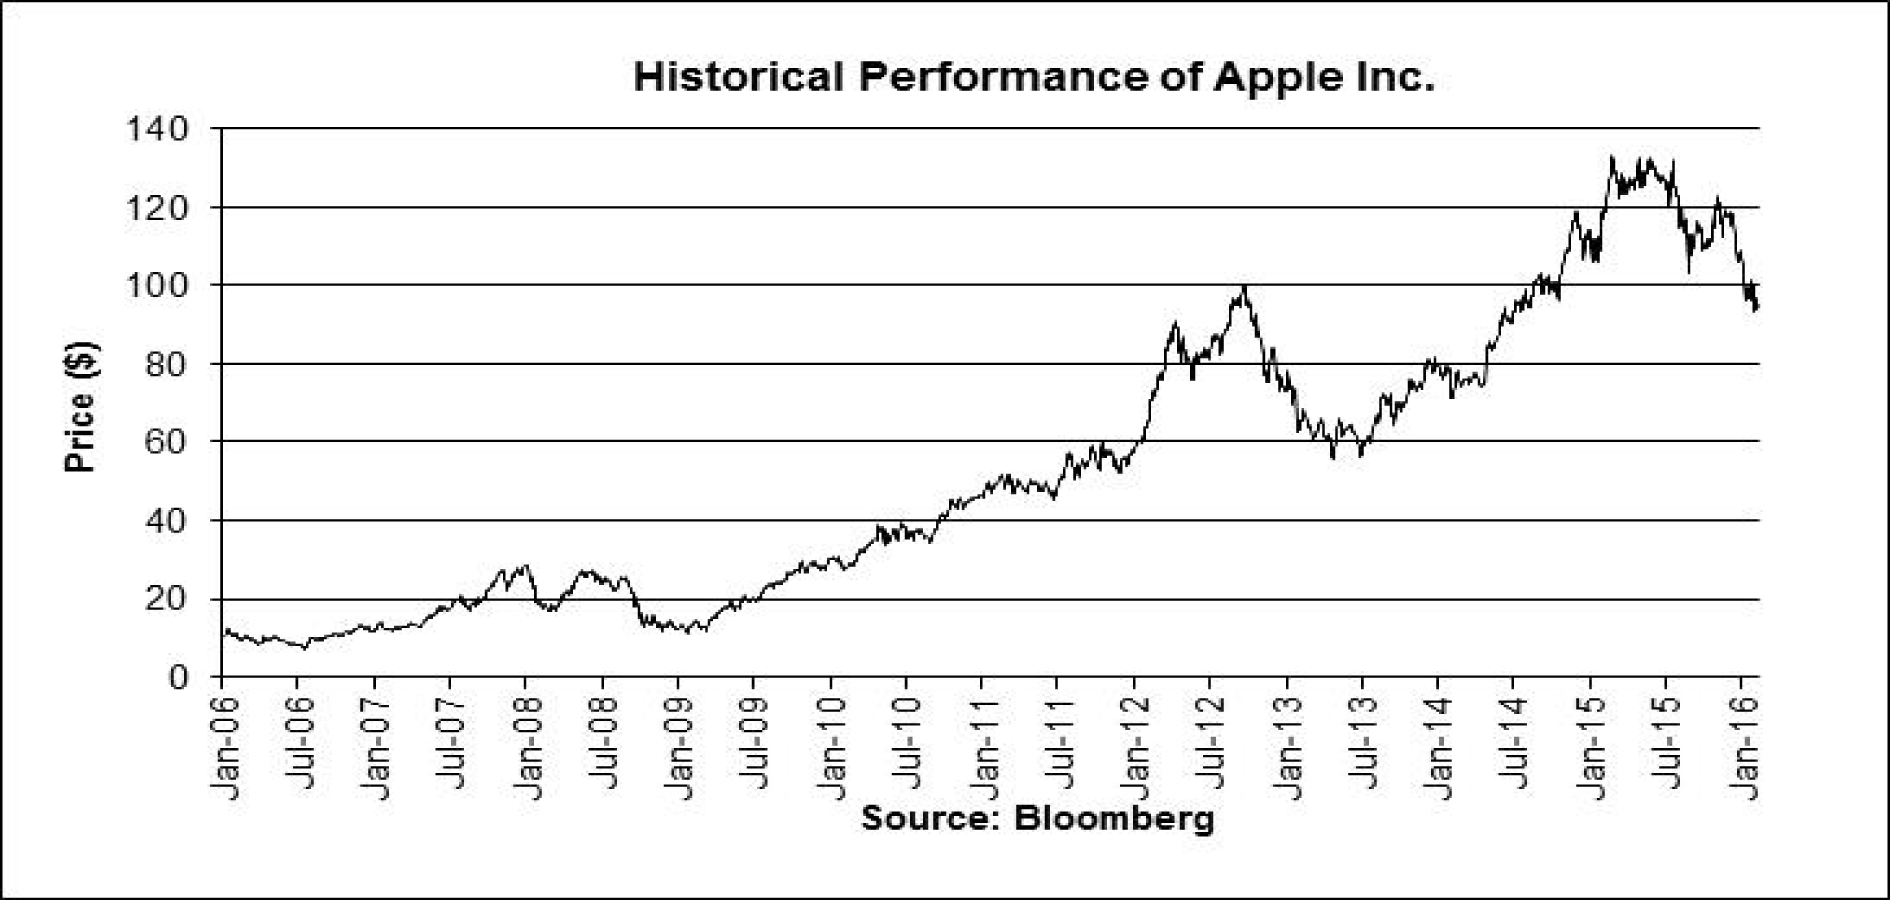
The historical performance of the Underlying Stock should not be taken as an indication of future performance, and no assurance can be given as to the closing price of one share of the Underlying Stock on the Trade Date or the Final Valuation Date. We cannot give you assurance that the performance of the Underlying Stock will result in the return of more than 10% of your principal amount, subject to the credit Risk of JPMorgan Chase & Co.
19
Cisco Systems, Inc.
According to its publicly available filings with the SEC, Cisco Systems, Inc., which we refer to as Cisco, designs and sells products, provides services and delivers integrated solutions to develop and connect networks around the world. The common stock of Cisco, par value $0.001 per share (Bloomberg ticker: CSCO), is listed on The NASDAQ Stock Market, which we refer to as the relevant exchange for purposes of Cisco in the accompanying product supplement no. UBS-1a-I. Cisco's SEC file number is 000-18225.
Historical Information Regarding the Common Stock of Cisco
The following table sets forth the quarterly high and low closing prices of one share of the common stock of Cisco, based on daily closing prices on the primary exchange for Cisco, as reported by Bloomberg. The closing price of one share of the common stock of Cisco on February 10, 2016 was $22.51. The actual Initial Price will be the closing price of one share of the common stock of Cisco on the Trade Date. We obtained the closing prices and other information below from Bloomberg, without independent verification. The closing prices and this other information may have been adjusted by Bloomberg for corporate actions such as stock splits, public offerings, mergers and acquisitions, spin-offs, delistings and bankruptcy.
Since its inception, the price of one share of the common stock of Cisco has experienced significant fluctuations. The historical performance of the common stock of Cisco should not be taken as an indication of future performance, and no assurance can be given as to the closing prices of one share of the common stock of Cisco during the term of the Securities.
| Quarter Begin | Quarter End | Quarterly Closing High | Quarterly Closing Low | Close | ||||||||||
| 1/1/2011 | 3/31/2011 | $22.06 | $17.00 | $17.15 | ||||||||||
| 4/1/2011 | 6/30/2011 | $18.07 | $14.85 | $15.61 | ||||||||||
| 7/1/2011 | 9/30/2011 | $16.67 | $13.73 | $15.49 | ||||||||||
| 10/1/2011 | 12/31/2011 | $19.12 | $15.19 | $18.08 | ||||||||||
| 1/1/2012 | 3/31/2012 | $21.15 | $18.66 | $21.15 | ||||||||||
| 4/1/2012 | 6/30/2012 | $21.20 | $15.97 | $17.17 | ||||||||||
| 7/1/2012 | 9/30/2012 | $19.73 | $15.14 | $19.09 | ||||||||||
| 10/1/2012 | 12/31/2012 | $20.39 | $16.82 | $19.65 | ||||||||||
| 1/1/2013 | 3/31/2013 | $21.94 | $20.30 | $20.91 | ||||||||||
| 4/1/2013 | 6/30/2013 | $24.82 | $20.38 | $24.31 | ||||||||||
| 7/1/2013 | 9/30/2013 | $26.37 | $23.31 | $23.42 | ||||||||||
| 10/1/2013 | 12/31/2013 | $23.99 | $20.24 | $22.45 | ||||||||||
| 1/1/2014 | 3/31/2014 | $22.85 | $21.35 | $22.41 | ||||||||||
| 4/1/2014 | 6/30/2014 | $25.04 | $22.46 | $24.85 | ||||||||||
| 7/1/2014 | 9/30/2014 | $25.98 | $24.43 | $25.17 | ||||||||||
| 10/1/2014 | 12/31/2014 | $28.46 | $22.82 | $27.82 | ||||||||||
| 1/1/2015 | 3/31/2015 | $30.19 | $26.37 | $27.53 | ||||||||||
| 4/1/2015 | 6/30/2015 | $29.76 | $27.13 | $27.46 | ||||||||||
| 7/1/2015 | 9/30/2015 | $29.03 | $24.62 | $26.25 | ||||||||||
| 10/1/2015 | 12/31/2015 | $29.36 | $25.73 | $27.16 | ||||||||||
| 1/1/2016 | 2/10/2016 | * | $26.41 | $22.51 | $22.51 |
| * | As of the date of this pricing supplement, available information for the first calendar quarter of 2016 includes data for the period from January 1, 2016 through February 10, 2016. Accordingly, the "Quarterly Closing High," "Quarterly Closing Low" and "Close" data indicated are for this shortened period only and do not reflect complete data for the first calendar quarter of 2016. |
20
The graph below illustrates the daily performance of the common stock of Cisco from January 3, 2006 through February 10, 2016, based on information from Bloomberg, without independent verification.
Past performance of the common stock of Cisco is not indicative of its future performance.
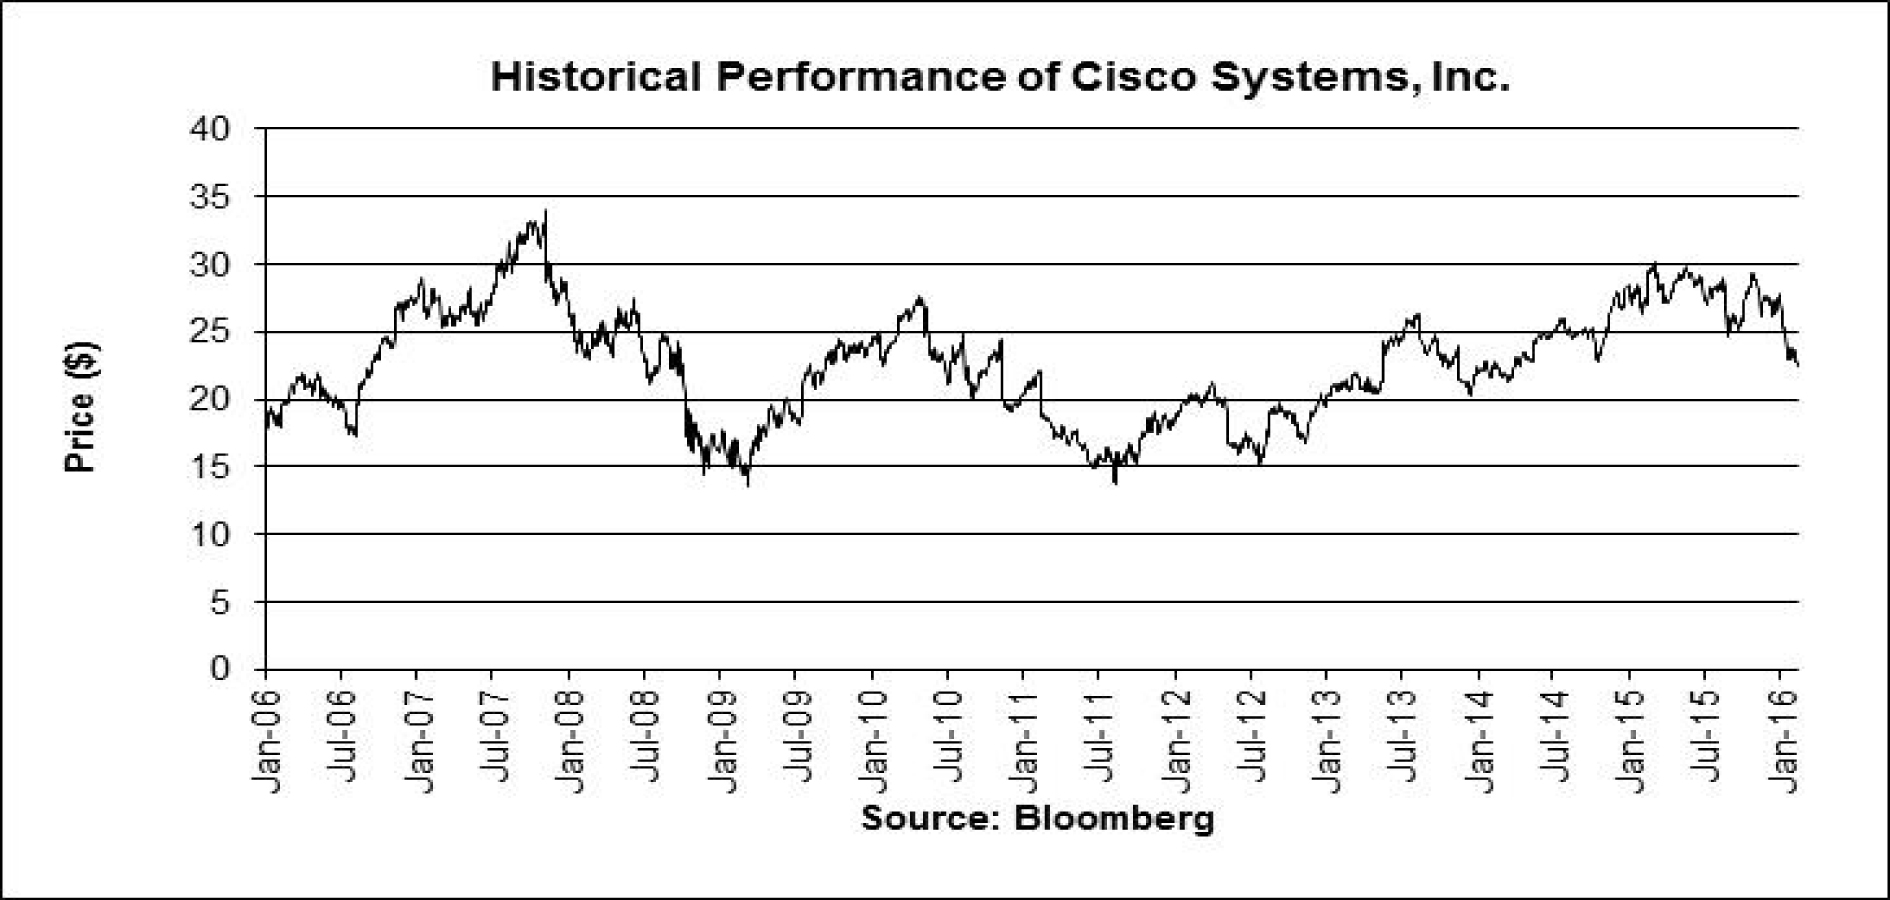
The historical performance of the Underlying Stock should not be taken as an indication of future performance, and no assurance can be given as to the closing price of one share of the Underlying Stock on the Trade Date or the Final Valuation Date. We cannot give you assurance that the performance of the Underlying Stock will result in the return of more than 10% of your principal amount, subject to the credit Risk of JPMorgan Chase & Co.
21
Comcast Corporation
According to its publicly available filings with the SEC, Comcast Corporation, which we refer to as Comcast, is a global media and technology company. The Class A common stock of Comcast, par value $0.01 per share (Bloomberg ticker: CMCSA), is listed on The NASDAQ Stock Market, which we refer to as the relevant exchange for purposes of Comcast in the accompanying product supplement no. UBS-1a-I. Comcast's SEC file number is 001-32871.
Historical Information Regarding the Class A common stock of Comcast
The following table sets forth the quarterly high and low closing prices of one share of the Class A common stock of Comcast, based on daily closing prices on the primary exchange for Comcast, as reported by Bloomberg. The closing price of one share of the Class A common stock of Comcast on February 10, 2016 was $55.81. The actual Initial Price will be the closing price of one share of the Class A common stock of Comcast on the Trade Date. We obtained the closing prices and other information below from Bloomberg, without independent verification. The closing prices and this other information may have been adjusted by Bloomberg for corporate actions such as stock splits, public offerings, mergers and acquisitions, spin-offs, delistings and bankruptcy.
Since its inception, the price of one share of the Class A common stock of Comcast has experienced significant fluctuations. The historical performance of the Class A common stock of Comcast should not be taken as an indication of future performance, and no assurance can be given as to the closing prices of one share of the Class A common stock of Comcast during the term of the Securities.
| Quarter Begin | Quarter End | Quarterly Closing High | Quarterly Closing Low | Close | ||||||||||
| 1/1/2011 | 3/31/2011 | $25.77 | $22.37 | $24.72 | ||||||||||
| 4/1/2011 | 6/30/2011 | $26.68 | $23.44 | $25.34 | ||||||||||
| 7/1/2011 | 9/30/2011 | $25.97 | $19.78 | $20.90 | ||||||||||
| 10/1/2011 | 12/31/2011 | $24.81 | $20.36 | $23.71 | ||||||||||
| 1/1/2012 | 3/31/2012 | $30.35 | $24.53 | $30.01 | ||||||||||
| 4/1/2012 | 6/30/2012 | $31.97 | $28.28 | $31.97 | ||||||||||
| 7/1/2012 | 9/30/2012 | $36.41 | $31.10 | $35.77 | ||||||||||
| 10/1/2012 | 12/31/2012 | $38.12 | $35.13 | $37.38 | ||||||||||
| 1/1/2013 | 3/31/2013 | $42.01 | $37.90 | $42.01 | ||||||||||
| 4/1/2013 | 6/30/2013 | $43.72 | $38.90 | $41.88 | ||||||||||
| 7/1/2013 | 9/30/2013 | $45.84 | $40.66 | $45.15 | ||||||||||
| 10/1/2013 | 12/31/2013 | $51.97 | $44.33 | $51.97 | ||||||||||
| 1/1/2014 | 3/31/2014 | $55.24 | $49.10 | $50.02 | ||||||||||
| 4/1/2014 | 6/30/2014 | $54.10 | $47.96 | $53.68 | ||||||||||
| 7/1/2014 | 9/30/2014 | $57.23 | $52.68 | $53.78 | ||||||||||
| 10/1/2014 | 12/31/2014 | $58.88 | $49.59 | $58.01 | ||||||||||
| 1/1/2015 | 3/31/2015 | $60.57 | $53.15 | $56.47 | ||||||||||
| 4/1/2015 | 6/30/2015 | $61.27 | $56.28 | $60.14 | ||||||||||
| 7/1/2015 | 9/30/2015 | $64.50 | $53.85 | $56.88 | ||||||||||
| 10/1/2015 | 12/31/2015 | $63.06 | $56.40 | $56.43 | ||||||||||
| 1/1/2016 | 2/10/2016 | * | $59.41 | $53.55 | $55.81 |
| * | As of the date of this pricing supplement, available information for the first calendar quarter of 2016 includes data for the period from January 1, 2016 through February 10, 2016. Accordingly, the "Quarterly Closing High," "Quarterly Closing Low" and "Close" data indicated are for this shortened period only and do not reflect complete data for the first calendar quarter of 2016. |
22
The graph below illustrates the daily performance of the Class A common stock of Comcast from January 3, 2006 through February 10, 2016, based on information from Bloomberg, without independent verification.
Past performance of the Class A common stock of Comcast is not indicative of its future performance.
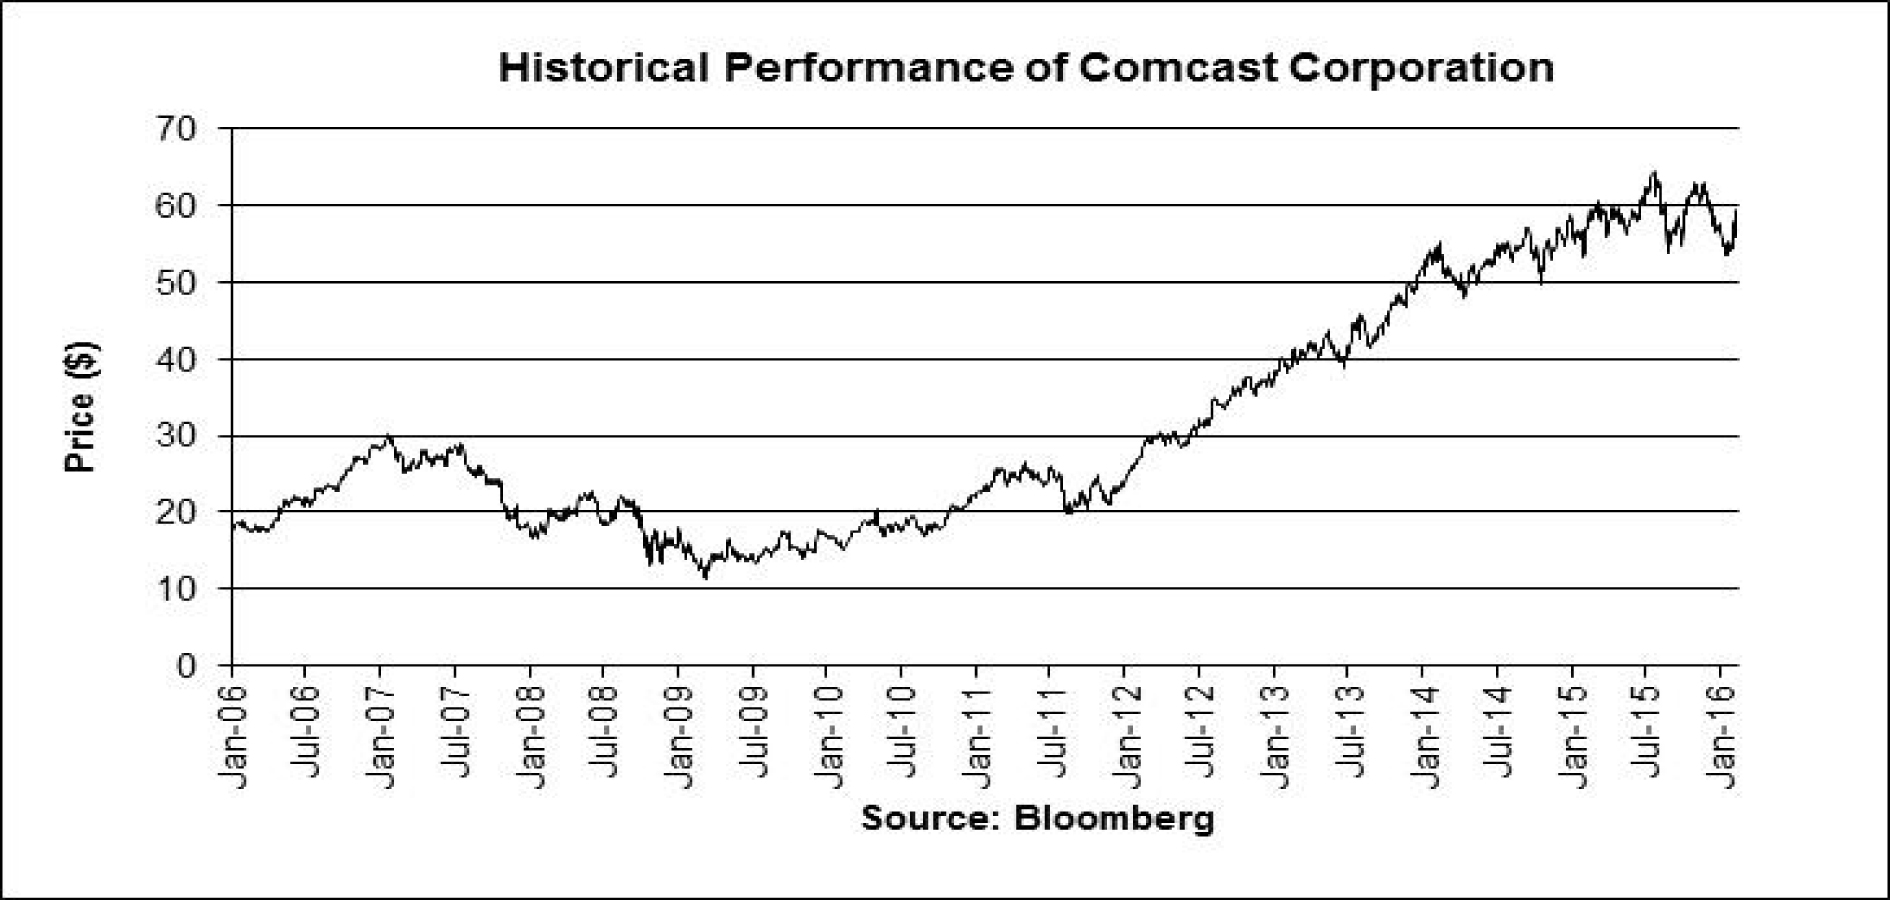
The historical performance of the Underlying Stock should not be taken as an indication of future performance, and no assurance can be given as to the closing price of one share of the Underlying Stock on the Trade Date or the Final Valuation Date. We cannot give you assurance that the performance of the Underlying Stock will result in the return of more than 10% of your principal amount, subject to the credit Risk of JPMorgan Chase & Co.
23
Facebook, Inc.
According to its publicly available filings with the SEC, Facebook, Inc., which we refer to as Facebook, builds products for users, developers and advertisers. The products allow (i) users to stay connected with friends and family as well as share information, (ii) developers to build applications and websites that integrate with Facebook and (iii) advertisers to have access to information users have shared. The Class A common stock of Facebook, par value $0.000006 per share (Bloomberg ticker: FB), is listed on The NASDAQ Stock Market, which we refer to as the relevant exchange for purposes of Facebook in the accompanying product supplement no. UBS-1a-I. Facebook's SEC file number is 001-35551.
Historical Information Regarding the Class A common stock of Facebook
The following table sets forth the quarterly high and low closing prices of one share of the Class A common stock of Facebook, based on daily closing prices on the primary exchange for Facebook, as reported by Bloomberg. The closing price of one share of the Class A common stock of Facebook on February 10, 2016 was $101.00. The actual Initial Price will be the closing price of one share of the Class A common stock of Facebook on the Trade Date. We obtained the closing prices and other information below from Bloomberg, without independent verification. The closing prices and this other information may have been adjusted by Bloomberg for corporate actions such as stock splits, public offerings, mergers and acquisitions, spin-offs, delistings and bankruptcy.
Since its inception, the price of one share of the Class A common stock of Facebook has experienced significant fluctuations. The historical performance of the Class A common stock of Facebook should not be taken as an indication of future performance, and no assurance can be given as to the closing prices of one share of the Class A common stock of Facebook during the term of the Securities.
| Quarter Begin | Quarter End | Quarterly Closing High | Quarterly Closing Low | Close | ||||||||||
| 5/18/2012 | * | 6/30/2012 | $38.37 | $25.87 | $31.12 | |||||||||
| 7/1/2012 | 9/30/2012 | $32.17 | $17.73 | $21.65 | ||||||||||
| 10/1/2012 | 12/31/2012 | $28.24 | $18.99 | $26.63 | ||||||||||
| 1/1/2013 | 3/31/2013 | $32.46 | $25.14 | $25.58 | ||||||||||
| 4/1/2013 | 6/30/2013 | $28.97 | $22.90 | $24.86 | ||||||||||
| 7/1/2013 | 9/30/2013 | $51.24 | $24.37 | $50.24 | ||||||||||
| 10/1/2013 | 12/31/2013 | $57.96 | $44.82 | $54.66 | ||||||||||
| 1/1/2014 | 3/31/2014 | $72.03 | $53.53 | $60.24 | ||||||||||
| 4/1/2014 | 6/30/2014 | $67.60 | $56.14 | $67.29 | ||||||||||
| 7/1/2014 | 9/30/2014 | $79.04 | $62.76 | $79.04 | ||||||||||
| 10/1/2014 | 12/31/2014 | $81.45 | $72.63 | $78.02 | ||||||||||
| 1/1/2015 | 3/31/2015 | $85.31 | $74.05 | $82.22 | ||||||||||
| 4/1/2015 | 6/30/2015 | $88.86 | $77.46 | $85.77 | ||||||||||
| 7/1/2015 | 9/30/2015 | $98.39 | $82.09 | $89.90 | ||||||||||
| 10/1/2015 | 12/31/2015 | $109.01 | $90.95 | $104.66 | ||||||||||
| 1/1/2016 | 2/10/2016 | ** | $115.09 | $94.16 | $101.00 |
|
* |
The Class A common stock of Facebook commenced trading on May 18, 2012. Accordingly, the "Quarterly Closing High," "Quarterly Closing Low" and "Close" data indicated for the second calendar quarter of 2012 are for the shortened period from May 18, 2012 through June 30, 2012. |
| ** | As of the date of this pricing supplement, available information for the first calendar quarter of 2016 includes data for the period from January 1, 2016 through February 10, 2016. Accordingly, the "Quarterly Closing High," "Quarterly Closing Low" and "Close" data indicated are for this shortened period only and do not reflect complete data for the first calendar quarter of 2016. |
24
The graph below illustrates the daily performance of the Class A common stock of Facebook from May 18, 2012 through February 10, 2016, based on information from Bloomberg, without independent verification. The Class A common stock of Facebook began trading on The NASDAQ Stock Market on May 18, 2012 and therefor has a limited performance history.
Past performance of the Class A common stock of Facebook is not indicative of its future performance.

The historical performance of the Underlying Stock should not be taken as an indication of future performance, and no assurance can be given as to the closing price of one share of the Underlying Stock on the Trade Date or the Final Valuation Date. We cannot give you assurance that the performance of the Underlying Stock will result in the return of more than 10% of your principal amount, subject to the credit Risk of JPMorgan Chase & Co.
25
Gilead Sciences, Inc.
According to its publicly available filings with the SEC, Gilead Sciences, Inc., which we refer to as Gilead, is a research-based biopharmaceutical company that discovers, develops and commercializes innovative medicines in areas of unmet medical need. The common stock of Gilead, par value $0.001 per share (Bloomberg ticker: GILD), is listed on The NASDAQ Stock Market, which we refer to as the relevant exchange for purposes of Gilead in the accompanying product supplement no. UBS-1a-I. Gilead's SEC file number is 001-19731.
Historical Information Regarding the Common Stock of Gilead
The following table sets forth the quarterly high and low closing prices of one share of the common stock of Gilead, based on daily closing prices on the primary exchange for Gilead, as reported by Bloomberg. The closing price of one share of the common stock of Gilead on February 10, 2016 was $87.80. The actual Initial Price will be the closing price of one share of the common stock of Gilead on the Trade Date. We obtained the closing prices and other information below from Bloomberg, without independent verification. The closing prices and this other information may have been adjusted by Bloomberg for corporate actions such as stock splits, public offerings, mergers and acquisitions, spin-offs, delistings and bankruptcy.
Since its inception, the price of one share of the common stock of Gilead has experienced significant fluctuations. The historical performance of the common stock of Gilead should not be taken as an indication of future performance, and no assurance can be given as to the closing prices of one share of the common stock of Gilead during the term of the Securities.
| Quarter Begin | Quarter End | Quarterly Closing High | Quarterly Closing Low | Close | ||||||||||
| 1/1/2011 | 3/31/2011 | $21.26 | $18.29 | $21.22 | ||||||||||
| 4/1/2011 | 6/30/2011 | $21.41 | $19.42 | $20.71 | ||||||||||
| 7/1/2011 | 9/30/2011 | $21.61 | $17.67 | $19.40 | ||||||||||
| 10/1/2011 | 12/31/2011 | $21.40 | $18.13 | $20.47 | ||||||||||
| 1/1/2012 | 3/31/2012 | $28.01 | $20.93 | $24.43 | ||||||||||
| 4/1/2012 | 6/30/2012 | $26.36 | $22.70 | $25.64 | ||||||||||
| 7/1/2012 | 9/30/2012 | $33.89 | $25.33 | $33.17 | ||||||||||
| 10/1/2012 | 12/31/2012 | $38.17 | $32.43 | $36.73 | ||||||||||
| 1/1/2013 | 3/31/2013 | $48.93 | $37.49 | $48.93 | ||||||||||
| 4/1/2013 | 6/30/2013 | $56.41 | $47.20 | $51.21 | ||||||||||
| 7/1/2013 | 9/30/2013 | $64.32 | $51.66 | $62.84 | ||||||||||
| 10/1/2013 | 12/31/2013 | $75.20 | $58.90 | $75.15 | ||||||||||
| 1/1/2014 | 3/31/2014 | $83.95 | $68.55 | $70.86 | ||||||||||
| 4/1/2014 | 6/30/2014 | $83.02 | $65.48 | $82.91 | ||||||||||
| 7/1/2014 | 9/30/2014 | $109.43 | $85.07 | $106.45 | ||||||||||
| 10/1/2014 | 12/31/2014 | $114.22 | $89.45 | $94.26 | ||||||||||
| 1/1/2015 | 3/31/2015 | $107.18 | $94.91 | $98.13 | ||||||||||
| 4/1/2015 | 6/30/2015 | $122.21 | $97.72 | $117.08 | ||||||||||
| 7/1/2015 | 9/30/2015 | $119.60 | $94.80 | $98.19 | ||||||||||
| 10/1/2015 | 12/31/2015 | $110.96 | $97.54 | $101.19 | ||||||||||
| 1/1/2016 | 2/10/2016 | * | $100.30 | $82.71 | $87.80 |
| * | As of the date of this pricing supplement, available information for the first calendar quarter of 2016 includes data for the period from January 1, 2016 through February 10, 2016. Accordingly, the "Quarterly Closing High," "Quarterly Closing Low" and "Close" data indicated are for this shortened period only and do not reflect complete data for the first calendar quarter of 2016. |
26
The graph below illustrates the daily performance of the common stock of Gilead from January 3, 2006 through February 10, 2016, based on information from Bloomberg, without independent verification.
Past performance of the common stock of Gilead is not indicative of its future performance.

The historical performance of the Underlying Stock should not be taken as an indication of future performance, and no assurance can be given as to the closing price of one share of the Underlying Stock on the Trade Date or the Final Valuation Date. We cannot give you assurance that the performance of the Underlying Stock will result in the return of more than 10% of your principal amount, subject to the credit Risk of JPMorgan Chase & Co.
27
Medtronic Public Limited Company
According to its publicly available filings with the SEC, Medtronic Public Limited Company, which we refer to as Medtronic, an Irish company, is a medical technology company serving hospitals, physicians, clinicians, and patients. Medtronic became the successor SEC registrant to, and parent holding company of, Medtronic Inc. and Covidien Public Limited Company on January 26, 2015, in connection with its acquisition of Medtronic Inc. and Covidien Public Limited Company. Medtronic's ordinary shares began trading on January 27, 2015 under the ticker symbol "MDT," the same symbol under which Medtronic Inc.'s common stock previously traded. The ordinary shares of Medtronic, par value $0.0001 per share (Bloomberg ticker: MDT), are listed on the New York Stock Exchange, which we refer to as the relevant exchange for purposes of Medtronic in the accompanying product supplement no. UBS-1a-I. Medtronic's SEC file number is 001-36820.
Historical Information Regarding the Common Stock of Medtronic Inc. and the Ordinary Shares of Medtronic
The following table* sets forth the quarterly high and low closing prices of one share of the common stock of Medtronic Inc. or of one ordinary share of Medtronic, based on daily closing prices on the primary exchange for Medtronic Inc. and Medtronic, respectively, as reported by Bloomberg. The closing price of one ordinary share of Medtronic on February 10, 2016 was $74.16. The actual Initial Price will be the closing price of one ordinary share of Medtronic on the Trade Date. We obtained the closing prices and other information below from Bloomberg, without independent verification. The closing prices and this other information may have been adjusted by Bloomberg for corporate actions such as stock splits, public offerings, mergers and acquisitions, spin-offs, delistings and bankruptcy.
Since its inception, the price of one share of the common stock of Medtronic Inc. and the price of one ordinary share of Medtronic have experienced significant fluctuations. The historical performance of the common stock of Medtronic and the ordinary shares of Medtronic Inc. should not be taken as an indication of future performance, and no assurance can be given as to the closing prices of one ordinary share of Medtronic during the term of the Securities.
| Quarter Begin | Quarter End | Quarterly Closing High | Quarterly Closing Low | Close | ||||||||||
| 1/1/2011 | 3/31/2011 | $41.27 | $36.41 | $39.35 | ||||||||||
| 4/1/2011 | 6/30/2011 | $43.20 | $37.92 | $38.53 | ||||||||||
| 7/1/2011 | 9/30/2011 | $39.11 | $30.41 | $33.24 | ||||||||||
| 10/1/2011 | 12/31/2011 | $38.34 | $31.79 | $38.25 | ||||||||||
| 1/1/2012 | 3/31/2012 | $40.65 | $37.51 | $39.19 | ||||||||||
| 4/1/2012 | 6/30/2012 | $39.54 | $35.89 | $38.73 | ||||||||||
| 7/1/2012 | 9/30/2012 | $43.71 | $37.35 | $43.12 | ||||||||||
| 10/1/2012 | 12/31/2012 | $44.67 | $40.75 | $41.02 | ||||||||||
| 1/1/2013 | 3/31/2013 | $47.22 | $41.88 | $46.96 | ||||||||||
| 4/1/2013 | 6/30/2013 | $53.51 | $45.61 | $51.47 | ||||||||||
| 7/1/2013 | 9/30/2013 | $55.88 | $51.51 | $53.25 | ||||||||||
| 10/1/2013 | 12/31/2013 | $58.84 | $52.46 | $57.39 | ||||||||||
| 1/1/2014 | 3/31/2014 | $61.54 | $53.60 | $61.54 | ||||||||||
| 4/1/2014 | 6/30/2014 | $64.67 | $58.05 | $63.76 | ||||||||||
| 7/1/2014 | 9/30/2014 | $66.53 | $61.00 | $61.95 | ||||||||||
| 10/1/2014 | 12/31/2014 | $75.57 | $61.81 | $72.20 | ||||||||||
| 1/1/2015 | 3/31/2015 | $79.25 | $71.22 | $77.99 | ||||||||||
| 4/1/2015 | 6/30/2015 | $78.79 | $73.30 | $74.10 | ||||||||||
| 7/1/2015 | 9/30/2015 | $78.74 | $64.52 | $66.94 | ||||||||||
| 10/1/2015 | 12/31/2015 | $78.57 | $68.40 | $76.92 | ||||||||||
| 1/1/2016 | 2/10/2016 | * | $76.85 | $72.63 | $74.16 |
|
* |
The data in the table above prior to January 27, 2015 reflects the performance of the common stock of Medtronic Inc. and the data on and after January 27, 2015 reflects the performance of the ordinary shares of Medtronic. |
| ** | As of the date of this pricing supplement, available information for the first calendar quarter of 2016 includes data for the period from January 1, 2016 through February 10, 2016. Accordingly, the "Quarterly Closing High," "Quarterly Closing Low" and "Close" data indicated are for this shortened period only and do not reflect complete data for the first calendar quarter of 2016. |
28
The graph below illustrates the daily performance of the ordinary shares of Medtronic from January 3, 2006 through February 10, 2016, based on information from Bloomberg, without independent verification.
Past performance of the common stock of Medtronic is not indicative of its future performance.
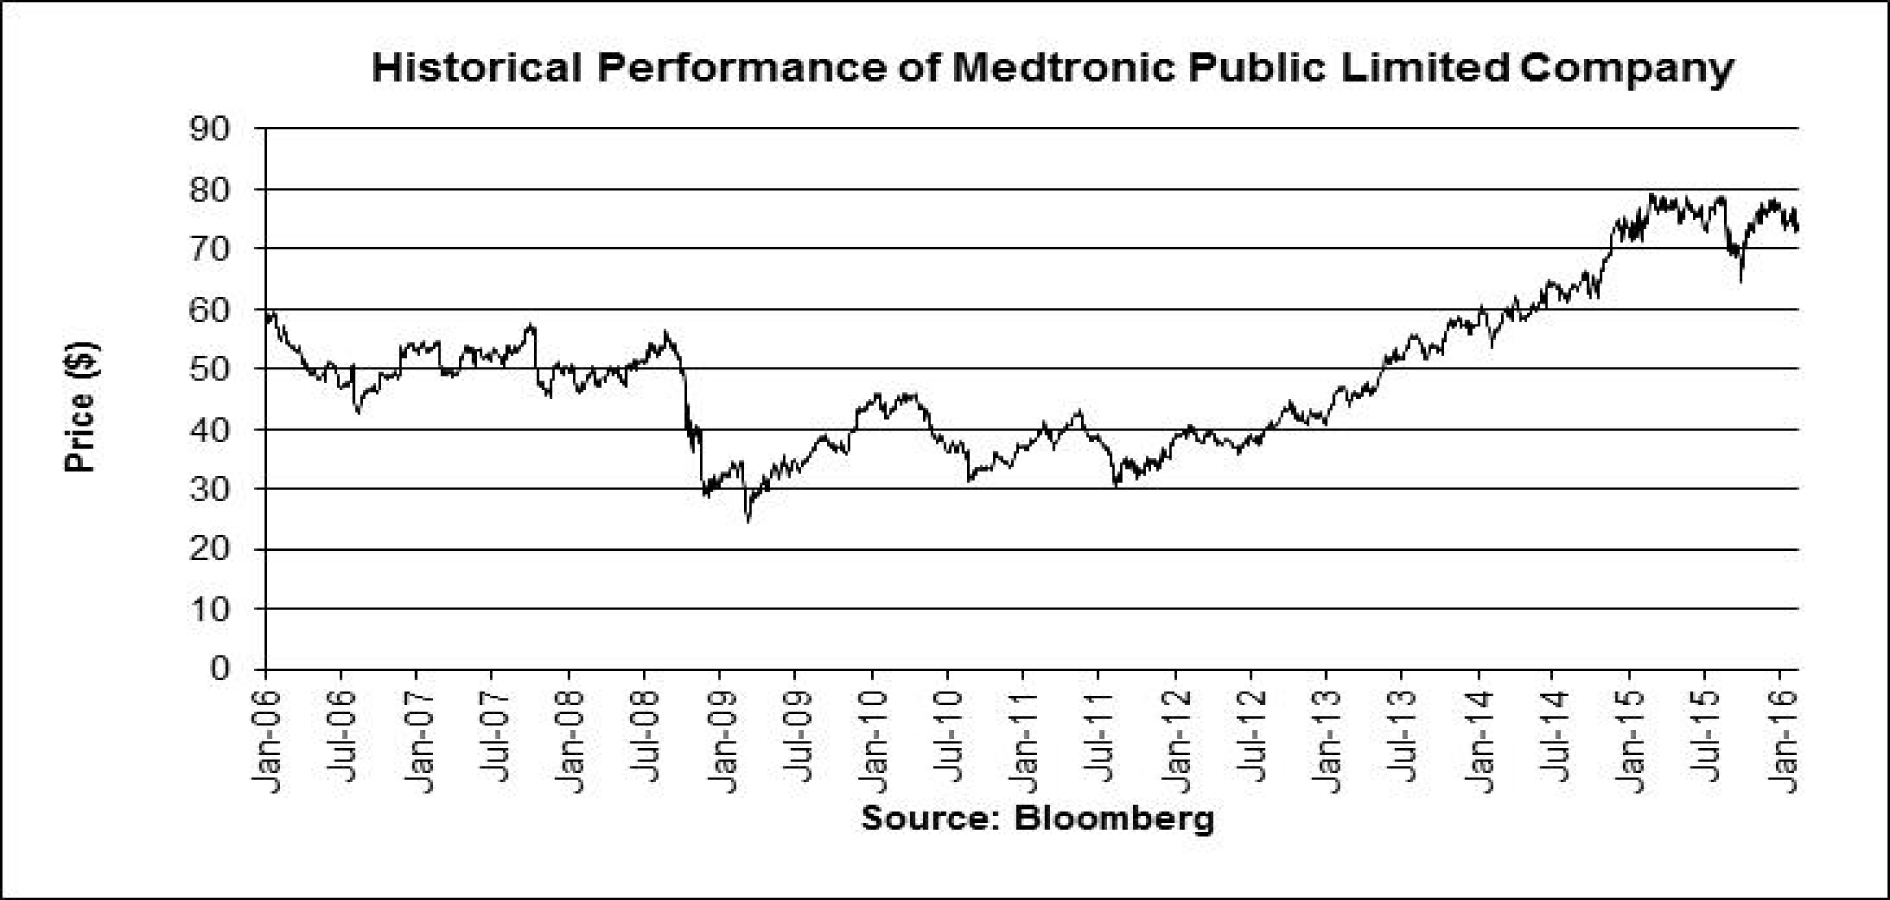
The historical performance of the Underlying Stock should not be taken as an indication of future performance, and no assurance can be given as to the closing price of one share of the Underlying Stock on the Trade Date or the Final Valuation Date. We cannot give you assurance that the performance of the Underlying Stock will result in the return of more than 10% of your principal amount, subject to the credit Risk of JPMorgan Chase & Co.
29
Netflix, Inc.
According to its publicly available filings with the SEC, Netflix, Inc., which we refer to as Netflix, is an Internet television network. The common stock of Netflix, par value $0.001 per share (Bloomberg ticker: NFLX), is listed on The NASDAQ Stock Market, which we refer to as the relevant exchange for purposes of Netflix in the accompanying product supplement no. UBS-1a-I. Netflix's SEC file number is 001-35727.
Historical Information Regarding the Common Stock of Netflix
The following table sets forth the quarterly high and low closing prices of one share of the common stock of Netflix, based on daily closing prices on the primary exchange for Netflix, as reported by Bloomberg. The closing price of one share of the common stock of Netflix on February 10, 2016 was $88.45. The actual Initial Price will be the closing price of one share of the common stock of Netflix on the Trade Date. We obtained the closing prices and other information below from Bloomberg, without independent verification. The closing prices and this other information may have been adjusted by Bloomberg for corporate actions such as stock splits, public offerings, mergers and acquisitions, spin-offs, delistings and bankruptcy.
Since its inception, the price of one share of the common stock of Netflix has experienced significant fluctuations. The historical performance of the common stock of Netflix should not be taken as an indication of future performance, and no assurance can be given as to the closing prices of one share of the common stock of Netflix during the term of the Securities.
| Quarter Begin | Quarter End | Quarterly Closing High | Quarterly Closing Low | Close | ||||||||||
| 1/1/2011 | 3/31/2011 | $35.36 | $25.41 | $33.90 | ||||||||||
| 4/1/2011 | 6/30/2011 | $39.10 | $32.59 | $37.53 | ||||||||||
| 7/1/2011 | 9/30/2011 | $42.68 | $16.17 | $16.17 | ||||||||||
| 10/1/2011 | 12/31/2011 | $17.61 | $9.12 | $9.90 | ||||||||||
| 1/1/2012 | 3/31/2012 | $18.46 | $10.32 | $16.43 | ||||||||||
| 4/1/2012 | 6/30/2012 | $16.28 | $8.95 | $9.78 | ||||||||||
| 7/1/2012 | 9/30/2012 | $12.14 | $7.68 | $7.78 | ||||||||||
| 10/1/2012 | 12/31/2012 | $13.67 | $8.01 | $13.25 | ||||||||||
| 1/1/2013 | 3/31/2013 | $28.06 | $13.14 | $27.06 | ||||||||||
| 4/1/2013 | 6/30/2013 | $34.77 | $23.29 | $30.16 | ||||||||||
| 7/1/2013 | 9/30/2013 | $44.86 | $31.56 | $44.17 | ||||||||||
| 10/1/2013 | 12/31/2013 | $54.37 | $41.20 | $52.60 | ||||||||||
| 1/1/2014 | 3/31/2014 | $65.00 | $46.96 | $50.29 | ||||||||||
| 4/1/2014 | 6/30/2014 | $64.10 | $44.89 | $62.94 | ||||||||||
| 7/1/2014 | 9/30/2014 | $69.20 | $60.27 | $64.45 | ||||||||||
| 10/1/2014 | 12/31/2014 | $66.69 | $45.21 | $48.80 | ||||||||||
| 1/1/2015 | 3/31/2015 | $69.00 | $45.55 | $59.53 | ||||||||||
| 4/1/2015 | 6/30/2015 | $97.31 | $59.02 | $93.85 | ||||||||||
| 7/1/2015 | 9/30/2015 | $126.45 | $93.51 | $103.26 | ||||||||||
| 10/1/2015 | 12/31/2015 | $130.93 | $97.32 | $114.38 | ||||||||||
| 1/1/2016 | 2/10/2016 | * | $117.68 | $82.79 | $88.45 |
| * | As of the date of this pricing supplement, available information for the first calendar quarter of 2016 includes data for the period from January 1, 2016 through February 10, 2016. Accordingly, the "Quarterly Closing High," "Quarterly Closing Low" and "Close" data indicated are for this shortened period only and do not reflect complete data for the first calendar quarter of 2016. |
30
The graph below illustrates the daily performance of the common stock of Netflix from January 3, 2006 through February 10, 2016, based on information from Bloomberg, without independent verification.
Past performance of the common stock of Netflix is not indicative of its future performance.
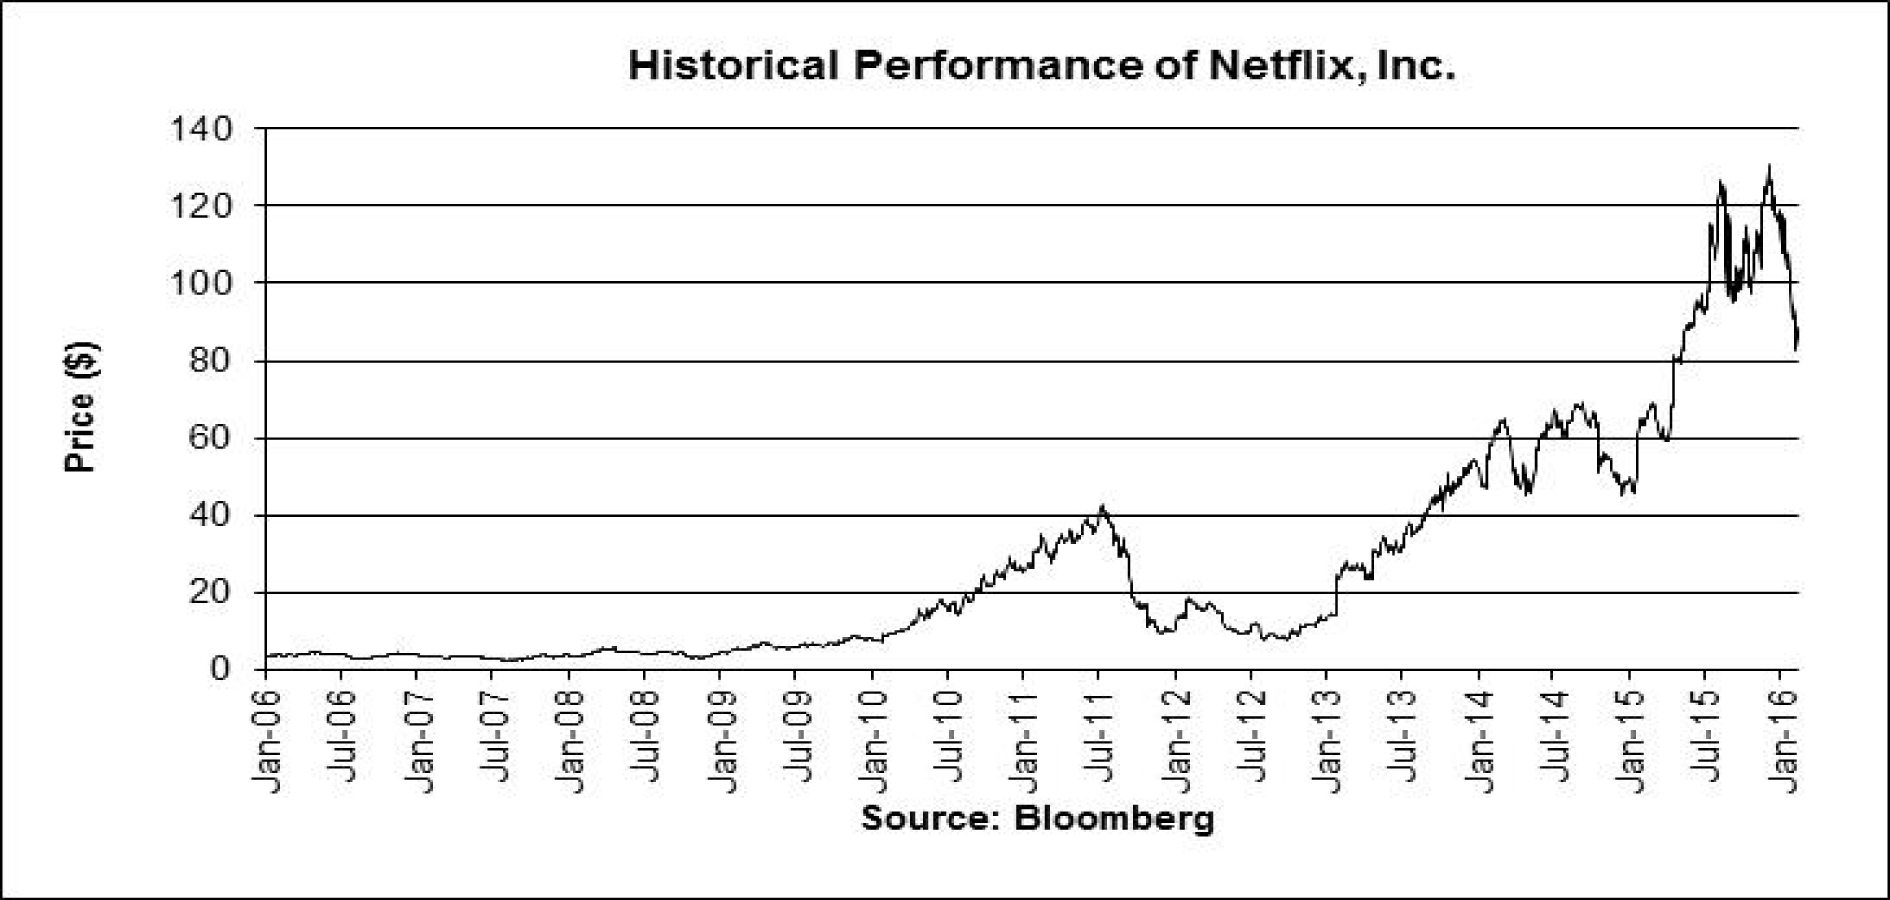
The historical performance of the Underlying Stock should not be taken as an indication of future performance, and no assurance can be given as to the closing price of one share of the Underlying Stock on the Trade Date or the Final Valuation Date. We cannot give you assurance that the performance of the Underlying Stock will result in the return of more than 10% of your principal amount, subject to the credit Risk of JPMorgan Chase & Co.
31
Starbucks Corporation
According to its publicly available filings with the SEC, Starbucks Corporation., which we refer to as Starbucks, is a roaster, marketer and retailer of specialty coffee. The common stock of Starbucks, par value $0.001 per share (Bloomberg ticker: SBUX), is listed on The NASDAQ Stock Market, which we refer to as the relevant exchange for purposes of Starbucks in the accompanying product supplement no. UBS-1a-I. Starbucks's SEC file number is 000-20322.
Historical Information Regarding the Common Stock of Starbucks
The following table sets forth the quarterly high and low closing prices of one share of the common stock of Starbucks, based on daily closing prices on the primary exchange for Starbucks, as reported by Bloomberg. The closing price of one share of the common stock of Starbucks on February 10, 2016 was $55.14. The actual Initial Price will be the closing price of one share of the common stock of Starbucks on the Trade Date. We obtained the closing prices and other information below from Bloomberg, without independent verification. The closing prices and this other information may have been adjusted by Bloomberg for corporate actions such as stock splits, public offerings, mergers and acquisitions, spin-offs, delistings and bankruptcy.
Since its inception, the price of one share of the common stock of Starbucks has experienced significant fluctuations. The historical performance of the common stock of Starbucks should not be taken as an indication of future performance, and no assurance can be given as to the closing prices of one share of the common stock of Starbucks during the term of the Securities.
| Quarter Begin | Quarter End | Quarterly Closing High | Quarterly Closing Low | Close | ||||||||||
| 1/1/2011 | 3/31/2011 | $18.99 | $15.77 | $18.48 | ||||||||||
| 4/1/2011 | 6/30/2011 | $19.75 | $17.43 | $19.75 | ||||||||||
| 7/1/2011 | 9/30/2011 | $20.58 | $17.03 | $18.65 | ||||||||||
| 10/1/2011 | 12/31/2011 | $23.23 | $18.10 | $23.01 | ||||||||||
| 1/1/2012 | 3/31/2012 | $28.13 | $22.67 | $27.95 | ||||||||||
| 4/1/2012 | 6/30/2012 | $30.84 | $25.64 | $26.66 | ||||||||||
| 7/1/2012 | 9/30/2012 | $27.10 | $21.58 | $25.38 | ||||||||||
| 10/1/2012 | 12/31/2012 | $27.29 | $22.49 | $26.81 | ||||||||||
| 1/1/2013 | 3/31/2013 | $29.34 | $26.61 | $28.48 | ||||||||||
| 4/1/2013 | 6/30/2013 | $33.55 | $28.44 | $32.75 | ||||||||||
| 7/1/2013 | 9/30/2013 | $38.67 | $33.12 | $38.49 | ||||||||||
| 10/1/2013 | 12/31/2013 | $41.00 | $37.64 | $39.20 | ||||||||||
| 1/1/2014 | 3/31/2014 | $39.02 | $34.49 | $36.69 | ||||||||||
| 4/1/2014 | 6/30/2014 | $39.06 | $34.36 | $38.69 | ||||||||||
| 7/1/2014 | 9/30/2014 | $40.23 | $36.98 | $37.73 | ||||||||||
| 10/1/2014 | 12/31/2014 | $41.90 | $36.10 | $41.03 | ||||||||||
| 1/1/2015 | 3/31/2015 | $48.96 | $39.62 | $47.35 | ||||||||||
| 4/1/2015 | 6/30/2015 | $54.62 | $46.51 | $53.62 | ||||||||||
| 7/1/2015 | 9/30/2015 | $59.01 | $50.34 | $56.84 | ||||||||||
| 10/1/2015 | 12/31/2015 | $63.51 | $57.48 | $60.03 | ||||||||||
| 1/1/2016 | 2/10/2016 | * | $61.40 | $54.14 | $55.14 |
| * | As of the date of this pricing supplement, available information for the first calendar quarter of 2016 includes data for the period from January 1, 2016 through February 10, 2016. Accordingly, the "Quarterly Closing High," "Quarterly Closing Low" and "Close" data indicated are for this shortened period only and do not reflect complete data for the first calendar quarter of 2016. |
32
The graph below illustrates the daily performance of the common stock of Starbucks from January 3, 2006 through February 10, 2016, based on information from Bloomberg, without independent verification.
Past performance of the common stock of Starbucks is not indicative of its future performance.

The historical performance of the Underlying Stock should not be taken as an indication of future performance, and no assurance can be given as to the closing price of one share of the Underlying Stock on the Trade Date or the Final Valuation Date. We cannot give you assurance that the performance of the Underlying Stock will result in the return of more than 10% of your principal amount, subject to the credit Risk of JPMorgan Chase & Co.
33
Supplemental Plan of Distribution
All sales of the Securities will be made to certain fee-based advisory accounts for which UBS is an investment advisor at a purchase price of $10.00 per $10.00 principal amount Security. UBS, acting as placement agent for such advisory accounts, will purchase the Securities from a dealer that is not affiliated with UBS or JPMS, and that dealer will purchase the Securities from JPMS. JPMS will pay all of the selling commissions it receives from us to that dealer. In no event will these selling commissions exceed $0.05 per $10.00 principal amount Security. UBS will forgo any commissions related to these sales. Investors who purchase and hold the Securities in fee-based advisory accounts will pay advisory fees to UBS based on the amount of assets held in those accounts, including the Securities.
Subject to regulatory constraints, JPMS intends to offer to purchase the Securities in the secondary market, but it is not required to do so.
We or our affiliates may enter into swap agreements or related hedge transactions with one of our other affiliates or unaffiliated counterparties in connection with the sale of the Securities, and JPMS and/or an affiliate may earn additional income as a result of payments pursuant to the swap or related hedge transactions. See "Supplemental Use of Proceeds" in this pricing supplement and "Use of Proceeds and Hedging" beginning on page PS-43 of the accompanying product supplement no. UBS-1a-I.
JPMS's Estimated Value of the Securities
JPMS's estimated value of the Securities set forth on the cover of this pricing supplement is equal to the sum of the values of the following hypothetical components: (1) a fixed-income debt component with the same maturity as the Securities, valued using our internal funding rate for structured debt described below, and (2) the derivative or derivatives underlying the economic terms of the Securities. JPMS's estimated value does not represent a minimum price at which JPMS would be willing to buy your Securities in any secondary market (if any exists) at any time. The internal funding rate used in the determination of JPMS's estimated value generally represents a discount from the credit spreads for our conventional fixed-rate debt. For additional information, see "Key Risks — Risks Relating to the Securities Generally — JPMS's Estimated Value Is Not Determined by Reference to Credit Spreads for Our Conventional Fixed-Rate Debt." The value of the derivative or derivatives underlying the economic terms of the Securities is derived from JPMS's internal pricing models. These models are dependent on inputs such as the traded market prices of comparable derivative instruments and on various other inputs, some of which are market-observable, and which can include volatility, dividend rates, interest rates and other factors, as well as assumptions about future market events and/or environments. Accordingly, JPMS's estimated value of the Securities is determined when the terms of the Securities are set based on market conditions and other relevant factors and assumptions existing at that time. See "Key Risks — Risks Relating to the Securities Generally — JPMS's Estimated Value Does Not Represent Future Values of the Securities and May Differ from Others' Estimates."
JPMS's estimated value of the Securities will be lower than the original issue price of the Securities because costs associated with selling, structuring and hedging the Securities are included in the original issue price of the Securities. These costs include the selling commissions paid to an unaffiliated dealer, the projected profits, if any, that our affiliates expect to realize for assuming risks inherent in hedging our obligations under the Securities and the estimated cost of hedging our obligations under the Securities. Because hedging our obligations entails risk and may be influenced by market forces beyond our control, this hedging may result in a profit that is more or less than expected, or it may result in a loss. We or one or more of our affiliates will retain any profits realized in hedging our obligations under the Securities. See "Key Risks — Risks Relating to the Securities Generally — JPMS's Estimated Value of the Securities Will Be Lower Than the Original Issue Price (Price to Public) of the Securities" in this pricing supplement.
Secondary Market Prices of the Securities
For information about factors that will impact any secondary market prices of the Securities, see "Key Risks — Risks Relating to the Securities Generally — Secondary Market Prices of the Securities Will Be Impacted by Many Economic and Market Factors" in this pricing supplement. In addition, we generally expect that some of the costs included in the original issue price of the Securities will be partially paid back to you in connection with any repurchases of your Securities by JPMS in an amount that will decline to zero over an initial predetermined period that is intended to be up to two months. The length of any such initial period reflects secondary market volumes for the Securities, the structure of the Securities, whether our affiliates expect to earn a profit in connection with our hedging activities, the estimated costs of hedging the Securities and when these costs are incurred, as determined by JPMS. See "Key Risks — Risks Relating to the Securities Generally — The Value of the Securities as Published by JPMS (and Which May Be Reflected on Customer Account Statements) May Be Higher Than JPMS's Then-Current Estimated Value of the Securities for a Limited Time Period."
Supplemental Use of Proceeds
The Securities are offered to meet investor demand for products that reflect the risk-return profile and market exposure provided by the Securities. See "Hypothetical Examples and Return Table" and "Hypothetical Examples of Calculations of the Closing Levels of the Basket" in this pricing supplement for an illustration of the risk-return profile of the Securities and "The Basket" and "The Underlying Stocks" in this pricing supplement for a description of the market exposure provided by the Securities.
The original issue price of the Securities is equal to JPMS's estimated value of the Securities plus the selling commissions paid to an unaffiliated dealer, plus (minus) the projected profits (losses) that our affiliates expect to realize for assuming risks inherent in hedging our obligations under the Securities, plus the estimated cost of hedging our obligations under the Securities.
34
1 Year JP Morgan Chase Chart |
1 Month JP Morgan Chase Chart |

It looks like you are not logged in. Click the button below to log in and keep track of your recent history.
Support: +44 (0) 203 8794 460 | support@advfn.com
By accessing the services available at ADVFN you are agreeing to be bound by ADVFN's Terms & Conditions
 Hot Features