
We could not find any results for:
Make sure your spelling is correct or try broadening your search.
| Share Name | Share Symbol | Market | Type |
|---|---|---|---|
| General Dynamics Corporation | NYSE:GD | NYSE | Common Stock |
| Price Change | % Change | Share Price | High Price | Low Price | Open Price | Shares Traded | Last Trade | |
|---|---|---|---|---|---|---|---|---|
| -9.46 | -3.21% | 285.00 | 12,528 | 14:03:45 |
Wednesday 24 July 2024
RESTON, Va., July 24, 2024 /PRNewswire/ -- General Dynamics (NYSE: GD) today reported second-quarter 2024 revenue of $12 billion, up 18% from the second quarter of 2023. Operating earnings of $1.2 billion were up 20.2% from the year-ago quarter. Diluted earnings per share (EPS) were $3.26, up 20.7% from the year-ago quarter. Operating margin for the quarter was 9.7%, a 20-basis point expansion from the year-ago quarter, with particular strength in the Technologies and Combat Systems segments.
"This was a strong quarter overall, as reflected by solid growth in all key measures from a year ago. Our businesses continue to focus on disciplined execution of their programs, cost and schedule," said Phebe N. Novakovic, chairman and chief executive officer. "In the Aerospace segment, we are continuing to ramp up the pace of our G700 deliveries and our defense businesses continued to grow, reflecting increased demand in response to the threat environment."
Gulfstream delivered 37 aircraft in the quarter, 31 of which were large-cabin aircraft. This compares with 24 aircraft delivered in the year-ago quarter, of which 18 were large-cabin.
Cash and Capital Deployment
Net cash provided by operating activities in the quarter was $814 million, or 90% of net earnings. During the quarter, the company paid $389 million in dividends, invested $201 million in capital expenditures, and used $34 million to repurchase shares, ending the quarter with $1.4 billion in cash and equivalents on hand.
Orders and Backlog
The consolidated book-to-bill ratio, defined as orders divided by revenue, was 0.8-to-1 for the quarter. Company-wide backlog was $91.3 billion. Estimated potential contract value, representing management's estimate of additional value in unfunded indefinite delivery, indefinite quantity (IDIQ) contracts and unexercised options, was $38.5 billion. Total estimated contract value, the sum of all backlog components, was $129.8 billion.
In the Aerospace segment, orders in the quarter totaled $2.7 billion. Aerospace backlog of $20 billion is 2.8% above the year-ago quarter.
In the defense segments, orders in the quarter totaled $7.4 billion, with particular strength in Combat Systems, which had a book-to-bill ratio of 1.5-to-1. Significant awards in the defense segments included two contracts from the Canadian government, with options having combined maximum potential value of $1.9 billion shared with an industry partner, for the Logistics Vehicle Modernization (LVM) program; $205 million, with options having a maximum potential value of $1.1 billion, for planning yard services for the Arleigh Burke-class (DDG-51) guided-missile destroyer program; a $25 million contract from the U.S. Army, with maximum potential value of $535 million, for systems technical support of the Stryker vehicle fleet; $205 million, with options having a maximum potential value of $525 million, from the North Carolina Department of Health and Human Services to operate its Medicaid Management Information System; various munitions and ordnance contracts with maximum potential value totaling $460 million if all options are exercised; and several key contracts for classified customers with maximum potential value of $665 million. A detailed list of significant awards is provided in Exhibit I.
About General Dynamics
Headquartered in Reston, Virginia, General Dynamics is a global aerospace and defense company that offers a broad portfolio of products and services in business aviation; ship construction and repair; land combat vehicles, weapons systems and munitions; and technology products and services. General Dynamics employs more than 100,000 people worldwide and generated $42.3 billion in revenue in 2023. More information is available at www.gd.com.
WEBCAST INFORMATION: General Dynamics will webcast its second-quarter 2024 financial results conference call at 9 a.m. EDT on Wednesday, July 24, 2024. The webcast will be a listen-only audio event available at www.gd.com. An on-demand replay of the webcast will be available by telephone two hours after the end of the call through July 31, 2024, at 800-770-2030 (international: +1 609-800-9909), conference ID 4299949. Charts furnished to investors and securities analysts in connection with General Dynamics' announcement of its financial results are available at www.gd.com.
This press release contains forward-looking statements (FLS), including statements about the company's future operational and financial performance, which are based on management's expectations, estimates, projections and assumptions. Words such as "expects," "anticipates," "plans," "believes," "forecasts," "scheduled," "outlook," "estimates," "should" and variations of these words and similar expressions are intended to identify FLS. In making FLS, we rely on assumptions and analyses based on our experience and perception of historical trends; current conditions and expected future developments; and other factors, estimates and judgments we consider reasonable and appropriate based on information available to us at the time. FLS are made pursuant to the safe harbor provisions of the Private Securities Litigation Reform Act of 1995, as amended. FLS are not guarantees of future performance and involve factors, risks and uncertainties that are difficult to predict. Actual future results and trends may differ materially from what is forecast in the FLS. All FLS speak only as of the date they were made. We do not undertake any obligation to update or publicly release revisions to FLS to reflect events, circumstances or changes in expectations after the date of this press release. Additional information regarding these factors is contained in the company's filings with the SEC, and these factors may be revised or supplemented in future SEC filings. In addition, this press release contains some financial measures not prepared in accordance with U.S. generally accepted accounting principles (GAAP). While we believe these non-GAAP metrics provide useful information for investors, there are limitations associated with their use, and our calculations of these metrics may not be comparable to similarly titled measures of other companies. Non-GAAP metrics should not be considered in isolation from, or as a substitute for, GAAP measures. Reconciliations to comparable GAAP measures and other information relating to our non-GAAP measures are included in other filings with the SEC, which are available at investorrelations.gd.com.
EXHIBIT A | |||||||||
CONSOLIDATED STATEMENT OF EARNINGS - (UNAUDITED) | |||||||||
DOLLARS IN MILLIONS, EXCEPT PER SHARE AMOUNTS | |||||||||
Three Months Ended | Variance | ||||||||
June 30, 2024 | July 2, 2023 | $ | % | ||||||
Revenue | $ 11,976 | $ 10,152 | $ 1,824 | 18.0 % | |||||
Operating costs and expenses | (10,820) | (9,190) | (1,630) | ||||||
Operating earnings | 1,156 | 962 | 194 | 20.2 % | |||||
Other, net | 18 | 13 | 5 | ||||||
Interest, net | (84) | (89) | 5 | ||||||
Earnings before income tax | 1,090 | 886 | 204 | 23.0 % | |||||
Provision for income tax, net | (185) | (142) | (43) | ||||||
Net earnings | $ 905 | $ 744 | $ 161 | 21.6 % | |||||
Earnings per share—basic | $ 3.30 | $ 2.72 | $ 0.58 | 21.3 % | |||||
Basic weighted average shares outstanding | 274.1 | 273.1 | |||||||
Earnings per share—diluted | $ 3.26 | $ 2.70 | $ 0.56 | 20.7 % | |||||
Diluted weighted average shares outstanding | 277.7 | 275.1 | |||||||
EXHIBIT B | |||||||||
CONSOLIDATED STATEMENT OF EARNINGS - (UNAUDITED) | |||||||||
DOLLARS IN MILLIONS, EXCEPT PER SHARE AMOUNTS | |||||||||
Six Months Ended | Variance | ||||||||
June 30, 2024 | July 2, 2023 | $ | % | ||||||
Revenue | $ 22,707 | $ 20,033 | $ 2,674 | 13.3 % | |||||
Operating costs and expenses | (20,515) | (18,133) | (2,382) | ||||||
Operating earnings | 2,192 | 1,900 | 292 | 15.4 % | |||||
Other, net | 32 | 46 | (14) | ||||||
Interest, net | (166) | (180) | 14 | ||||||
Earnings before income tax | 2,058 | 1,766 | 292 | 16.5 % | |||||
Provision for income tax, net | (354) | (292) | (62) | ||||||
Net earnings | $ 1,704 | $ 1,474 | $ 230 | 15.6 % | |||||
Earnings per share—basic | $ 6.22 | $ 5.39 | $ 0.83 | 15.4 % | |||||
Basic weighted average shares outstanding | 273.8 | 273.6 | |||||||
Earnings per share—diluted | $ 6.14 | $ 5.34 | $ 0.80 | 15.0 % | |||||
Diluted weighted average shares outstanding | 277.4 | 275.8 | |||||||
EXHIBIT C | |||||||||
REVENUE AND OPERATING EARNINGS BY SEGMENT - (UNAUDITED) | |||||||||
DOLLARS IN MILLIONS | |||||||||
Three Months Ended | Variance | ||||||||
June 30, 2024 | July 2, 2023 | $ | % | ||||||
Revenue: | |||||||||
Aerospace | $ 2,940 | $ 1,953 | $ 987 | 50.5 % | |||||
Marine Systems | 3,453 | 3,059 | 394 | 12.9 % | |||||
Combat Systems | 2,288 | 1,924 | 364 | 18.9 % | |||||
Technologies | 3,295 | 3,216 | 79 | 2.5 % | |||||
Total | $ 11,976 | $ 10,152 | $ 1,824 | 18.0 % | |||||
Operating earnings: | |||||||||
Aerospace | $ 319 | $ 236 | $ 83 | 35.2 % | |||||
Marine Systems | 245 | 235 | 10 | 4.3 % | |||||
Combat Systems | 313 | 251 | 62 | 24.7 % | |||||
Technologies | 320 | 283 | 37 | 13.1 % | |||||
Corporate | (41) | (43) | 2 | 4.7 % | |||||
Total | $ 1,156 | $ 962 | $ 194 | 20.2 % | |||||
Operating margin: | |||||||||
Aerospace | 10.9 % | 12.1 % | |||||||
Marine Systems | 7.1 % | 7.7 % | |||||||
Combat Systems | 13.7 % | 13.0 % | |||||||
Technologies | 9.7 % | 8.8 % | |||||||
Total | 9.7 % | 9.5 % | |||||||
EXHIBIT D | |||||||||
REVENUE AND OPERATING EARNINGS BY SEGMENT - (UNAUDITED) | |||||||||
DOLLARS IN MILLIONS | |||||||||
Six Months Ended | Variance | ||||||||
June 30, 2024 | July 2, 2023 | $ | % | ||||||
Revenue: | |||||||||
Aerospace | $ 5,024 | $ 3,845 | $ 1,179 | 30.7 % | |||||
Marine Systems | 6,784 | 6,051 | 733 | 12.1 % | |||||
Combat Systems | 4,390 | 3,680 | 710 | 19.3 % | |||||
Technologies | 6,509 | 6,457 | 52 | 0.8 % | |||||
Total | $ 22,707 | $ 20,033 | $ 2,674 | 13.3 % | |||||
Operating earnings: | |||||||||
Aerospace | $ 574 | $ 465 | $ 109 | 23.4 % | |||||
Marine Systems | 477 | 446 | 31 | 7.0 % | |||||
Combat Systems | 595 | 496 | 99 | 20.0 % | |||||
Technologies | 615 | 582 | 33 | 5.7 % | |||||
Corporate | (69) | (89) | 20 | 22.5 % | |||||
Total | $ 2,192 | $ 1,900 | $ 292 | 15.4 % | |||||
Operating margin: | |||||||||
Aerospace | 11.4 % | 12.1 % | |||||||
Marine Systems | 7.0 % | 7.4 % | |||||||
Combat Systems | 13.6 % | 13.5 % | |||||||
Technologies | 9.4 % | 9.0 % | |||||||
Total | 9.7 % | 9.5 % | |||||||
EXHIBIT E | ||||||||
CONSOLIDATED BALANCE SHEET | ||||||||
DOLLARS IN MILLIONS | ||||||||
(Unaudited) | ||||||||
June 30, 2024 | December 31, 2023 | |||||||
ASSETS | ||||||||
Current assets: | ||||||||
Cash and equivalents | $ 1,362 | $ 1,913 | ||||||
Accounts receivable | 3,152 | 3,004 | ||||||
Unbilled receivables | 8,568 | 7,997 | ||||||
Inventories | 9,686 | 8,578 | ||||||
Other current assets | 1,544 | 2,123 | ||||||
Total current assets | 24,312 | 23,615 | ||||||
Noncurrent assets: | ||||||||
Property, plant and equipment, net | 6,276 | 6,198 | ||||||
Intangible assets, net | 1,550 | 1,656 | ||||||
Goodwill | 20,452 | 20,586 | ||||||
Other assets | 2,852 | 2,755 | ||||||
Total noncurrent assets | 31,130 | 31,195 | ||||||
Total assets | $ 55,442 | $ 54,810 | ||||||
LIABILITIES AND SHAREHOLDERS' EQUITY | ||||||||
Current liabilities: | ||||||||
Short-term debt and current portion of long-term debt | $ 2,004 | $ 507 | ||||||
Accounts payable | 2,969 | 3,095 | ||||||
Customer advances and deposits | 10,089 | 9,564 | ||||||
Other current liabilities | 3,195 | 3,266 | ||||||
Total current liabilities | 18,257 | 16,432 | ||||||
Noncurrent liabilities: | ||||||||
Long-term debt | 7,257 | 8,754 | ||||||
Other liabilities | 7,892 | 8,325 | ||||||
Total noncurrent liabilities | 15,149 | 17,079 | ||||||
Shareholders' equity: | ||||||||
Common stock | 482 | 482 | ||||||
Surplus | 3,925 | 3,760 | ||||||
Retained earnings | 40,191 | 39,270 | ||||||
Treasury stock | (21,128) | (21,054) | ||||||
Accumulated other comprehensive loss | (1,434) | (1,159) | ||||||
Total shareholders' equity | 22,036 | 21,299 | ||||||
Total liabilities and shareholders' equity | $ 55,442 | $ 54,810 | ||||||
EXHIBIT F | |||
CONSOLIDATED STATEMENT OF CASH FLOWS - (UNAUDITED) | |||
DOLLARS IN MILLIONS | |||
Six Months Ended | |||
June 30, 2024 | July 2, 2023 | ||
Cash flows from operating activities—continuing operations: | |||
Net earnings | $ 1,704 | $ 1,474 | |
Adjustments to reconcile net earnings to net cash from operating activities: | |||
Depreciation of property, plant and equipment | 311 | 297 | |
Amortization of intangible and finance lease right-of-use assets | 117 | 136 | |
Equity-based compensation expense | 87 | 87 | |
Deferred income tax benefit | (90) | (154) | |
(Increase) decrease in assets, net of effects of business acquisitions: | |||
Accounts receivable | (158) | (159) | |
Unbilled receivables | (601) | 513 | |
Inventories | (1,152) | (1,264) | |
Increase (decrease) in liabilities, net of effects of business acquisitions: | |||
Accounts payable | (125) | (33) | |
Customer advances and deposits | 169 | 1,286 | |
Other, net | 274 | 10 | |
Net cash provided by operating activities | 536 | 2,193 | |
Cash flows from investing activities: | |||
Capital expenditures | (360) | (373) | |
Other, net | 53 | (31) | |
Net cash used by investing activities | (307) | (404) | |
Cash flows from financing activities: | |||
Dividends paid | (750) | (705) | |
Purchases of common stock | (139) | (378) | |
Repayment of fixed-rate notes | – | (750) | |
Other, net | 111 | (42) | |
Net cash used by financing activities | (778) | (1,875) | |
Net cash used by discontinued operations | (2) | (2) | |
Net decrease in cash and equivalents | (551) | (88) | |
Cash and equivalents at beginning of period | 1,913 | 1,242 | |
Cash and equivalents at end of period | $ 1,362 | $ 1,154 | |
EXHIBIT G | |||||||||
ADDITIONAL FINANCIAL INFORMATION - (UNAUDITED) | |||||||||
DOLLARS IN MILLIONS, EXCEPT PER SHARE AMOUNTS | |||||||||
Other Financial Information: | |||||||||
June 30, 2024 | December 31, 2023 | ||||||||
Debt-to-equity (a) | 42.0 % | 43.5 % | |||||||
Book value per share (b) | $ 80.20 | $ 77.85 | |||||||
Shares outstanding | 274,777,579 | 273,599,948 | |||||||
Second Quarter | Six Months | ||||||||
2024 | 2023 | 2024 | 2023 | ||||||
Income tax refunds (payments), net | $ 81 | $ (269) | $ 48 | $ (327) | |||||
Company-sponsored research and development (c) | $ 147 | $ 145 | $ 284 | $ 255 | |||||
Return on sales (d) | 7.6 % | 7.3 % | 7.5 % | 7.4 % | |||||
Non-GAAP Financial Measures: | |||||||||
Second Quarter | Six Months | ||||||||
2024 | 2023 | 2024 | 2023 | ||||||
Free cash flow: | |||||||||
Net cash provided by operating activities | $ 814 | $ 731 | $ 536 | $ 2,193 | |||||
Capital expenditures | (201) | (212) | (360) | (373) | |||||
Free cash flow (e) | $ 613 | $ 519 | $ 176 | $ 1,820 | |||||
June 30, 2024 | December 31, 2023 | ||||||||
Net debt: | |||||||||
Total debt | $ 9,261 | $ 9,261 | |||||||
Less cash and equivalents | 1,362 | 1,913 | |||||||
Net debt (f) | $ 7,899 | $ 7,348 | |||||||
(a) Debt-to-equity ratio is calculated as total debt divided by total equity as of the end of the period. portrays our ability to generate cash from our businesses for purposes such as repaying debt, funding business acquisitions, repurchasing our common stock and paying dividends. We use free cash flow to assess the quality of our earnings and as a key performance measure in evaluating management. the borrowings that support our operations and capital deployment strategy. We use net debt as an important indicator of liquidity and financial position. |
EXHIBIT H | ||||||||||
BACKLOG - (UNAUDITED) | ||||||||||
DOLLARS IN MILLIONS | ||||||||||
Funded | Unfunded | Total | Estimated | Total | ||||||
Second Quarter 2024: | ||||||||||
Aerospace | $ 19,126 | $ 911 | $ 20,037 | $ 372 | $ 20,409 | |||||
Marine Systems | 29,912 | 11,436 | 41,348 | 3,983 | 45,331 | |||||
Combat Systems | 16,003 | 673 | 16,676 | 5,816 | 22,492 | |||||
Technologies | 9,365 | 3,875 | 13,240 | 28,283 | 41,523 | |||||
Total | $ 74,406 | $ 16,895 | $ 91,301 | $ 38,454 | $ 129,755 | |||||
First Quarter 2024: | ||||||||||
Aerospace | $ 19,564 | $ 981 | $ 20,545 | $ 305 | $ 20,850 | |||||
Marine Systems | 29,711 | 14,415 | 44,126 | 3,749 | 47,875 | |||||
Combat Systems | 14,923 | 686 | 15,609 | 7,002 | 22,611 | |||||
Technologies | 8,976 | 4,478 | 13,454 | 29,206 | 42,660 | |||||
Total | $ 73,174 | $ 20,560 | $ 93,734 | $ 40,262 | $ 133,996 | |||||
Second Quarter 2023: | ||||||||||
Aerospace | $ 19,050 | $ 447 | $ 19,497 | $ 888 | $ 20,385 | |||||
Marine Systems | 30,318 | 13,410 | 43,728 | 3,238 | 46,966 | |||||
Combat Systems | 14,349 | 718 | 15,067 | 6,196 | 21,263 | |||||
Technologies | 9,732 | 3,333 | 13,065 | 27,639 | 40,704 | |||||
Total | $ 73,449 | $ 17,908 | $ 91,357 | $ 37,961 | $ 129,318 | |||||
* The estimated potential contract value includes work awarded on unfunded indefinite delivery, indefinite quantity (IDIQ) contracts and unexercised options associated with existing firm contracts, including options and other agreements with existing customers to purchase new aircraft and aircraft services. We recognize options in backlog when the customer exercises the option and establishes a firm order. For IDIQ contracts, we evaluate the amount of funding we expect to receive and include this amount in our estimated potential contract value. The actual amount of funding received in the future may be higher or lower than our estimate of potential contract value. | ||||||||||
EXHIBIT H-1
|
BACKLOG - (UNAUDITED) |
DOLLARS IN MILLIONS |
https://mma.prnewswire.com/media/2467407/H_1.jpg
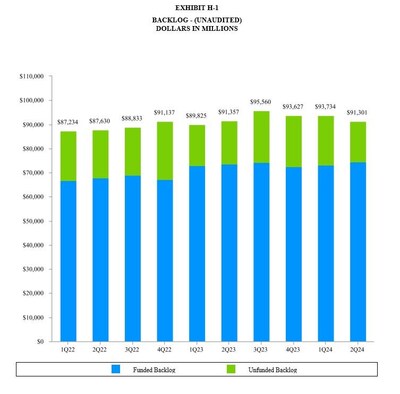
EXHIBIT H-2
|
BACKLOG BY SEGMENT - (UNAUDITED) |
DOLLARS IN MILLIONS |
https://mma.prnewswire.com/media/2467406/H_2.jpg
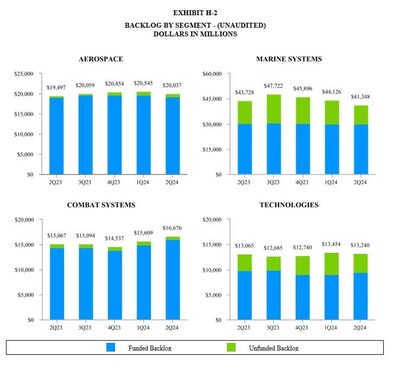
EXHIBIT I
|
SECOND QUARTER 2024 SIGNIFICANT ORDERS - (UNAUDITED) |
DOLLARS IN MILLIONS |
We received the following significant contract awards during the second quarter of 2024:
Marine Systems:
Combat Systems:
Technologies:
EXHIBIT J | ||||||||
AEROSPACE SUPPLEMENTAL DATA - (UNAUDITED) | ||||||||
DOLLARS IN MILLIONS | ||||||||
Second Quarter | Six Months | |||||||
2024 | 2023 | 2024 | 2023 | |||||
Gulfstream Aircraft Deliveries (units): | ||||||||
Large-cabin aircraft | 31 | 18 | 52 | 35 | ||||
Mid-cabin aircraft | 6 | 6 | 9 | 10 | ||||
Total | 37 | 24 | 61 | 45 | ||||
Aerospace Book-to-Bill: | ||||||||
Orders* | $ 2,673 | $ 2,476 | $ 5,099 | $ 4,203 | ||||
Revenue | 2,940 | 1,953 | 5,024 | 3,845 | ||||
Book-to-Bill Ratio | 0.9x | 1.3x | 1.0x | 1.1x | ||||
* Does not include customer defaults, liquidated damages, cancellations, foreign exchange fluctuations and other backlog adjustments. | ||||||||
![]()
![]() View original content to download multimedia:https://www.prnewswire.com/news-releases/general-dynamics-reports-second-quarter-2024-financial-results-302204554.html
View original content to download multimedia:https://www.prnewswire.com/news-releases/general-dynamics-reports-second-quarter-2024-financial-results-302204554.html
SOURCE General Dynamics

Copyright 2024 PR Newswire
1 Year General Dynamics Chart |
1 Month General Dynamics Chart |

It looks like you are not logged in. Click the button below to log in and keep track of your recent history.
Support: +44 (0) 203 8794 460 | support@advfn.com
By accessing the services available at ADVFN you are agreeing to be bound by ADVFN's Terms & Conditions
 Hot Features