We could not find any results for:
Make sure your spelling is correct or try broadening your search.
| Share Name | Share Symbol | Market | Type |
|---|---|---|---|
| First Trust High Income Long Short Fund | NYSE:FSD | NYSE | Common Stock |
| Price Change | % Change | Share Price | High Price | Low Price | Open Price | Shares Traded | Last Trade | |
|---|---|---|---|---|---|---|---|---|
| 0.04 | 0.34% | 11.95 | 11.97 | 11.91 | 11.91 | 109,981 | 01:00:00 |
UNITED STATES
SECURITIES AND EXCHANGE COMMISSION
Washington, D.C. 20549
CERTIFIED SHAREHOLDER REPORT OF REGISTERED MANAGEMENT INVESTMENT COMPANIES
Investment Company Act file number 811-22442
(Exact name of registrant as specified in charter)
120 East Liberty Drive, Suite 400
Wheaton, IL 60187
(Address of principal executive offices) (Zip code)
W. Scott Jardine, Esq.
First Trust Portfolios L.P.
120 East Liberty Drive, Suite 400
Wheaton, IL 60187
(Name and address of agent for service)
Registrant’s telephone number, including area code: 630-765-8000
Date of fiscal year end: October 31
Date of reporting period: April 30, 2023
Form N-CSR is to be used by management investment companies to file reports with the Commission not later than 10 days after the transmission to stockholders of any report that is required to be transmitted to stockholders under Rule 30e-1 under the Investment Company Act of 1940 (17 CFR 270.30e-1). The Commission may use the information provided on Form N-CSR in its regulatory, disclosure review, inspection, and policymaking roles.
A registrant is required to disclose the information specified by Form N-CSR, and the Commission will make this information public. A registrant is not required to respond to the collection of information contained in Form N-CSR unless the Form displays a currently valid Office of Management and Budget (“OMB”) control number. Please direct comments concerning the accuracy of the information collection burden estimate and any suggestions for reducing the burden to Secretary, Securities and Exchange Commission, 100 F Street, NE, Washington, DC 20549. The OMB has reviewed this collection of information under the clearance requirements of 44 U.S.C. § 3507.
Item 1. Reports to Stockholders.
| (a) | The Report to Shareholders is attached herewith. |


| 1 | |
| 2 | |
| 4 | |
| 10 | |
| 23 | |
| 24 | |
| 25 | |
| 26 | |
| 27 | |
| 28 | |
| 36 |

| Performance | |||||
| Average Annual Total Returns | |||||
| 6 Months Ended 4/30/23 | 1 Year Ended 4/30/23 | 5 Years Ended 4/30/23 | 10 Years Ended 4/30/23 | Inception (9/27/10) to 4/30/23 | |
| Fund Performance(3) | |||||
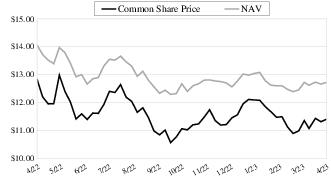
| NAV(4) | 6.38% | 0.86% | 3.20% | 4.18% | 5.39% |
| Market Value | 8.87% | -0.94% | 3.68% | 3.48% | 4.10% |
| Index Performance | |||||
| ICE BofA US High Yield Constrained Index | 5.88% | 1.03% | 3.10% | 3.93% | 5.34% |
| (1) | Most recent distribution paid through April 30, 2023. Subject to change in the future. |
| (2) | Distribution rates are calculated by annualizing the most recent distribution paid through the report date and then dividing by Common Share Price or NAV, as applicable, as of April 30, 2023. Subject to change in the future. |
| (3) | Total return is based on the combination of reinvested dividend, capital gain, and return of capital distributions, if any, at prices obtained by the Dividend Reinvestment Plan and changes in NAV per share for NAV returns and changes in Common Share Price for market value returns. Total returns do not reflect sales load and are not annualized for periods of less than one year. Past performance is not indicative of future results. |
| (4) | On January 3, 2023, the fair value methodology used to value the senior loan investments held by the Fund was changed. Prior to that date, the senior loans were valued using the bid side price provided by a pricing service. After such date, the senior loans were valued using the midpoint between the bid and ask price provided by a pricing service. The change in the Fund’s fair value methodology on January 3, 2023, resulted in a one-time increase in the Fund’s net asset value of approximately $0.005 per share on that date, which represented a positive impact on the Fund’s performance of 0.04%. The change to the pricing methodology was negligible to the performance of the Fund on a NAV basis for the periods ended April 30, 2023. |
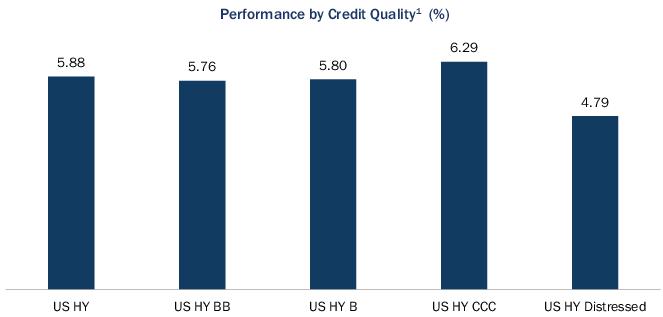
| (5) | The credit quality and ratings information presented above reflect the ratings assigned by one or more nationally recognized statistical rating organizations (NRSROs), including S&P Global Ratings, Moody’s Investors Service, Inc., Fitch Ratings or a comparably rated NRSRO. For situations in which a security is rated by more than one NRSRO and the ratings are not equivalent, the highest rating is used. Sub-investment grade ratings are those rated BB+/Ba1 or lower. Investment grade ratings are those rated BBB-/Baa3 or higher. The credit ratings shown relate to the creditworthiness of the issuers of the underlying securities in the Fund, and not to the Fund or its shares. Credit ratings are subject to change. |
| (6) | Percentages are based on long positions only. Short positions are excluded. |
| (7) | Includes forward foreign currency contracts. |
| • | Following the rate driven volatility that weighed across credit markets for much of 2022, the year closed on a calmer tone. This sentiment carried into 2023, which opened on a vibrant note and a rally in credit markets in January 2023. Optimism around a possible slowdown in central bank tightening programs along with the hopes of a soft landing drove credit markets higher in the first month of 2023 with strong results. Renewed confidence for a turnaround in global growth with China’s reopening and positive signals from Europe, with their recessionary concerns postponed, also motivated investors. Market enthusiasm however quickly faded in February 2023 with the report of stronger than expected inflation data in both the U.S. and Europe along with somewhat hawkish commentary from the U.S. Federal Reserve (the “Fed”) and European Central Bank (“ECB”) officials. Following this, the Fed raised interest rates in February 2023 by 25 basis points (“bps”), the smallest move since their interest rate hike program began in March 2022. The markets reacted positively in the hopes that this signaled a step closer to the end of the Fed’s tightening cycle; as the month progressed, it was evident that this was not the case. |
| • | In March 2023, chaos within the Banking sector took center stage with the failures of U.S. regional banks, Silicon Valley Bank and Signature Bank, igniting concerns around the solvency of banks and their ability to meet liquidity needs of depositors. Contagion worries escalated, revealing weaknesses within First Republic, another U.S. regional bank, and extended globally leading to the near collapse of Credit Suisse. U.S. Government regulators swiftly stepped in by providing support in the form of liquidity facilities to U.S. banks, guarantees for depositors at smaller banking institutions that demonstrate signs of stress and conveyed statements on the soundness of the U.S. banking system; all measures intended to alleviate fears and reinstitute confidence in banks. Similarly, the Swiss government stepped in, committing to liquidity support for Credit Suisse and eventually acting as the lead negotiator for the agreed acquisition of the troubled bank by UBS. In the midst of the distress within the Banking sector, the Fed stayed the course, raising interest rates by another 25 bps to a range of 4.75% to 5.00%. With inflation still elevated, Fed Chairman Jerome Powell reiterated that there is more work needed to get inflation back toward the Fed’s 2% target. |
| • | Credit markets demonstrated vibrancy, with a calmer tone settling in by late March 2023 and persisting in April. While questions remain about other vulnerable banks and contagion within the Banking sector, concerns were somewhat diminished during the month, particularly given the swift response by government officials and regulatory agencies in both the U.S. and in Europe to address the troubled institutions. In April, market participants turned their attention to corporate earnings, which kicked off. While the start to earnings has been mixed, investors were encouraged by upbeat first quarter 2023 results from technology companies, large oil producers and others that beat expectations. First quarter 2023 results for the large banks, including JP Morgan, Citi and Wells Fargo were favorable, boosted by increased deposits from nervous investors who fled smaller banks and also lifted by higher rates on loans. Results for the smaller and mid-sized banks, on the other hand, remain a concern. |
| • | Turning to economic data in the U.S., first quarter 2023 gross domestic product growth came in at 1.1%, demonstrating a meaningful decline in economic growth from 2.6% in the fourth quarter of 2022, adding to the likelihood of recession in the near future. This deceleration was primarily driven by business activity, while consumer activity, fueled by higher incomes and savings, has been slower to ease. Personal consumption rose to 3.7% in the first quarter of 2023, contributing to elevated inflation in the U.S. As of April, the annualized rate of U.S. inflation was 4.9%, down from 6.5% at the end of 2022, as measured by the Consumer |
| Price Index. While U.S. inflation has declined, the Fed appears to remain committed to bringing inflation down to their ultimate target of 2%. According to the U.S. Bureau of Labor Statistics’ monthly jobs report, U.S. employers added over 250,000 jobs in April 2023 and the unemployment rate decreased to 3.4%. A strong labor market in the midst of high inflation is a major concern of the Fed. | |
| • | Outside the U.S., in Europe, the ECB completed two interest rate hikes of 50 bps year-to-date through April 2023, and also messaged their intent to stay the course to meet their 2% medium-term target. Inflation in the Eurozone remains elevated at 6.9% (as of March 2023). Turning to China, the country continues to make steps forward with a strong rebound in the first quarter of 2023. China’s economy expanded by 4.5% in the first quarter and is expected to grow further this year above 5%. Chinese consumers have enjoyed resuming travel, retail spending and increased activity in restaurants. |
| • | Within this market backdrop, Treasury yields moved lower across the curve year to date through April; the yield curve still remains inverted. The yield on the 2-Year U.S. Treasury declined 37 bps to 4.04%, while the yield on the 10-Year fell 44 bps to close April at 3.44%. Within commodities, oil prices, as measured by WTI Crude, declined during the year and closed April 2023 at $76.78. |
| Average Annual Total Returns | |||||
| 6 Months Ended 4/30/23 | 1 Year Ended 4/30/23 | 5 Years Ended 4/30/23 | 10 Years Ended 4/30/23 | Inception (9/27/10) to 4/30/23 | |
| Fund Performance* | |||||
| NAV** | 6.38% | 0.86% | 3.20% | 4.18% | 5.39% |
| Market Value | 8.87% | -0.94% | 3.68% | 3.48% | 4.10% |
| Index Performance | |||||
| ICE BofA US High Yield Constrained Index | 5.88% | 1.03% | 3.10% | 3.93% | 5.34% |

| * | Total return is based on the combination of reinvested dividend, capital gain and return of capital distributions, if any, at prices obtained by the Dividend Reinvestment Plan and changes in NAV per share for NAV returns and changes in Common Share Price for market value returns. Total returns do not reflect sales load and are not annualized for periods of less than one year. Past performance is not indicative of future results.. |
| ** | On January 3, 2023, the fair value methodology used to value the senior loan investments held by the Fund was changed. Prior to that date, the senior loans were valued using the bid side price provided by a pricing service. After such date, the senior loans were valued using the midpoint between the bid and ask price provided by a pricing service. The change in the Fund’s fair value methodology on January 3, 2023, resulted in a one-time increase in the Fund’s net asset value of approximately $0.005 per share on that date, which represented a positive impact on the Fund’s performance of 0.04%.The change to the pricing methodology was negligible to the performance of the Fund on a NAV basis for the periods ended April 30, 2023. |
| Principal Value | Description | Stated Coupon | Stated Maturity | Value | ||||
| CORPORATE BONDS AND NOTES – 100.6% | ||||||||
| Automotive – 4.7% | ||||||||
| $2,300,000 | Dana, Inc. (a) | 4.50% | 02/15/32 | $1,841,500 | ||||
| 1,185,000 | Energizer Holdings, Inc. (b) | 4.38% | 03/31/29 | 1,037,272 | ||||
| 1,100,000 | Ford Motor Credit Co., LLC | 5.58% | 03/18/24 | 1,094,792 | ||||
| 1,400,000 | Ford Motor Credit Co., LLC (a) | 5.13% | 06/16/25 | 1,364,950 | ||||
| 1,260,000 | Ford Motor Credit Co., LLC | 6.95% | 03/06/26 | 1,272,974 | ||||
| 1,000,000 | Ford Motor Credit Co., LLC | 4.95% | 05/28/27 | 946,977 | ||||
| 2,205,000 | Ford Motor Credit Co., LLC (a) | 4.13% | 08/17/27 | 2,025,985 | ||||
| 5,000,000 | Ford Motor Credit Co., LLC (a) | 5.11% | 05/03/29 | 4,666,930 | ||||
| 2,000,000 | Ford Motor Credit Co., LLC | 7.35% | 03/06/30 | 2,056,361 | ||||
| 1,950,000 | Gates Global LLC/Gates Corp. (b) | 6.25% | 01/15/26 | 1,932,957 | ||||
| 710,000 | Goodyear Tire & Rubber (The) Co. | 4.88% | 03/15/27 | 671,699 | ||||
| 1,135,000 | Thor Industries, Inc. (b) | 4.00% | 10/15/29 | 932,116 | ||||
| 19,844,513 | ||||||||
| Banking – 0.2% | ||||||||
| 335,000 | Fifth Third Bancorp (c) | 4.77% | 07/28/30 | 319,079 | ||||
| 500,000 | Fifth Third Bank NA | 3.85% | 03/15/26 | 471,391 | ||||
| 790,470 | ||||||||
| Basic Industry – 6.5% | ||||||||
| 2,045,000 | Artera Services LLC (b) | 9.03% | 12/04/25 | 1,759,201 | ||||
| 435,000 | Avient Corp. (a) (b) | 7.13% | 08/01/30 | 444,984 | ||||
| 645,000 | Brundage-Bone Concrete Pumping Holdings, Inc. (a) (b) | 6.00% | 02/01/26 | 606,968 | ||||
| 1,450,000 | Camelot Return Merger Sub, Inc. (a) (b) | 8.75% | 08/01/28 | 1,375,673 | ||||
| 320,000 | Carpenter Technology Corp. | 6.38% | 07/15/28 | 317,584 | ||||
| 1,276,000 | Carpenter Technology Corp. (a) | 7.63% | 03/15/30 | 1,306,523 | ||||
| 655,000 | Compass Minerals International, Inc. (b) | 4.88% | 07/15/24 | 648,859 | ||||
| 458,000 | Compass Minerals International, Inc. (b) | 6.75% | 12/01/27 | 439,683 | ||||
| 2,540,000 | Dycom Industries, Inc. (a) (b) | 4.50% | 04/15/29 | 2,321,293 | ||||
| 1,498,000 | Foundation Building Materials, Inc. (b) | 6.00% | 03/01/29 | 1,198,511 | ||||
| 900,000 | Great Lakes Dredge & Dock Corp. (b) | 5.25% | 06/01/29 | 708,808 | ||||
| 2,385,000 | Innophos Holdings, Inc. (a) (b) | 9.38% | 02/15/28 | 2,396,561 | ||||
| 2,445,000 | JELD-WEN, Inc. (a) (b) | 4.88% | 12/15/27 | 2,142,761 | ||||
| 1,820,000 | LGI Homes, Inc. (a) (b) | 4.00% | 07/15/29 | 1,488,501 | ||||
| 800,000 | MIWD Holdco II LLC/MIWD Finance Corp. (b) | 5.50% | 02/01/30 | 672,968 | ||||
| 1,125,000 | Novelis Corp. (b) | 3.25% | 11/15/26 | 1,031,129 | ||||
| 885,000 | Novelis Corp. (b) | 3.88% | 08/15/31 | 742,383 | ||||
| 385,000 | Olympus Water US Holding Corp. (b) | 4.25% | 10/01/28 | 328,790 | ||||
| 925,000 | Rain CII Carbon LLC/CII Carbon Corp. (b) | 7.25% | 04/01/25 | 897,500 | ||||
| 1,145,000 | Standard Industries, Inc./NJ (b) | 4.38% | 07/15/30 | 989,719 | ||||
| 1,390,000 | TopBuild Corp. (a) (b) | 4.13% | 02/15/32 | 1,196,471 | ||||
| 3,765,000 | TRI Pointe Group, Inc./TRI Pointe Homes, Inc. (a) | 5.88% | 06/15/24 | 3,761,762 | ||||
| 770,000 | Weekley Homes LLC/Weekley Finance Corp. (b) | 4.88% | 09/15/28 | 669,403 | ||||
| 27,446,035 | ||||||||
| Capital Goods – 5.0% | ||||||||
| 1,065,000 | Amsted Industries, Inc. (a) (b) | 5.63% | 07/01/27 | 1,045,536 | ||||
| 2,009,000 | Ball Corp. (a) | 6.88% | 03/15/28 | 2,091,237 | ||||
| 1,589,000 | Berry Global, Inc. (a) (b) | 4.50% | 02/15/26 | 1,542,070 | ||||
| 580,000 | Chart Industries, Inc. (b) | 7.50% | 01/01/30 | 598,125 | ||||
| 936,000 | Crown Americas LLC | 5.25% | 04/01/30 | 911,528 | ||||
| 1,470,000 | EnerSys (a) (b) | 4.38% | 12/15/27 | 1,379,051 | ||||
| 985,000 | Graphic Packaging International LLC (a) (b) | 3.75% | 02/01/30 | 881,575 | ||||
| 81,000 | Howmet Aerospace, Inc. | 6.88% | 05/01/25 | 83,531 | ||||
| 450,000 | Mauser Packaging Solutions Holding Co. (b) | 9.25% | 04/15/27 | 427,576 | ||||
| Principal Value | Description | Stated Coupon | Stated Maturity | Value | ||||
| CORPORATE BONDS AND NOTES (Continued) | ||||||||
| Capital Goods (Continued) | ||||||||
| $984,000 | Owens-Brockway Glass Container, Inc. (b) | 6.63% | 05/13/27 | $988,797 | ||||
| 320,000 | Sealed Air Corp. (b) | 6.13% | 02/01/28 | 325,125 | ||||
| 1,600,000 | TK Elevator US Newco, Inc. (a) (b) | 5.25% | 07/15/27 | 1,497,611 | ||||
| 1,085,000 | TransDigm, Inc. (a) (b) | 6.25% | 03/15/26 | 1,091,827 | ||||
| 1,800,000 | TransDigm, Inc. (a) | 6.38% | 06/15/26 | 1,800,068 | ||||
| 2,305,000 | TransDigm, Inc. (a) | 5.50% | 11/15/27 | 2,215,707 | ||||
| 2,000,000 | TransDigm, Inc. (b) | 6.75% | 08/15/28 | 2,033,582 | ||||
| 2,515,000 | TriMas Corp. (a) (b) | 4.13% | 04/15/29 | 2,241,217 | ||||
| 21,154,163 | ||||||||
| Consumer Goods – 6.0% | ||||||||
| 1,370,000 | CD&R Smokey Buyer, Inc. (b) | 6.75% | 07/15/25 | 1,209,025 | ||||
| 3,545,000 | Darling Ingredients, Inc. (a) (b) | 5.25% | 04/15/27 | 3,478,962 | ||||
| 665,000 | Darling Ingredients, Inc. (b) | 6.00% | 06/15/30 | 658,476 | ||||
| 2,120,000 | Edgewell Personal Care Co. (a) (b) | 5.50% | 06/01/28 | 2,031,930 | ||||
| 1,605,000 | Kronos Acquisition Holdings, Inc./KIK Custom Products, Inc. (a) (b) | 5.00% | 12/31/26 | 1,486,888 | ||||
| 3,149,000 | Kronos Acquisition Holdings, Inc./KIK Custom Products, Inc. (a) (b) | 7.00% | 12/31/27 | 2,771,049 | ||||
| 602,000 | Lamb Weston Holdings, Inc. (b) | 4.88% | 05/15/28 | 591,312 | ||||
| 1,585,000 | Mattel, Inc. (a) (b) | 5.88% | 12/15/27 | 1,588,378 | ||||
| 940,000 | Newell Brands, Inc. | 6.38% | 09/15/27 | 928,250 | ||||
| 1,000,000 | Performance Food Group, Inc. (b) | 4.25% | 08/01/29 | 911,254 | ||||
| 625,000 | Post Holdings, Inc. (a) (b) | 5.75% | 03/01/27 | 622,129 | ||||
| 3,510,000 | Post Holdings, Inc. (b) | 4.63% | 04/15/30 | 3,173,444 | ||||
| 3,300,000 | Primo Water Holdings, Inc. (a) (b) | 4.38% | 04/30/29 | 2,913,326 | ||||
| 1,100,000 | Simmons Foods, Inc./Simmons Prepared Foods, Inc./Simmons Pet Food, Inc./Simmons Feed (b) | 4.63% | 03/01/29 | 909,986 | ||||
| 1,017,000 | Spectrum Brands, Inc. | 5.75% | 07/15/25 | 1,009,017 | ||||
| 740,000 | Triton Water Holdings, Inc. (b) | 6.25% | 04/01/29 | 622,266 | ||||
| 670,000 | US Foods, Inc. (b) | 4.63% | 06/01/30 | 613,327 | ||||
| 25,519,019 | ||||||||
| Energy – 20.2% | ||||||||
| 1,200,000 | Aethon United BR L.P./Aethon United Finance Corp. (a) (b) | 8.25% | 02/15/26 | 1,166,552 | ||||
| 1,560,000 | Ascent Resources Utica Holdings LLC/ARU Finance Corp. (a) (b) | 7.00% | 11/01/26 | 1,511,400 | ||||
| 970,000 | Ascent Resources Utica Holdings LLC/ARU Finance Corp. (a) (b) | 8.25% | 12/31/28 | 942,929 | ||||
| 2,624,000 | Ascent Resources Utica Holdings LLC/ARU Finance Corp. (a) (b) | 5.88% | 06/30/29 | 2,359,072 | ||||
| 640,000 | Callon Petroleum Co. (a) | 6.38% | 07/01/26 | 619,150 | ||||
| 1,310,000 | Callon Petroleum Co. (b) | 7.50% | 06/15/30 | 1,245,726 | ||||
| 2,555,000 | Cheniere Energy Partners L.P. (a) | 4.50% | 10/01/29 | 2,406,968 | ||||
| 1,020,000 | Cheniere Energy, Inc. (a) | 4.63% | 10/15/28 | 973,183 | ||||
| 1,100,000 | CNX Midstream Partners L.P. (a) (b) | 4.75% | 04/15/30 | 922,105 | ||||
| 192,000 | CNX Resources Corp. (b) | 7.25% | 03/14/27 | 190,068 | ||||
| 822,000 | CNX Resources Corp. (b) | 6.00% | 01/15/29 | 761,327 | ||||
| 2,050,000 | Comstock Resources, Inc. (a) (b) | 6.75% | 03/01/29 | 1,858,114 | ||||
| 391,000 | Continental Resources, Inc./OK | 4.38% | 01/15/28 | 371,986 | ||||
| 1,025,000 | CrownRock L.P./CrownRock Finance, Inc. (b) | 5.00% | 05/01/29 | 969,374 | ||||
| 934,000 | DCP Midstream Operating L.P. (a) | 5.13% | 05/15/29 | 927,109 | ||||
| 695,000 | DCP Midstream Operating L.P. | 3.25% | 02/15/32 | 594,562 | ||||
| 2,650,000 | Delek Logistics Partners LP/Delek Logistics Finance Corp. (a) (b) | 7.13% | 06/01/28 | 2,416,482 | ||||
| 1,200,000 | DT Midstream, Inc. (b) | 4.13% | 06/15/29 | 1,064,842 | ||||
| 5,140,000 | Endeavor Energy Resources L.P./EER Finance, Inc. (a) (b) | 5.75% | 01/30/28 | 5,120,863 | ||||
| 1,900,000 | EnLink Midstream LLC (a) (b) | 5.63% | 01/15/28 | 1,873,238 | ||||
| 2,335,000 | EnLink Midstream LLC (a) | 5.38% | 06/01/29 | 2,256,950 | ||||
| Principal Value | Description | Stated Coupon | Stated Maturity | Value | ||||
| CORPORATE BONDS AND NOTES (Continued) | ||||||||
| Energy (Continued) | ||||||||
| $150,000 | EnLink Midstream LLC (b) | 6.50% | 09/01/30 | $151,678 | ||||
| 1,825,000 | EQM Midstream Partners L.P. (a) (b) | 6.50% | 07/01/27 | 1,781,818 | ||||
| 1,700,000 | EQM Midstream Partners L.P. (a) | 5.50% | 07/15/28 | 1,551,213 | ||||
| 132,000 | EQM Midstream Partners L.P. (b) | 7.50% | 06/01/30 | 128,265 | ||||
| 3,620,000 | EQM Midstream Partners L.P. (a) (b) | 4.75% | 01/15/31 | 2,971,101 | ||||
| 791,000 | Hess Midstream Operations L.P. (b) | 5.63% | 02/15/26 | 779,633 | ||||
| 1,040,000 | Hess Midstream Operations L.P. (a) (b) | 4.25% | 02/15/30 | 925,850 | ||||
| 1,845,000 | Hilcorp Energy I L.P./Hilcorp Finance Co. (a) (b) | 5.75% | 02/01/29 | 1,725,376 | ||||
| 1,320,000 | Hilcorp Energy I L.P./Hilcorp Finance Co. (a) (b) | 6.00% | 02/01/31 | 1,221,492 | ||||
| 1,145,000 | Holly Energy Partners L.P./Holly Energy Finance Corp. (b) | 6.38% | 04/15/27 | 1,130,214 | ||||
| 1,050,000 | Matador Resources Co. (b) | 6.88% | 04/15/28 | 1,057,833 | ||||
| 1,800,000 | Moss Creek Resources Holdings, Inc. (b) | 7.50% | 01/15/26 | 1,684,914 | ||||
| 1,130,000 | Nabors Industries, Inc. (b) | 7.38% | 05/15/27 | 1,097,445 | ||||
| 314,000 | Noble Finance II LLC (b) | 8.00% | 04/15/30 | 321,903 | ||||
| 4,280,000 | Occidental Petroleum Corp. (a) | 8.50% | 07/15/27 | 4,717,202 | ||||
| 3,070,000 | Occidental Petroleum Corp. (a) | 6.63% | 09/01/30 | 3,280,264 | ||||
| 1,310,000 | PBF Holding Co., LLC/PBF Finance Corp. | 7.25% | 06/15/25 | 1,306,921 | ||||
| 1,250,000 | PBF Holding Co., LLC/PBF Finance Corp. | 6.00% | 02/15/28 | 1,151,469 | ||||
| 2,626,000 | Permian Resources Operating LLC (a) (b) | 6.88% | 04/01/27 | 2,603,128 | ||||
| 725,000 | Rockcliff Energy II LLC (b) | 5.50% | 10/15/29 | 656,332 | ||||
| 1,913,000 | SM Energy Co. (a) | 5.63% | 06/01/25 | 1,871,765 | ||||
| 1,470,000 | SM Energy Co. | 6.50% | 07/15/28 | 1,394,214 | ||||
| 1,100,000 | Southwestern Energy Co. (d) | 5.70% | 01/23/25 | 1,099,136 | ||||
| 730,000 | Southwestern Energy Co. | 8.38% | 09/15/28 | 766,101 | ||||
| 3,265,000 | Southwestern Energy Co. (a) | 5.38% | 03/15/30 | 3,041,839 | ||||
| 1,700,000 | Southwestern Energy Co. (a) | 4.75% | 02/01/32 | 1,501,380 | ||||
| 547,000 | Sunoco L.P./Sunoco Finance Corp. | 4.50% | 05/15/29 | 493,427 | ||||
| 920,000 | Tap Rock Resources LLC (b) | 7.00% | 10/01/26 | 884,861 | ||||
| 2,000,000 | Targa Resources Partners L.P./Targa Resources Partners Finance Corp. | 5.00% | 01/15/28 | 1,958,160 | ||||
| 1,720,000 | Venture Global Calcasieu Pass LLC (a) (b) | 3.88% | 08/15/29 | 1,546,803 | ||||
| 1,875,000 | Venture Global Calcasieu Pass LLC (b) | 6.25% | 01/15/30 | 1,903,082 | ||||
| 2,645,000 | Venture Global Calcasieu Pass LLC (a) (b) | 4.13% | 08/15/31 | 2,346,214 | ||||
| 905,000 | Venture Global Calcasieu Pass LLC (a) (b) | 3.88% | 11/01/33 | 764,081 | ||||
| 1,575,000 | Vital Energy, Inc. (a) | 9.50% | 01/15/25 | 1,585,993 | ||||
| 1,785,000 | Vital Energy, Inc. (a) (b) | 7.75% | 07/31/29 | 1,577,601 | ||||
| 909,000 | Western Midstream Operating L.P. | 4.50% | 03/01/28 | 868,350 | ||||
| 1,251,000 | Western Midstream Operating L.P. (d) | 4.30% | 02/01/30 | 1,143,050 | ||||
| 85,542,108 | ||||||||
| Financial Services – 2.5% | ||||||||
| 1,150,000 | Fortress Transportation and Infrastructure Investors LLC (b) | 6.50% | 10/01/25 | 1,137,187 | ||||
| 2,100,000 | Icahn Enterprises L.P./Icahn Enterprises Finance Corp. (a) | 5.25% | 05/15/27 | 1,982,244 | ||||
| 1,395,000 | LPL Holdings, Inc. (a) (b) | 4.63% | 11/15/27 | 1,319,419 | ||||
| 1,330,000 | MSCI, Inc. (b) | 3.88% | 02/15/31 | 1,166,802 | ||||
| 2,345,000 | OneMain Finance Corp. | 6.13% | 03/15/24 | 2,310,251 | ||||
| 610,000 | OneMain Finance Corp. | 3.50% | 01/15/27 | 521,733 | ||||
| 1,225,000 | PennyMac Financial Services, Inc. (b) | 5.38% | 10/15/25 | 1,157,601 | ||||
| 1,240,000 | Rocket Mortgage LLC/Rocket Mortgage Co-Issuer, Inc. (b) | 3.63% | 03/01/29 | 1,049,672 | ||||
| 10,644,909 | ||||||||
| Healthcare – 7.2% | ||||||||
| 3,065,000 | Avantor Funding, Inc. (a) (b) | 3.88% | 11/01/29 | 2,703,381 | ||||
| 2,000,000 | Carriage Services, Inc. (b) | 4.25% | 05/15/29 | 1,659,517 | ||||
| 1,300,000 | Catalent Pharma Solutions, Inc. (b) | 3.13% | 02/15/29 | 1,107,622 | ||||
| Principal Value | Description | Stated Coupon | Stated Maturity | Value | ||||
| CORPORATE BONDS AND NOTES (Continued) | ||||||||
| Healthcare (Continued) | ||||||||
| $1,365,000 | Catalent Pharma Solutions, Inc. (a) (b) | 3.50% | 04/01/30 | $1,158,679 | ||||
| 4,010,000 | Centene Corp. (a) | 4.63% | 12/15/29 | 3,783,034 | ||||
| 985,000 | CHS/Community Health Systems, Inc. (b) | 6.00% | 01/15/29 | 874,005 | ||||
| 2,250,000 | CHS/Community Health Systems, Inc. (a) (b) | 5.25% | 05/15/30 | 1,877,398 | ||||
| 1,250,000 | Elanco Animal Health, Inc. (a) (e) | 6.65% | 08/28/28 | 1,220,163 | ||||
| 1,405,000 | Encompass Health Corp. | 4.50% | 02/01/28 | 1,326,644 | ||||
| 1,495,000 | HCA, Inc. (a) | 5.88% | 02/15/26 | 1,518,821 | ||||
| 1,495,000 | HCA, Inc. (a) | 5.88% | 02/01/29 | 1,541,872 | ||||
| 1,665,000 | HealthEquity, Inc. (a) (b) | 4.50% | 10/01/29 | 1,490,924 | ||||
| 885,000 | PRA Health Sciences, Inc. (b) | 2.88% | 07/15/26 | 808,791 | ||||
| 1,325,000 | Prestige Brands, Inc. (a) (b) | 5.13% | 01/15/28 | 1,286,820 | ||||
| 990,000 | Prestige Brands, Inc. (b) | 3.75% | 04/01/31 | 839,975 | ||||
| 4,750,000 | Service Corp International (a) | 7.50% | 04/01/27 | 4,966,997 | ||||
| 1,730,000 | Teleflex, Inc. (a) (b) | 4.25% | 06/01/28 | 1,624,108 | ||||
| 175,000 | Tenet Healthcare Corp. | 4.38% | 01/15/30 | 161,009 | ||||
| 778,000 | Tenet Healthcare Corp. (b) | 6.13% | 06/15/30 | 770,229 | ||||
| 30,719,989 | ||||||||
| Insurance – 0.1% | ||||||||
| 505,000 | NMI Holdings, Inc. (b) | 7.38% | 06/01/25 | 514,007 | ||||
| Leisure – 5.3% | ||||||||
| 1,730,000 | Affinity Interactive (a) (b) | 6.88% | 12/15/27 | 1,557,809 | ||||
| 1,790,000 | Boyd Gaming Corp. (a) | 4.75% | 12/01/27 | 1,729,112 | ||||
| 1,290,000 | Caesars Entertainment, Inc. (a) (b) | 6.25% | 07/01/25 | 1,292,735 | ||||
| 1,055,000 | Caesars Resort Collection LLC/CRC Finco, Inc. (a) (b) | 5.75% | 07/01/25 | 1,064,653 | ||||
| 3,775,000 | Carnival Holdings Bermuda Ltd. (b) | 10.38% | 05/01/28 | 4,062,255 | ||||
| 1,470,000 | CDI Escrow Issuer, Inc. (a) (b) | 5.75% | 04/01/30 | 1,418,736 | ||||
| 1,200,000 | Everi Holdings, Inc. (b) | 5.00% | 07/15/29 | 1,070,640 | ||||
| 1,800,000 | Hilton Domestic Operating Co., Inc. (a) | 4.88% | 01/15/30 | 1,710,559 | ||||
| 1,725,000 | Hilton Domestic Operating Co., Inc. (a) (b) | 4.00% | 05/01/31 | 1,527,271 | ||||
| 524,000 | Penn Entertainment, Inc. (b) | 4.13% | 07/01/29 | 441,918 | ||||
| 765,000 | Scientific Games Holdings L.P./Scientific Games US FinCo, Inc. (b) | 6.63% | 03/01/30 | 679,419 | ||||
| 2,700,000 | Scientific Games International, Inc. (a) (b) | 7.00% | 05/15/28 | 2,696,855 | ||||
| 1,550,000 | Station Casinos LLC (b) | 4.50% | 02/15/28 | 1,426,961 | ||||
| 325,000 | Station Casinos LLC (b) | 4.63% | 12/01/31 | 278,585 | ||||
| 1,485,000 | Wynn Resorts Finance LLC/Wynn Resorts Capital Corp. (b) | 5.13% | 10/01/29 | 1,368,649 | ||||
| 22,326,157 | ||||||||
| Media – 11.8% | ||||||||
| 1,235,000 | Arches Buyer, Inc. (a) (b) | 4.25% | 06/01/28 | 1,064,242 | ||||
| 2,300,000 | Arches Buyer, Inc. (a) (b) | 6.13% | 12/01/28 | 1,997,573 | ||||
| 1,850,000 | CCO Holdings LLC/CCO Holdings Capital Corp. (a) (b) | 5.50% | 05/01/26 | 1,818,663 | ||||
| 6,100,000 | CCO Holdings LLC/CCO Holdings Capital Corp. (a) (b) | 5.13% | 05/01/27 | 5,765,047 | ||||
| 2,380,000 | CCO Holdings LLC/CCO Holdings Capital Corp. (a) (b) | 5.38% | 06/01/29 | 2,185,478 | ||||
| 1,605,000 | CCO Holdings LLC/CCO Holdings Capital Corp. (b) | 6.38% | 09/01/29 | 1,526,771 | ||||
| 3,330,000 | CCO Holdings LLC/CCO Holdings Capital Corp. (a) (b) | 4.75% | 03/01/30 | 2,869,681 | ||||
| 3,500,000 | CSC Holdings LLC (a) | 5.25% | 06/01/24 | 3,417,098 | ||||
| 2,325,000 | CSC Holdings LLC (a) (b) | 5.50% | 04/15/27 | 1,991,100 | ||||
| 1,800,000 | CSC Holdings LLC (b) | 5.38% | 02/01/28 | 1,478,750 | ||||
| 1,300,000 | CSC Holdings LLC (b) | 11.25% | 05/15/28 | 1,296,854 | ||||
| 1,350,000 | CSC Holdings LLC (b) | 5.75% | 01/15/30 | 690,179 | ||||
| 2,230,000 | CSC Holdings LLC (a) (b) | 4.63% | 12/01/30 | 1,090,776 | ||||
| 2,655,000 | Directv Financing LLC/Directv Financing Co-Obligor, Inc. (a) (b) | 5.88% | 08/15/27 | 2,332,868 | ||||
| Principal Value | Description | Stated Coupon | Stated Maturity | Value | ||||
| CORPORATE BONDS AND NOTES (Continued) | ||||||||
| Media (Continued) | ||||||||
| $1,140,000 | DISH DBS Corp. (b) | 5.25% | 12/01/26 | $872,906 | ||||
| 1,273,000 | DISH DBS Corp. | 7.38% | 07/01/28 | 639,108 | ||||
| 1,255,000 | iHeartCommunications, Inc. (a) (b) | 5.25% | 08/15/27 | 992,930 | ||||
| 1,250,000 | iHeartCommunications, Inc. (a) (b) | 4.75% | 01/15/28 | 974,859 | ||||
| 2,185,000 | Lamar Media Corp. (a) | 4.00% | 02/15/30 | 1,962,316 | ||||
| 900,000 | Match Group Holdings II LLC (b) | 3.63% | 10/01/31 | 736,263 | ||||
| 3,100,000 | Netflix, Inc. (a) | 4.88% | 04/15/28 | 3,122,118 | ||||
| 945,000 | News Corp. (b) | 3.88% | 05/15/29 | 839,869 | ||||
| 1,480,000 | News Corp. (b) | 5.13% | 02/15/32 | 1,364,320 | ||||
| 920,000 | Nexstar Media, Inc. (b) | 5.63% | 07/15/27 | 864,998 | ||||
| 2,175,000 | Sirius XM Radio, Inc. (a) (b) | 4.13% | 07/01/30 | 1,746,977 | ||||
| 410,000 | TEGNA, Inc. | 4.63% | 03/15/28 | 366,560 | ||||
| 655,000 | TripAdvisor, Inc. (b) | 7.00% | 07/15/25 | 659,854 | ||||
| 880,000 | Univision Communications, Inc. (b) | 4.50% | 05/01/29 | 759,231 | ||||
| 3,370,000 | Warnermedia Holdings, Inc. (b) | 3.76% | 03/15/27 | 3,177,646 | ||||
| 1,490,000 | WMG Acquisition Corp. (b) | 3.75% | 12/01/29 | 1,312,601 | ||||
| 49,917,636 | ||||||||
| Real Estate – 4.4% | ||||||||
| 1,199,000 | Iron Mountain, Inc. (a) (b) | 4.88% | 09/15/27 | 1,144,765 | ||||
| 1,845,000 | Iron Mountain, Inc. (a) (b) | 5.25% | 03/15/28 | 1,777,235 | ||||
| 1,480,000 | Iron Mountain, Inc. (b) | 5.25% | 07/15/30 | 1,365,059 | ||||
| 825,000 | Iron Mountain, Inc. (b) | 4.50% | 02/15/31 | 718,387 | ||||
| 700,000 | Park Intermediate Holdings LLC/PK Domestic Property LLC/PK Finance Co-Issuer (b) | 5.88% | 10/01/28 | 646,380 | ||||
| 2,650,000 | Park Intermediate Holdings LLC/PK Domestic Property LLC/PK Finance Co-Issuer (a) (b) | 4.88% | 05/15/29 | 2,294,635 | ||||
| 1,500,000 | SBA Communications Corp. | 3.88% | 02/15/27 | 1,400,675 | ||||
| 1,840,000 | SBA Communications Corp. (a) | 3.13% | 02/01/29 | 1,576,422 | ||||
| 1,934,000 | Service Properties Trust (a) | 7.50% | 09/15/25 | 1,897,003 | ||||
| 2,040,000 | Uniti Group LP/Uniti Group Finance, Inc./CSL Capital LLC (b) | 10.50% | 02/15/28 | 1,953,905 | ||||
| 2,295,000 | VICI Properties L.P./VICI Note Co., Inc. (b) | 5.63% | 05/01/24 | 2,285,960 | ||||
| 360,000 | VICI Properties L.P./VICI Note Co., Inc. (b) | 3.50% | 02/15/25 | 346,343 | ||||
| 375,000 | VICI Properties L.P./VICI Note Co., Inc. (b) | 4.25% | 12/01/26 | 357,786 | ||||
| 925,000 | XHR L.P. (b) | 4.88% | 06/01/29 | 803,649 | ||||
| 18,568,204 | ||||||||
| Retail – 5.3% | ||||||||
| 1,555,000 | Albertsons Cos, Inc./Safeway, Inc./New Albertsons L.P./Albertsons LLC (a) (b) | 6.50% | 02/15/28 | 1,576,078 | ||||
| 3,490,000 | Albertsons Cos, Inc./Safeway, Inc./New Albertsons L.P./Albertsons LLC (a) (b) | 3.50% | 03/15/29 | 3,095,877 | ||||
| 2,150,000 | Arko Corp. (a) (b) | 5.13% | 11/15/29 | 1,744,080 | ||||
| 1,430,000 | Asbury Automotive Group, Inc. (a) | 4.50% | 03/01/28 | 1,300,709 | ||||
| 817,000 | Bath & Body Works, Inc. (b) | 9.38% | 07/01/25 | 875,279 | ||||
| 1,900,000 | Bath & Body Works, Inc. (a) | 7.50% | 06/15/29 | 1,932,781 | ||||
| 555,000 | Group 1 Automotive, Inc. (b) | 4.00% | 08/15/28 | 493,029 | ||||
| 700,000 | LCM Investments Holdings II LLC (b) | 4.88% | 05/01/29 | 597,459 | ||||
| 870,000 | Lithia Motors, Inc. (b) | 3.88% | 06/01/29 | 754,321 | ||||
| 620,000 | Michaels Cos (The), Inc. (b) | 7.88% | 05/01/29 | 416,181 | ||||
| 875,000 | Nordstrom, Inc. | 4.38% | 04/01/30 | 685,484 | ||||
| 675,000 | QVC, Inc. | 4.38% | 09/01/28 | 333,011 | ||||
| 330,000 | Ritchie Bros Holdings, Inc. (b) | 7.75% | 03/15/31 | 351,037 | ||||
| 2,795,000 | Sonic Automotive, Inc. (a) (b) | 4.63% | 11/15/29 | 2,347,911 | ||||
| 825,000 | Sonic Automotive, Inc. (b) | 4.88% | 11/15/31 | 666,988 | ||||
| Principal Value | Description | Stated Coupon | Stated Maturity | Value | ||||
| CORPORATE BONDS AND NOTES (Continued) | ||||||||
| Retail (Continued) | ||||||||
| $1,415,000 | Victoria’s Secret & Co. (b) | 4.63% | 07/15/29 | $1,145,854 | ||||
| 1,135,000 | Yum! Brands, Inc. (b) | 4.75% | 01/15/30 | 1,098,983 | ||||
| 2,950,000 | Yum! Brands, Inc. (a) | 5.38% | 04/01/32 | 2,880,198 | ||||
| 22,295,260 | ||||||||
| Services – 10.3% | ||||||||
| 3,225,000 | Allied Universal Holdco LLC/Allied Universal Finance Corp. (a) (b) | 6.63% | 07/15/26 | 3,113,082 | ||||
| 1,985,000 | Allied Universal Holdco LLC/Allied Universal Finance Corp. (a) (b) | 9.75% | 07/15/27 | 1,849,103 | ||||
| 685,000 | Allied Universal Holdco LLC/Allied Universal Finance Corp. (b) | 6.00% | 06/01/29 | 537,671 | ||||
| 680,000 | Aramark Services, Inc. (a) (b) | 6.38% | 05/01/25 | 680,884 | ||||
| 1,075,000 | Aramark Services, Inc. (a) (b) | 5.00% | 02/01/28 | 1,025,227 | ||||
| 390,000 | Avis Budget Car Rental LLC/Avis Budget Finance, Inc. (b) | 5.38% | 03/01/29 | 354,157 | ||||
| 1,250,000 | Brink’s (The) Co. (a) (b) | 5.50% | 07/15/25 | 1,239,150 | ||||
| 625,000 | Clarivate Science Holdings Corp. (a) (b) | 3.88% | 07/01/28 | 563,137 | ||||
| 1,520,000 | Clean Harbors, Inc. (a) (b) | 4.88% | 07/15/27 | 1,473,541 | ||||
| 2,175,000 | Covanta Holding Corp. (a) (b) | 4.88% | 12/01/29 | 1,937,707 | ||||
| 950,000 | GYP Holdings III Corp. (a) (b) | 4.63% | 05/01/29 | 839,496 | ||||
| 3,045,000 | H&E Equipment Services, Inc. (a) (b) | 3.88% | 12/15/28 | 2,641,949 | ||||
| 3,605,000 | Herc Holdings, Inc. (a) (b) | 5.50% | 07/15/27 | 3,448,631 | ||||
| 750,000 | Hertz (The) Corp. (b) | 4.63% | 12/01/26 | 676,260 | ||||
| 1,450,000 | Imola Merger Corp. (a) (b) | 4.75% | 05/15/29 | 1,257,232 | ||||
| 1,445,000 | NESCO Holdings II, Inc. (a) (b) | 5.50% | 04/15/29 | 1,306,988 | ||||
| 1,915,000 | Prime Security Services Borrower LLC/Prime Finance, Inc. (a) (b) | 3.38% | 08/31/27 | 1,713,944 | ||||
| 1,800,000 | Sotheby’s (a) (b) | 7.38% | 10/15/27 | 1,690,160 | ||||
| 2,065,000 | Sotheby’s/Bidfair Holdings, Inc. (a) (b) | 5.88% | 06/01/29 | 1,701,766 | ||||
| 3,000,000 | Uber Technologies, Inc. (a) (b) | 7.50% | 05/15/25 | 3,047,865 | ||||
| 1,850,000 | United Rentals North America, Inc. (b) | 6.00% | 12/15/29 | 1,879,210 | ||||
| 2,165,000 | United Rentals North America, Inc. (a) | 3.75% | 01/15/32 | 1,858,460 | ||||
| 3,065,000 | WASH Multifamily Acquisition, Inc. (a) (b) | 5.75% | 04/15/26 | 2,876,631 | ||||
| 2,500,000 | Waste Pro USA, Inc. (a) (b) | 5.50% | 02/15/26 | 2,326,932 | ||||
| 880,000 | WESCO Distribution, Inc. (b) | 7.13% | 06/15/25 | 896,229 | ||||
| 1,045,000 | WESCO Distribution, Inc. (b) | 7.25% | 06/15/28 | 1,074,081 | ||||
| 225,000 | White Cap Buyer LLC (b) | 6.88% | 10/15/28 | 195,342 | ||||
| 805,000 | Williams Scotsman International, Inc. (a) (b) | 6.13% | 06/15/25 | 802,055 | ||||
| 855,000 | Williams Scotsman International, Inc. (b) | 4.63% | 08/15/28 | 785,939 | ||||
| 43,792,829 | ||||||||
| Technology & Electronics – 4.2% | ||||||||
| 900,000 | Boxer Parent Co., Inc. (a) (b) | 7.13% | 10/02/25 | 898,416 | ||||
| 1,760,000 | Central Parent, Inc./CDK Global, Inc. (a) (b) | 7.25% | 06/15/29 | 1,744,440 | ||||
| 850,000 | Cloud Software Group, Inc. (b) | 6.50% | 03/31/29 | 766,473 | ||||
| 2,380,000 | CommScope, Inc. (a) (b) | 6.00% | 03/01/26 | 2,276,586 | ||||
| 820,000 | CommScope, Inc. (b) | 8.25% | 03/01/27 | 634,796 | ||||
| 1,235,000 | Dell International LLC/EMC Corp. (a) | 8.35% | 07/15/46 | 1,523,339 | ||||
| 1,900,000 | Entegris, Inc. (a) (b) | 4.38% | 04/15/28 | 1,741,497 | ||||
| 3,110,000 | Fair Isaac Corp. (a) (b) | 4.00% | 06/15/28 | 2,901,716 | ||||
| 934,000 | NCR Corp. (b) | 5.13% | 04/15/29 | 808,937 | ||||
| 349,000 | Newfold Digital Holdings Group, Inc. (b) | 6.00% | 02/15/29 | 240,019 | ||||
| 585,000 | Presidio Holdings, Inc. (b) | 8.25% | 02/01/28 | 551,453 | ||||
| 580,000 | PTC, Inc. (b) | 3.63% | 02/15/25 | 560,195 | ||||
| 355,000 | PTC, Inc. (b) | 4.00% | 02/15/28 | 330,606 | ||||
| 690,000 | SS&C Technologies, Inc. (b) | 5.50% | 09/30/27 | 668,794 | ||||
| 350,000 | Twilio, Inc. | 3.63% | 03/15/29 | 299,239 | ||||
| Principal Value | Description | Stated Coupon | Stated Maturity | Value | ||||
| CORPORATE BONDS AND NOTES (Continued) | ||||||||
| Technology & Electronics (Continued) | ||||||||
| $2,320,000 | Viavi Solutions, Inc. (a) (b) | 3.75% | 10/01/29 | $1,940,030 | ||||
| 17,886,536 | ||||||||
| Telecommunications – 2.7% | ||||||||
| 1,200,000 | Cable One, Inc. (a) (b) | 4.00% | 11/15/30 | 976,920 | ||||
| 655,000 | Cogent Communications Group, Inc. (a) (b) | 3.50% | 05/01/26 | 609,566 | ||||
| 1,035,000 | Cogent Communications Group, Inc. (b) | 7.00% | 06/15/27 | 1,025,616 | ||||
| 1,765,000 | Level 3 Financing, Inc. (b) | 3.63% | 01/15/29 | 988,708 | ||||
| 900,000 | Level 3 Financing, Inc. (a) (b) | 3.75% | 07/15/29 | 507,311 | ||||
| 3,685,000 | Sprint LLC | 7.63% | 03/01/26 | 3,905,411 | ||||
| 565,000 | T-Mobile USA, Inc. | 2.25% | 02/15/26 | 526,314 | ||||
| 1,515,000 | T-Mobile USA, Inc. | 3.75% | 04/05/27 | 1,459,776 | ||||
| 1,490,000 | T-Mobile USA, Inc. | 5.38% | 04/15/27 | 1,505,365 | ||||
| 11,504,987 | ||||||||
| Transportation – 1.7% | ||||||||
| 555,000 | Allegiant Travel Co. (b) | 7.25% | 08/15/27 | 548,673 | ||||
| 1,540,000 | American Airlines, Inc. (a) (b) | 11.75% | 07/15/25 | 1,695,931 | ||||
| 714,000 | First Student Bidco, Inc./First Transit Parent, Inc. (b) | 4.00% | 07/31/29 | 619,593 | ||||
| 633,058 | JetBlue 2020-1 Class B Pass Through Trust | 7.75% | 11/15/28 | 644,411 | ||||
| 2,282,250 | Mileage Plus Holdings LLC/Mileage Plus Intellectual Property Assets Ltd. (a) (b) | 6.50% | 06/20/27 | 2,281,338 | ||||
| 685,000 | United Airlines, Inc. (b) | 4.38% | 04/15/26 | 655,014 | ||||
| 895,000 | United Airlines, Inc. (a) (b) | 4.63% | 04/15/29 | 810,939 | ||||
| 39,766 | US Airways 2000-3C Pass Through Trust (f) (g) | 8.39% | 09/01/23 | 39,766 | ||||
| 7,295,665 | ||||||||
| Utility – 2.5% | ||||||||
| 1,000,000 | Calpine Corp. (b) | 4.63% | 02/01/29 | 870,087 | ||||
| 2,205,000 | Calpine Corp. (a) (b) | 3.75% | 03/01/31 | 1,883,400 | ||||
| 470,000 | Clearway Energy Operating LLC (b) | 3.75% | 02/15/31 | 402,738 | ||||
| 1,690,000 | Clearway Energy Operating LLC (a) (b) | 3.75% | 01/15/32 | 1,419,382 | ||||
| 1,355,000 | FirstEnergy Corp. (a) (e) | 4.15% | 07/15/27 | 1,319,682 | ||||
| 2,515,000 | PG&E Corp. (a) | 5.00% | 07/01/28 | 2,369,930 | ||||
| 1,060,000 | Vistra Operations Co. LLC (b) | 5.63% | 02/15/27 | 1,035,543 | ||||
| 1,310,000 | Vistra Operations Co. LLC (b) | 4.38% | 05/01/29 | 1,172,395 | ||||
| 10,473,157 | ||||||||
Total Corporate Bonds and Notes | 426,235,644 | |||||||
| (Cost $455,068,313) | ||||||||
| Principal Value (Local Currency) | Description | Stated Coupon | Stated Maturity | Value (US Dollars) | ||||
| FOREIGN CORPORATE BONDS AND NOTES – 23.7% | ||||||||
| Automotive – 0.6% | ||||||||
| 918,000 | Clarios Global L.P. (USD) (b) | 6.75% | 05/15/25 | 920,582 | ||||
| 607,000 | Clarios Global L.P./Clarios US Finance Co. (USD) (b) | 6.25% | 05/15/26 | 604,874 | ||||
| 1,099,000 | Clarios Global L.P./Clarios US Finance Co. (USD) (b) | 8.50% | 05/15/27 | 1,107,486 | ||||
| 2,632,942 | ||||||||
| Banking – 0.8% | ||||||||
| 2,930,000 | Barclays PLC (USD) (a) (c) | 7.33% | 11/02/26 | 3,041,849 | ||||
| Principal Value (Local Currency) | Description | Stated Coupon | Stated Maturity | Value (US Dollars) | ||||
| FOREIGN CORPORATE BONDS AND NOTES (Continued) | ||||||||
| Banking (Continued) | ||||||||
| 500,000 | Intesa Sanpaolo SpA (USD) (b) | 5.02% | 06/26/24 | $485,919 | ||||
| 3,527,768 | ||||||||
| Basic Industry – 2.3% | ||||||||
| 1,350,000 | Ahlstrom Holding 3 Oy (USD) (b) | 4.88% | 02/04/28 | 1,149,847 | ||||
| 2,175,000 | INEOS Finance PLC (USD) (b) | 6.75% | 05/15/28 | 2,151,140 | ||||
| 1,900,000 | James Hardie International Finance DAC (USD) (a) (b) | 5.00% | 01/15/28 | 1,793,119 | ||||
| 475,000 | Nobian Finance BV (EUR) (h) | 3.63% | 07/15/26 | 452,759 | ||||
| 2,250,000 | SPCM S.A. (USD) (a) (b) | 3.38% | 03/15/30 | 1,864,015 | ||||
| 2,200,000 | Stora Enso OYJ (USD) (a) (b) | 7.25% | 04/15/36 | 2,349,665 | ||||
| 9,760,545 | ||||||||
| Capital Goods – 3.6% | ||||||||
| 464,000 | Ardagh Metal Packaging Finance USA LLC/Ardagh Metal Packaging Finance PLC (USD) (b) | 6.00% | 06/15/27 | 462,142 | ||||
| 1,815,000 | Ardagh Metal Packaging Finance USA LLC/Ardagh Metal Packaging Finance PLC (USD) (a) (b) | 3.25% | 09/01/28 | 1,591,322 | ||||
| 1,385,000 | Bombardier, Inc. (USD) (a) (b) | 7.13% | 06/15/26 | 1,382,101 | ||||
| 4,980,000 | Bombardier, Inc. (USD) (a) (b) | 7.88% | 04/15/27 | 4,971,089 | ||||
| 715,000 | Bombardier, Inc. (USD) (b) | 6.00% | 02/15/28 | 678,923 | ||||
| 188,000 | Bombardier, Inc. (USD) (b) | 7.50% | 02/01/29 | 185,111 | ||||
| 2,240,000 | Canpack S.A./Canpack US LLC (USD) (a) (b) | 3.13% | 11/01/25 | 1,989,882 | ||||
| 450,000 | Canpack S.A./Canpack US LLC (USD) (b) | 3.88% | 11/15/29 | 361,417 | ||||
| 1,880,000 | Cascades, Inc./Cascades USA, Inc. (USD) (a) (b) | 5.38% | 01/15/28 | 1,785,991 | ||||
| 875,000 | OI European Group BV (USD) (b) | 4.75% | 02/15/30 | 804,344 | ||||
| 1,380,000 | Titan Acquisition Ltd./Titan Co-Borrower LLC (USD) (b) | 7.75% | 04/15/26 | 1,230,015 | ||||
| 15,442,337 | ||||||||
| Consumer Goods – 0.7% | ||||||||
| 1,000,000 | JBS USA LUX S.A./JBS USA Food Co./JBS USA Finance, Inc. (USD) (a) (b) | 5.50% | 01/15/30 | 955,965 | ||||
| 2,500,000 | Minerva Luxembourg S.A. (USD) (a) (b) | 4.38% | 03/18/31 | 1,967,840 | ||||
| 2,923,805 | ||||||||
| Energy – 2.0% | ||||||||
| 1,775,000 | Baytex Energy Corp. (USD) (b) | 8.50% | 04/30/30 | 1,786,424 | ||||
| 2,065,000 | MEG Energy Corp. (USD) (a) (b) | 7.13% | 02/01/27 | 2,119,376 | ||||
| 2,250,000 | Petroleos Mexicanos (USD) (a) | 6.50% | 03/13/27 | 2,021,464 | ||||
| 650,000 | Transocean Titan Financing Ltd. (USD) (b) | 8.38% | 02/01/28 | 663,156 | ||||
| 662,000 | Transocean, Inc. (USD) (b) | 8.75% | 02/15/30 | 668,620 | ||||
| 1,257,000 | Valaris Ltd. (USD) (b) | 8.38% | 04/30/30 | 1,258,842 | ||||
| 8,517,882 | ||||||||
| Financial Services – 0.5% | ||||||||
| 1,895,000 | Credit Suisse AG/New York NY (USD) | 7.95% | 01/09/25 | 1,931,024 | ||||
| Leisure – 4.1% | ||||||||
| 725,000 | Carnival Corp. (USD) (b) | 5.75% | 03/01/27 | 597,472 | ||||
| 2,885,000 | Carnival Corp. (USD) (a) (b) | 6.00% | 05/01/29 | 2,267,030 | ||||
| 778,000 | International Game Technology PLC (USD) (b) | 5.25% | 01/15/29 | 746,907 | ||||
| 700,000 | Melco Resorts Finance Ltd. (USD) (b) | 5.75% | 07/21/28 | 610,750 | ||||
| 2,890,000 | NCL Corp Ltd. (USD) (a) (b) | 5.88% | 03/15/26 | 2,492,473 | ||||
| 2,220,000 | NCL Corp Ltd. (USD) (a) (b) | 5.88% | 02/15/27 | 2,096,207 | ||||
| 845,000 | NCL Corp Ltd. (USD) (b) | 8.38% | 02/01/28 | 850,929 | ||||
| Principal Value (Local Currency) | Description | Stated Coupon | Stated Maturity | Value (US Dollars) | ||||
| FOREIGN CORPORATE BONDS AND NOTES (Continued) | ||||||||
| Leisure (Continued) | ||||||||
| 765,000 | NCL Corp Ltd. (USD) (b) | 7.75% | 02/15/29 | $648,445 | ||||
| 1,300,000 | NCL Finance Ltd. (USD) (b) | 6.13% | 03/15/28 | 1,050,972 | ||||
| 1,875,000 | Royal Caribbean Cruises Ltd. (USD) (b) | 5.38% | 07/15/27 | 1,666,446 | ||||
| 437,000 | Royal Caribbean Cruises Ltd. (USD) (b) | 8.25% | 01/15/29 | 460,561 | ||||
| 1,708,000 | Royal Caribbean Cruises Ltd. (USD) (b) | 9.25% | 01/15/29 | 1,823,760 | ||||
| 291,000 | Royal Caribbean Cruises Ltd. (USD) (b) | 7.25% | 01/15/30 | 292,080 | ||||
| 859,000 | Viking Cruises Ltd. (USD) (b) | 5.88% | 09/15/27 | 737,954 | ||||
| 1,045,000 | VOC Escrow Ltd. (USD) (b) | 5.00% | 02/15/28 | 930,441 | ||||
| 17,272,427 | ||||||||
| Media – 0.4% | ||||||||
| 1,820,000 | UPC Holding, B.V. (USD) (a) (b) | 5.50% | 01/15/28 | 1,631,093 | ||||
| Retail – 1.0% | ||||||||
| 1,855,000 | 1011778 BC ULC/New Red Finance, Inc. (USD) (a) (b) | 5.75% | 04/15/25 | 1,861,088 | ||||
| 1,000,000 | 1011778 BC ULC/New Red Finance, Inc. (USD) (b) | 3.50% | 02/15/29 | 900,003 | ||||
| 1,425,000 | 1011778 BC ULC/New Red Finance, Inc. (USD) (b) | 4.00% | 10/15/30 | 1,245,281 | ||||
| 4,006,372 | ||||||||
| Services – 2.4% | ||||||||
| 2,330,000 | Garda World Security Corp. (USD) (a) (b) | 4.63% | 02/15/27 | 2,143,501 | ||||
| 3,410,000 | Garda World Security Corp. (USD) (a) (b) | 9.50% | 11/01/27 | 3,272,270 | ||||
| 750,000 | GFL Environmental, Inc. (USD) (b) | 3.75% | 08/01/25 | 725,965 | ||||
| 800,000 | GFL Environmental, Inc. (USD) (b) | 5.13% | 12/15/26 | 788,200 | ||||
| 2,765,000 | GFL Environmental, Inc. (USD) (a) (b) | 4.00% | 08/01/28 | 2,526,438 | ||||
| 655,000 | GFL Environmental, Inc. (USD) (a) (b) | 4.75% | 06/15/29 | 610,257 | ||||
| 10,066,631 | ||||||||
| Technology & Electronics – 1.0% | ||||||||
| 1,650,000 | Broadcom Corp./Broadcom Cayman Finance Ltd. (USD) | 3.50% | 01/15/28 | 1,550,229 | ||||
| 1,760,000 | Open Text Corp. (USD) (a) (b) | 3.88% | 12/01/29 | 1,481,355 | ||||
| 206,000 | Seagate HDD Cayman (USD) | 4.13% | 01/15/31 | 171,181 | ||||
| 291,200 | Seagate HDD Cayman (USD) (b) | 9.63% | 12/01/32 | 319,642 | ||||
| 725,000 | Sensata Technologies BV (USD) (b) | 4.00% | 04/15/29 | 656,034 | ||||
| 244,000 | Sensata Technologies BV (USD) (b) | 5.88% | 09/01/30 | 239,851 | ||||
| 4,418,292 | ||||||||
| Telecommunications – 2.8% | ||||||||
| 1,635,000 | Altice France S.A./France (USD) (a) (b) | 5.13% | 07/15/29 | 1,210,310 | ||||
| 1,350,000 | Iliad Holding SAS (USD) (a) (b) | 6.50% | 10/15/26 | 1,300,199 | ||||
| 1,340,000 | Telecom Italia Capital S.A. (USD) | 7.72% | 06/04/38 | 1,254,361 | ||||
| 1,300,000 | Total Play Telecomunicaciones SA de CV (USD) (a) (b) | 6.38% | 09/20/28 | 857,469 | ||||
| 4,000,000 | Virgin Media Finance PLC (EUR) (h) | 3.75% | 07/15/30 | 3,466,727 | ||||
| 1,000,000 | Vmed O2 UK Financing I PLC (GBP) (b) | 4.50% | 07/15/31 | 985,594 | ||||
| 870,000 | VZ Secured Financing BV (USD) (a) (b) | 5.00% | 01/15/32 | 726,988 | ||||
| 2,700,000 | Ziggo Bond Co. BV (USD) (a) (b) | 5.13% | 02/28/30 | 2,196,444 | ||||
| 11,998,092 | ||||||||
| Transportation – 1.5% | ||||||||
| 850,000 | Air Canada (USD) (a) (b) | 3.88% | 08/15/26 | 787,898 | ||||
| 2,595,000 | Air Canada 2020-1 Class C Pass Through Trust (USD) (b) | 10.50% | 07/15/26 | 2,770,615 | ||||
| 2,095,000 | American Airlines, Inc./AAdvantage Loyalty IP Ltd. (USD) (a) (b) | 5.50% | 04/20/26 | 2,059,686 | ||||
| Principal Value (Local Currency) | Description | Stated Coupon | Stated Maturity | Value (US Dollars) | ||||
| FOREIGN CORPORATE BONDS AND NOTES (Continued) | ||||||||
| Transportation (Continued) | ||||||||
| 575,000 | Stena International S.A. (EUR) (b) | 7.25% | 02/15/28 | $642,304 | ||||
| 6,260,503 | ||||||||
Total Foreign Corporate Bonds and Notes | 100,389,713 | |||||||
| (Cost $107,088,845) | ||||||||
| Par Amount (Local Currency) | Description | Stated Rate | Stated Maturity | Value (US Dollars) | ||||
| CAPITAL PREFERRED SECURITIES – 7.4% | ||||||||
| Automotive – 1.2% | ||||||||
| 5,935,000 | General Motors Financial Co., Inc., Series A (USD) (c) | 5.75% | (i) | 5,052,288 | ||||
| Banking – 3.2% | ||||||||
| 2,940,000 | Bank of America Corp., Series DD (USD) (c) | 6.30% | (i) | 2,975,432 | ||||
| 3,000,000 | Barclays Bank PLC, 3 Mo. EUR LIBOR + 0.71% (EUR) (h) (j) | 3.67% | (i) | 2,750,342 | ||||
| 4,475,000 | Citigroup, Inc., Series M (USD) (c) | 6.30% | (i) | 4,238,049 | ||||
| 3,935,000 | Citigroup, Inc., Series V (USD) (a) (c) | 4.70% | (i) | 3,459,236 | ||||
| 13,423,059 | ||||||||
| Financial Services – 1.2% | ||||||||
| 3,175,000 | American AgCredit Corp., Series QIB (USD) (a) (b) (c) | 5.25% | (i) | 2,774,156 | ||||
| 3,210,000 | Textron Financial Corp., 3 Mo. LIBOR + 1.74% (USD) (a) (b) (j) | 6.60% | 02/15/42 | 2,327,250 | ||||
| 5,101,406 | ||||||||
| Utility – 1.8% | ||||||||
| 1,695,000 | Edison International, Series B (USD) (a) (c) | 5.00% | (i) | 1,453,150 | ||||
| 6,595,000 | Vistra Corp. (USD) (a) (b) (c) | 8.00% | (i) | 6,226,537 | ||||
| 7,679,687 | ||||||||
Total Capital Preferred Securities | 31,256,440 | |||||||
| (Cost $34,765,341) | ||||||||
| Principal Value | Description | Rate (k) | Stated Maturity (l) | Value | ||||
| SENIOR FLOATING-RATE LOAN INTERESTS – 2.1% | ||||||||
| Capital Goods – 0.6% | ||||||||
| $2,700,000 | ADS Tactical, Inc., Initial Term Loan, 1 Mo. LIBOR + 5.75%, 1.00% Floor | 10.78% | 03/19/26 | 2,566,687 | ||||
| Insurance – 0.2% | ||||||||
| 967,725 | HUB International Ltd., Term Loan B3, 3 Mo. LIBOR + 3.25%, 0.75% Floor | 8.51% | 04/25/25 | 967,285 | ||||
| Retail – 0.3% | ||||||||
| 1,071,370 | Michaels Cos (The), Inc., Term Loan B, 3 Mo. LIBOR + 4.25%, 0.75% Floor | 9.41% | 04/15/28 | 984,937 | ||||
| Services – 0.9% | ||||||||
| 5,800,000 | TruGreen L.P., Initial Term Loan (Second Lien), 1 Mo. LIBOR + 8.50%, 0.75% Floor (m) | 13.33% | 11/02/28 | 3,915,000 | ||||
| Principal Value | Description | Rate (k) | Stated Maturity (l) | Value | ||||
| SENIOR FLOATING-RATE LOAN INTERESTS (Continued) | ||||||||
| Technology & Electronics – 0.1% | ||||||||
| $600,000 | Dcert Buyer, Inc., First Amendment Refinancing Loan (Second Lien), 1 Mo. LIBOR + 7.00%, 0.00% Floor | 11.70% | 02/16/29 | $557,061 | ||||
Total Senior Floating-Rate Loan Interests | 8,990,970 | |||||||
| (Cost $10,937,966) | ||||||||
| Principal Value | Description | Stated Coupon | Stated Maturity | Value | ||||
| MORTGAGE-BACKED SECURITIES – 0.5% | ||||||||
| Collateralized Mortgage Obligations – 0.0% | ||||||||
| Washington Mutual Alternative Mortgage Pass-Through Certificates | ||||||||
| 10,950 | Series 2007-5, Class A11, 1 Mo. LIBOR x -6 + 39.48% (n) | 9.36% | 06/25/37 | 12,831 | ||||
| Commercial Mortgage-Backed Securities – 0.5% | ||||||||
| Securitized Asset Backed Receivables LLC Trust | ||||||||
| 6,353,955 | Series 2006-FR4, Class A2A, 1 Mo. LIBOR + 0.16% (j) | 5.18% | 08/25/36 | 2,042,456 | ||||
Total Mortgage-Backed Securities | 2,055,287 | |||||||
| (Cost $5,025,289) | ||||||||
| Shares | Description | Value | ||
| COMMON STOCKS – 0.1% | ||||
| Energy – 0.0% | ||||
| 7 | Thunderbird Resources Equity, Inc. (f) (g) (m) (o) | 35,290 | ||
| Utility – 0.1% | ||||
| 13,918 | Vistra Corp. | 332,083 | ||
Total Common Stocks | 367,373 | |||
| (Cost $960,424) | ||||
| RIGHTS – 0.0% | ||||
| Utility – 0.0% | ||||
| 13,918 | Vistra Corp., no expiration date (m) (o) | 16,006 | ||
| (Cost $22,917) | ||||
Total Investments – 134.4% | 569,311,433 | |||||||
| (Cost $613,869,095) | ||||||||
| Principal Value | Description | Stated Coupon | Stated Maturity | Value | ||||
| U.S. GOVERNMENT BONDS SOLD SHORT – (12.5)% | ||||||||
| $(30,000,000) | United States Treasury Note | 1.38% | 09/30/23 | (29,559,388) | ||||
| (24,000,000) | United States Treasury Note | 2.88% | 05/31/25 | (23,456,250) | ||||
Total U.S. Government Bonds Sold Short | (53,015,638) | |||||||
| (Proceeds $52,553,860) | ||||||||
| CORPORATE BONDS SOLD SHORT – (1.0)% | ||||||||
| Energy – (0.3)% | ||||||||
| (1,600,000) | Halliburton Co. | 2.92% | 03/01/30 | (1,434,365) | ||||
| Principal Value | Description | Stated Coupon | Stated Maturity | Value | ||||
| CORPORATE BONDS SOLD SHORT (Continued) | ||||||||
| Technology & Electronics – (0.7)% | ||||||||
| $(2,930,000) | Amkor Technology, Inc. (b) | 6.63% | 09/15/27 | $(2,937,346) | ||||
Total Corporate Bonds Sold Short | (4,371,711) | |||||||
| (Proceeds $4,479,457) | ||||||||
Total Investments Sold Short – (13.5)% | (57,387,349) | |||||||
| (Proceeds $57,033,317) | ||||||||
Outstanding Loan – (33.9)% |
(143,404,360) | ||
Net Other Assets and Liabilities – 13.0% |
55,063,887 | ||
Net Assets – 100.0% |
$423,583,611 |
| Forward Foreign Currency Contracts | ||||||||||||||
| Settlement Date | Counterparty | Amount Purchased | Amount Sold | Purchase Value as of 4/30/2023 | Sale Value as of 4/30/2023 | Unrealized Appreciation/ (Depreciation) | ||||||||
| 05/09/23 | JPM | USD | 7,676,684 | EUR | 7,012,000 | $ 7,676,684 | $ 7,731,890 | $ (55,206) | ||||||
| 05/09/23 | JPM | USD | 1,057,955 | GBP | 852,000 | 1,057,955 | 1,071,033 | (13,078) | ||||||
Net Unrealized Appreciation / (Depreciation) | $(68,284) | |||||||||||||
| Counterparty Abbreviations | |
| JPM | JPMorgan Chase |
| (a) | This security or a portion of this security is segregated as collateral for investments sold short and borrowings in the margin account (see Note 2F - Short Sales in the Notes to Financial Statements). At April 30, 2023, the segregated value of these securities amounts to $341,830,678. |
| (b) | This security, sold within the terms of a private placement memorandum, is exempt from registration upon resale under Rule 144A of the Securities Act of 1933, as amended (the “1933 Act”), and may be resold in transactions exempt from registration, normally to qualified institutional buyers. Pursuant to procedures adopted by the Fund Board of Trustees, this security has been determined to be liquid by MacKay Shields LLC, the Fund’s sub-advisor (the “Sub-Advisor”). Although market instability can result in periods of increased overall market illiquidity, liquidity for each security is determined based on security specific factors and assumptions, which require subjective judgment. At April 30, 2023, securities noted as such amounted to $397,287,854 of total investments and $(2,937,346) of total investments sold short, or 93.8% and (0.7)% of net assets, respectively. |
| (c) | Fixed-to-floating or fixed-to-variable rate security. The interest rate shown reflects the fixed rate in effect at April 30, 2023. At a predetermined date, the fixed rate will change to a floating rate or a variable rate. |
| (d) | Multi-Step Coupon Bond - Coupon steps up or down based upon ratings changes. The interest rate shown reflects the rate in effect at April 30, 2023. |
| (e) | Multi-Step Coupon Bond - Coupon steps up or down at a predetermined date. The interest rate shown reflects the rate in effect at April 30, 2023. |
| (f) | This security is fair valued by the Advisor’s Pricing Committee in accordance with procedures approved by the Fund’s Board of Trustees, and in accordance with the provisions of the Investment Company Act of 1940 and rules thereunder, as amended. At April 30, 2023, securities noted as such are valued at $75,056 or 0.0% of net assets. |
| (g) | This security’s value was determined using significant unobservable inputs (see Note 2A – Portfolio Valuation in the Notes to Financial Statements). |
| (h) | This security may be resold to qualified foreign investors and foreign institutional buyers under Regulation S of the 1933 Act. |
| (i) | Perpetual maturity. |
| (j) | Floating or variable rate security. |
| (k) | Senior Floating-Rate Loan Interests (“Senior Loans”) in which the Fund invests pay interest at rates which are periodically predetermined by reference to a base lending rate plus a premium. These base lending rates are generally (i) the lending rate offered by one or more major European banks, such as the LIBOR, (ii) the SOFR obtained from the U.S. Department of the Treasury’s Office of Financial Research, (iii) the prime rate offered by one or more United States banks or (iv) the certificate of deposit rate. Certain Senior Loans are subject to a LIBOR or SOFR floor that establishes a minimum LIBOR or SOFR rate. |
| (l) | Senior Loans generally are subject to mandatory and/or optional prepayment. As a result, the actual remaining maturity of Senior Loans may be substantially less than the stated maturities shown. |
| (m) | Pursuant to procedures adopted by the Fund’s Board of Trustees, this security has been determined to be illiquid by the Sub-Advisor. |
| (n) | Inverse floating rate security. |
| (o) | Non-income producing security. |
| EUR | Euro |
| GBP | British Pound Sterling |
| LIBOR | London Interbank Offered Rate |
| SOFR | Secured Overnight Financing Rate |
| USD | United States Dollar |
| ASSETS TABLE | ||||
| Total Value at 4/30/2023 | Level 1 Quoted Prices | Level 2 Significant Observable Inputs | Level 3 Significant Unobservable Inputs | |
| Corporate Bonds and Notes: | ||||
Transportation | $ 7,295,665 | $ — | $ 7,255,899 | $ 39,766 |
Other Industry Categories* | 418,939,979 | — | 418,939,979 | — |
Foreign Corporate Bonds and Notes* | 100,389,713 | — | 100,389,713 | — |
Capital Preferred Securities* | 31,256,440 | — | 31,256,440 | — |
Senior Floating-Rate Loan Interests* | 8,990,970 | — | 8,990,970 | — |
Mortgage-Backed Securities | 2,055,287 | — | 2,055,287 | — |
| Common Stocks: | ||||
Energy | 35,290 | — | — | 35,290 |
Utility | 332,083 | 332,083 | — | — |
Rights* | 16,006 | — | 16,006 | — |
Total Investments | $ 569,311,433 | $ 332,083 | $ 568,904,294 | $ 75,056 |
| LIABILITIES TABLE | ||||
| Total Value at 4/30/2023 | Level 1 Quoted Prices | Level 2 Significant Observable Inputs | Level 3 Significant Unobservable Inputs | |
U.S. Government Bonds Sold Short | $ (53,015,638) | $ — | $ (53,015,638) | $ — |
Corporate Bonds Sold Short* | (4,371,711) | — | (4,371,711) | — |
Total Investments | (57,387,349) | — | (57,387,349) | — |
Forward Foreign Currency Contracts | (68,284) | — | (68,284) | — |
Total | $ (57,455,633) | $— | $ (57,455,633) | $— |
| * | See Portfolio of Investments for industry breakout. |
| ASSETS: | |
Investments, at value (Cost $613,869,095) | $ 569,311,433 |
Cash | 46,709,562 |
Foreign currency (Cost $403,884) | 415,389 |
Interest receivable | 9,054,553 |
Margin interest rebate | 76,554 |
Prepaid expenses | 32,458 |
Total Assets | 625,599,949 |
| LIABILITIES: | |
Borrowings | 143,404,360 |
Investments sold short, at value (proceeds $57,033,317) | 57,387,349 |
Unrealized depreciation on forward foreign currency contracts | 68,284 |
| Payables: | |
Interest expense on investments sold short | 356,577 |
Investment advisory fees | 346,750 |
Margin interest expense | 341,470 |
Audit and tax fees | 41,454 |
Administrative fees | 37,925 |
Shareholder reporting fees | 15,420 |
Trustees’ fees and expenses | 6,104 |
Legal fees | 4,948 |
Custodian fees | 1,558 |
Transfer agent fees | 1,300 |
Financial reporting fees | 732 |
Other liabilities | 2,107 |
Total Liabilities | 202,016,338 |
NET ASSETS | $423,583,611 |
| NET ASSETS consist of: | |
Paid-in capital | $ 605,108,207 |
Par value | 332,910 |
Accumulated distributable earnings (loss) | (181,857,506) |
NET ASSETS | $423,583,611 |
NET ASSET VALUE, per Common Share (par value $0.01 per Common Share) | $12.72 |
Number of |
| INVESTMENT INCOME: | ||
Interest | $ 17,707,329 | |
Margin interest rebate | 1,121,096 | |
Dividends | 6,359 | |
Other | 4,245 | |
Total investment income | 18,839,029 | |
| EXPENSES: | ||
Margin interest expense | 5,135,724 | |
Investment advisory fees | 2,098,849 | |
Interest expense on investments sold short | 667,606 | |
Administrative fees | 122,784 | |
Shareholder reporting fees | 77,136 | |
Audit and tax fees | 33,923 | |
Legal fees | 33,144 | |
Listing expense | 20,352 | |
Transfer agent fees | 9,254 | |
Trustees’ fees and expenses | 9,189 | |
Financial reporting fees | 4,587 | |
Custodian fees | 2,085 | |
Other | 14,531 | |
Total expenses | 8,229,164 | |
NET INVESTMENT INCOME (LOSS) | 10,609,865 | |
| NET REALIZED AND UNREALIZED GAIN (LOSS): | ||
| Net realized gain (loss) on: | ||
Investments | (8,969,739) | |
Forward foreign currency contracts | (378,418) | |
Foreign currency transactions | 10,520 | |
Investments sold short | — | |
Net realized gain (loss) | (9,337,637) | |
| Net change in unrealized appreciation (depreciation) on: | ||
Investments | 23,832,893 | |
Forward foreign currency contracts | (140,959) | |
Foreign currency translation | 16,932 | |
Investments sold short | (937,179) | |
Net change in unrealized appreciation (depreciation) | 22,771,687 | |
NET REALIZED AND UNREALIZED GAIN (LOSS) | 13,434,050 | |
NET INCREASE (DECREASE) IN NET ASSETS RESULTING FROM OPERATIONS | $ 24,043,915 | |
| Six Months Ended 4/30/2023 (Unaudited) | Year Ended 10/31/2022 | ||
| OPERATIONS: | |||
Net investment income (loss) | $ 10,609,865 | $ 25,447,874 | |
Net realized gain (loss) | (9,337,637) | (16,108,257) | |
Net change in unrealized appreciation (depreciation) | 22,771,687 | (87,694,884) | |
Net increase (decrease) in net assets resulting from operations | 24,043,915 | (78,355,267) | |
| DISTRIBUTIONS TO SHAREHOLDERS FROM: | |||
Investment operations | (21,000,244) | (26,519,418) | |
Return of capital | — | (15,651,193) | |
Total distributions to shareholders | (21,000,244) | (42,170,611) | |
| CAPITAL TRANSACTIONS: | |||
Repurchase of Common Shares * | (1,433,499) | (549,030) | |
Net increase (decrease) in net assets resulting from capital transactions | (1,433,499) | (549,030) | |
Total increase (decrease) in net assets | 1,610,172 | (121,074,908) | |
| NET ASSETS: | |||
Beginning of period | 421,973,439 | 543,048,347 | |
End of period | $ 423,583,611 | $ 421,973,439 | |
| CAPITAL TRANSACTIONS were as follows: | |||
Common Shares at beginning of period | 33,419,132 | 33,470,143 | |
Common Shares repurchased * | (128,117) | (51,011) | |
Common Shares at end of period | 33,291,015 | 33,419,132 |
| * | On September 15, 2015, the Fund commenced a share repurchase program. For the six months ended April 30, 2023, the Fund repurchased 128,117 of its shares at a weighted-average discount of 12.32% from net asset value per share. For the year ended October 31, 2022, the Fund repurchased 51,011 of its shares at a weighted-average discount of 12.68% from net asset value per share. The Fund’s share repurchase program ended on March 15, 2023. |
| Cash flows from operating activities: | ||
Net increase (decrease) in net assets resulting from operations | $24,043,915 | |
| Adjustments to reconcile net increase (decrease) in net assets resulting from operations to net cash used in operating activities: | ||
Purchases of investments | (92,105,633) | |
Sales, maturities and paydown of investments | 64,721,192 | |
Net amortization/accretion of premiums/discounts on investments | (165,845) | |
Net realized gain/loss on investments | 8,969,739 | |
Net change in unrealized appreciation/depreciation on investments | (23,832,893) | |
Net change in unrealized appreciation/depreciation on forward foreign currency contracts | 140,959 | |
Net change in unrealized appreciation/depreciation on investments sold short | 937,179 | |
| Changes in assets and liabilities: | ||
Increase in interest receivable | (484,402) | |
Increase in margin interest rebate receivable | (27,183) | |
Decrease in due from broker | 104,785 | |
Increase in prepaid expenses | (17,734) | |
Decrease in interest payable on investments sold short | (4,061) | |
Decrease in investment advisory fees payable | (5,669) | |
Decrease in audit and tax fees payable | (35,202) | |
Increase in legal fees payable | 4,579 | |
Decrease in shareholder reporting fees payable | (17,386) | |
Increase in administrative fees payable | 3,569 | |
Increase in custodian fees payable | 172 | |
Decrease in transfer agent fees payable | (1,812) | |
Increase in trustees’ fees and expenses payable | 4,552 | |
Decrease in financial reporting fees payable | (39) | |
Increase in margin interest expense payable | 87,868 | |
Increase in other liabilities payable | 1,547 | |
Cash used in operating activities | $(17,677,803) | |
| Cash flows from financing activities: | ||
Repurchase of Common Shares | (1,433,499) | |
Distributions to Common Shareholders from investment operations | (21,000,244) | |
Net proceeds from borrowing | 671,667 | |
Cash used in financing activities | (21,762,076) | |
Decrease in cash and foreign currency (a) | (39,439,879) | |
Cash and foreign currency at beginning of period | 86,564,830 | |
Cash and foreign currency at end of period | $47,124,951 | |
| Supplemental disclosure of cash flow information: | ||
Cash paid during the period for interest and fees | $5,719,523 |
| (a) | Includes net change in unrealized appreciation (depreciation) on foreign currency of $16,932. |
| Six Months Ended 4/30/2023 (Unaudited) | Year Ended October 31, | |||||||||||
| 2022 | 2021 | 2020 | 2019 | 2018 | ||||||||
Net asset value, beginning of period | $ 12.63 | $ 16.22 | $ 15.66 | $ 16.94 | $ 16.57 | $ 18.23 | ||||||
| Income from investment operations: | ||||||||||||
Net investment income (loss) | 0.32 | 0.76 | 0.94 | 0.92 | 0.93 | 0.96 | ||||||
Net realized and unrealized gain (loss) | 0.39 | (3.09) | 0.93 | (0.92) | 0.68 | (1.32) | ||||||
Total from investment operations | 0.71 | (2.33) | 1.87 | — | 1.61 | (0.36) | ||||||
| Distributions paid to shareholders from: | ||||||||||||
Net investment income | (0.63) | (0.79) | (0.95) | (0.92) | (0.92) | (0.98) | ||||||
Return of capital | — | (0.47) | (0.37) | (0.40) | (0.36) | (0.37) | ||||||
Total distributions paid to Common Shareholders | (0.63) | (1.26) | (1.32) | (1.32) | (1.28) | (1.35) | ||||||
Common Share repurchases | 0.01 | 0.00 (a) | 0.01 | 0.04 | 0.04 | 0.05 | ||||||
Net asset value, end of period | $12.72 | $12.63 | $16.22 | $15.66 | $16.94 | $16.57 | ||||||
Market value, end of period | $11.40 | $11.06 | $16.05 | $13.49 | $15.49 | $13.91 | ||||||
Total return based on net asset value (b) | 6.38% | (14.11)% | 12.88% | 1.53% | 11.58% | (0.82)% | ||||||
Total return based on market value (b) | 8.87% | (23.99)% | 29.67% | (4.35)% | 21.54% | (10.24)% | ||||||
| Ratios to average net assets/supplemental data: | ||||||||||||
Net assets, end of period (in 000’s) | $ 423,584 | $ 421,973 | $ 543,048 | $ 526,815 | $ 582,502 | $ 578,360 | ||||||
Ratio of total expenses to average net assets | 3.92% (c) | 2.22% | 1.84% | 2.13% | 2.53% | 2.20% | ||||||
Ratio of total expenses to average net assets excluding interest expense | 1.16% (c) | 1.13% | 1.19% | 1.22% | 1.16% | 1.13% | ||||||
Ratio of net investment income (loss) to average net assets | 5.06% (c) | 5.34% | 5.74% | 5.80% | 5.55% | 5.48% | ||||||
Portfolio turnover rate | 9% | 32% | 43% | 63% | 33% | 29% | ||||||
| (a) | Amount is less than $0.01. |
| (b) | Total return is based on the combination of reinvested dividend, capital gain and return of capital distributions, if any, at prices obtained by the Dividend Reinvestment Plan, and changes in net asset value per share for net asset value returns and changes in Common Share Price for market value returns. Total returns do not reflect sales load and are not annualized for periods of less than one year. Past performance is not indicative of future results. |
| (c) | Annualized. |
| 1) | benchmark yields; |
| (1) | The terms “security” and “securities” used throughout the Notes to Financial Statements include Senior Loans. |
| 2) | reported trades; |
| 3) | broker/dealer quotes; |
| 4) | issuer spreads; |
| 5) | benchmark securities; |
| 6) | bids and offers; and |
| 7) | reference data including market research publications. |
| 1) | the credit conditions in the relevant market and changes thereto; |
| 2) | the liquidity conditions in the relevant market and changes thereto; |
| 3) | the interest rate conditions in the relevant market and changes thereto (such as significant changes in interest rates); |
| 4) | issuer-specific conditions (such as significant credit deterioration); and |
| 5) | any other market-based data the Advisor’s Pricing Committee considers relevant. In this regard, the Advisor’s Pricing Committee may use last-obtained market-based data to assist it when valuing portfolio securities using amortized cost. |
| 1) | the most recent price provided by a pricing service; |
| 2) | the fundamental business data relating to the borrower/issuer; |
| 3) | an evaluation of the forces which influence the market in which these securities are purchased and sold; |
| 4) | the type, size and cost of the security; |
| 5) | the financial statements of the borrower/issuer, or the financial condition of the country of issue; |
| 6) | the credit quality and cash flow of the borrower/issuer, or country of issue, based on the Pricing Committee’s, sub-advisor’s or portfolio manager’s analysis, as applicable, or external analysis; |
| 7) | the information as to any transactions in or offers for the security; |
| 8) | the price and extent of public trading in similar securities (or equity securities) of the borrower/issuer, or comparable companies; |
| 9) | the coupon payments; |
| 10) | the quality, value and salability of collateral, if any, securing the security; |
| 11) | the business prospects of the borrower/issuer, including any ability to obtain money or resources from a parent or affiliate and an assessment of the borrower’s/issuer’s management; |
| 12) | the prospects for the borrower’s/issuer’s industry, and multiples (of earnings and/or cash flows) being paid for similar businesses in that industry; |
| 13) | the borrower’s/issuer’s competitive position within the industry; |
| 14) | the borrower’s/issuer’s ability to access additional liquidity through public and/or private markets; and |
| 15) | other relevant factors. |
| • | Level 1 – Level 1 inputs are quoted prices in active markets for identical investments. An active market is a market in which transactions for the investment occur with sufficient frequency and volume to provide pricing information on an ongoing basis. |
| • | Level 2 – Level 2 inputs are observable inputs, either directly or indirectly, and include the following: |
| o | Quoted prices for similar investments in active markets. |
| o | Quoted prices for identical or similar investments in markets that are non-active. A non-active market is a market where there are few transactions for the investment, the prices are not current, or price quotations vary substantially either over time or among market makers, or in which little information is released publicly. |
| o | Inputs other than quoted prices that are observable for the investment (for example, interest rates and yield curves observable at commonly quoted intervals, volatilities, prepayment speeds, loss severities, credit risks, and default rates). |
| o | Inputs that are derived principally from or corroborated by observable market data by correlation or other means. |
| • | Level 3 – Level 3 inputs are unobservable inputs. Unobservable inputs may reflect the reporting entity’s own assumptions about the assumptions that market participants would use in pricing the investment. |
| Distributions paid from: | |
Ordinary income | $26,519,418 |
Capital gains | — |
Return of capital | 15,651,193 |
Undistributed ordinary income | $— |
Undistributed capital gains | — |
Total undistributed earnings | — |
Accumulated capital and other losses | (105,185,660) |
Net unrealized appreciation (depreciation) | (68,183,419) |
Total accumulated earnings (losses) | (173,369,079) |
Other | (11,532,098) |
Paid-in capital | 606,874,616 |
Total net assets | $421,973,439 |
| Tax Cost | Gross Unrealized Appreciation | Gross Unrealized (Depreciation) | Net Unrealized Appreciation (Depreciation) | |||
| $556,835,778 | $4,958,488 | $(49,938,466) | $(44,979,978) |
| Asset Derivatives | Liability Derivatives | |||||||||
| Derivative Instrument | Risk Exposure | Statement of Assets and Liabilities Location | Value | Statement of Assets and Liabilities Location | Value | |||||
| Forward foreign currency contracts | Currency Risk | Unrealized appreciation on forward foreign currency contracts | $ — | Unrealized depreciation on forward foreign currency contracts | $ 68,284 | |||||
| Statement of Operations Location | |
| Currency Risk Exposure | |
| Net realized gain (loss) on forward foreign currency contracts | $(378,418) |
| Net change in unrealized appreciation (depreciation) on forward foreign currency contracts | (140,959) |
| (1) | If Common Shares are trading at or above net asset value (“NAV”) at the time of valuation, the Fund will issue new shares at a price equal to the greater of (i) NAV per Common Share on that date or (ii) 95% of the market price on that date. |
| (2) | If Common Shares are trading below NAV at the time of valuation, the Plan Agent will receive the dividend or distribution in cash and will purchase Common Shares in the open market, on the NYSE or elsewhere, for the participants’ accounts. It is possible that the market price for the Common Shares may increase before the Plan Agent has completed its purchases. Therefore, the average purchase price per share paid by the Plan Agent may exceed the market price at the time of valuation, resulting in the purchase of fewer shares than if the dividend or distribution had been paid in Common Shares issued by the Fund. The Plan Agent will use all dividends and distributions received in cash to purchase Common Shares in the open market within 30 days of the valuation date except where temporary curtailment or suspension of purchases is necessary to comply with federal securities laws. Interest will not be paid on any uninvested cash payments. |
| • | Issuer Risk. The value of fixed-income securities may decline for a number of reasons which directly relate to the issuer, such as management performance, leverage and reduced demand for the issuer’s goods and services. In addition, an issuer of fixed-income securities may default on its obligation to pay interest and repay principal. |
| • | Prepayment Risk. Prepayment risk is the risk that the issuer of a debt security will repay principal prior to the scheduled maturity date. During periods of declining interest rates, the issuer of a security may exercise its option to prepay principal earlier than scheduled, forcing the Fund to reinvest the proceeds from such prepayment in lower yielding securities, which may result in a decline in the Fund’s income and distributions to common shareholders. |
| • | Reinvestment Risk. Reinvestment risk is the risk that income from the Fund’s portfolio will decline if the Fund invests the proceeds from matured, traded or called bonds at market interest rates that are below the Fund portfolio’s current earnings rate. |
| (b) | Not applicable. |
Item 2. Code of Ethics.
Not applicable.
Item 3. Audit Committee Financial Expert.
Not applicable.
Item 4. Principal Accountant Fees and Services.
Not applicable.
Item 5. Audit Committee of Listed Registrants.
Not applicable.
Item 6. Investments.
| (a) | Schedule of Investments in securities of unaffiliated issuers as of the close of the reporting period is included as part of the report to shareholders filed under Item 1 of this form. |
| (b) | Not applicable. |
Item 7. Disclosure of Proxy Voting Policies and Procedures for Closed-End Management Investment Companies.
Not applicable.
Item 8. Portfolio Managers of Closed-End Management Investment Companies.
| (a) | Not applicable. |
| (b) | Not applicable. |
Item 9. Purchases of Equity Securities by Closed-End Management Investment Company and Affiliated Purchasers.
| Period | (a) Total Number of Shares (or Units) Purchased | (b) Average Price Paid per Share (or Unit) | (c) Total Number of Shares (or Units) Purchased as Part of Publicly Announced Plans or Programs | (d) Maximum Number (or Approximate Dollar Value) of Shares (or Units) that May Yet Be Purchased Under the Plans or Programs |
|
Month #1 (11/01/2022-11/30/2022) |
0 | - | 2,989,956 | 1,673,507 |
| Month #2 (12/01/2022-12/31/2022) | 128,117 | 11.19 | 3,118,073 | 1,545,390 |
| Month #3 (1/01/2023-1/31/2023) | 0 | - | 3,118,073 | 1,545,390 |
|
Month #4 (2/01/2023-2/28/2023) |
0 | - | 3,118,073 | 1,545,390 |
|
Month #5 (3/01/2023-3/31/2023) |
0 | - | 3,118,073 | 0 |
| Month #6 (4/01/2023-4/30/2023) | 0 | - | 3,118,073 | 0 |
| Total | 128,117 | 11.19 | 3,118,073 | 0 |
On September 15, 2015, the Fund commenced a share repurchase program. For the six months ended April 30, 2023, the Fund repurchased 128,117 of its shares at a weighted-average discount of 12.32% from net asset value per share. For the year ended October 31, 2022, the Fund repurchased 51,011 of its shares at a weighted-average discount of 12.68% from net asset value per share. The Fund’s share repurchase program ended on March 15, 2023.
Item 10. Submission of Matters to a Vote of Security Holders.
There have been no material changes to the procedures by which the shareholders may recommend nominees to the registrant’s board of directors, where those changes were implemented after the registrant last provided disclosure in response to the requirements of Item 407(c)(2)(iv) of Regulation S-K (17 CFR 229.407) (as required by Item 22(b)(15) of Schedule 14A (17 CFR 240.14a-101)), or this Item.
Item 11. Controls and Procedures.
| (a) | The registrant’s principal executive and principal financial officers, or persons performing similar functions, have concluded that the registrant’s disclosure controls and procedures (as defined in Rule 30a-3(c) under the Investment Company Act of 1940, as amended (the “1940 Act”) (17 CFR 270.30a-3(c))) are effective, as of a date within 90 days of the filing date of the report that includes the disclosure required by this paragraph, based on their evaluation of these controls and procedures required by Rule 30a-3(b) under the 1940 Act (17 CFR 270.30a-3(b)) and Rules 13a-15(b) or 15d-15(b) under the Securities Exchange Act of 1934, as amended (17 CFR 240.13a-15(b) or 240.15d-15(b)). |
| (b) | There were no changes in the registrant’s internal control over financial reporting (as defined in Rule 30a-3(d) under the 1940 Act (17 CFR 270.30a-3(d)) that occurred during the period covered by this report that has materially affected, or is reasonably likely to materially affect, the registrant’s internal control over financial reporting. |
Item 12. Exhibits.
| (a) | Not applicable. |
| (b) | Not applicable |
Item 13. Exhibits.
| (a)(1) | Not applicable. |
| (a)(2) | Certifications pursuant to Rule 30a-2(a) under the 1940 Act and Section 302 of the Sarbanes-Oxley Act of 2002 are attached hereto. |
| (a)(3) | Not applicable. |
| (a)(4) | Not applicable. |
| (b) | Certifications pursuant to Rule 30a-2(b) under the 1940 Act and Section 906 of the Sarbanes-Oxley Act of 2002 are attached hereto. |
SIGNATURES
Pursuant to the requirements of the Securities Exchange Act of 1934 and the Investment Company Act of 1940, the registrant has duly caused this report to be signed on its behalf by the undersigned, thereunto duly authorized.
| (registrant) | First Trust High Income Long/Short Fund |
| By (Signature and Title)* | /s/ James M. Dykas | |
| James M. Dykas, President and Chief Executive Officer (principal executive officer) |
| Date: | July 3, 2023 |
Pursuant to the requirements of the Securities Exchange Act of 1934 and the Investment Company Act of 1940, this report has been signed below by the following persons on behalf of the registrant and in the capacities and on the dates indicated.
| By (Signature and Title)* | /s/ James M. Dykas | |
| James M. Dykas, President and Chief Executive Officer (principal executive officer) |
| Date: | July 3, 2023 |
| By (Signature and Title)* | /s/ Donald P. Swade | |
| Donald P. Swade, Treasurer, Chief Financial Officer and Chief Accounting Officer (principal financial officer) |
| Date: | July 3, 2023 |
* Print the name and title of each signing officer under his or her signature.
Certification Pursuant to Rule 30a-2(a) under
the 1940 Act and Section 302
of the Sarbanes-Oxley Act
I, James M. Dykas, certify that:
| 1. | I have reviewed this report on Form N-CSR of First Trust High Income Long/Short Fund; |
| 2. | Based on my knowledge, this report does not contain any untrue statement of a material fact or omit to state a material fact necessary to make the statements made, in light of the circumstances under which such statements were made, not misleading with respect to the period covered by this report; |
| 3. | Based on my knowledge, the financial statements, and other financial information included in this report, fairly present in all material respects the financial condition, results of operations, changes in net assets, and cash flows (if the financial statements are required to include a statement of cash flows) of the registrant as of, and for, the periods presented in this report; |
| 4. | The registrant’s other certifying officer(s) and I are responsible for establishing and maintaining disclosure controls and procedures (as defined in Rule 30a-3(c) under the Investment Company Act of 1940) and internal control over financial reporting (as defined in Rule 30a-3(d) under the Investment Company Act of 1940) for the registrant and have: |
| (a) | Designed such disclosure controls and procedures, or caused such disclosure controls and procedures to be designed under our supervision, to ensure that material information relating to the registrant, including its consolidated subsidiaries, is made known to us by others within those entities, particularly during the period in which this report is being prepared; |
| (b) | Designed such internal control over financial reporting, or caused such internal control over financial reporting to be designed under our supervision, to provide reasonable assurance regarding the reliability of financial reporting and the preparation of financial statements for external purposes in accordance with generally accepted accounting principles; |
| (c) | Evaluated the effectiveness of the registrant’s disclosure controls and procedures and presented in this report our conclusions about the effectiveness of the disclosure controls and procedures, as of a date within 90 days prior to the filing date of this report based on such evaluation; and |
| (d) | Disclosed in this report any change in the registrant’s internal control over financial reporting that occurred during the period covered by this report that has materially affected, or is reasonably likely to materially affect, the registrant’s internal control over financial reporting; and |
| 5. | The registrant’s other certifying officer(s) and I have disclosed to the registrant’s auditors and the audit committee of the registrant’s board of directors (or persons performing the equivalent functions): |
| (a) | All significant deficiencies and material weaknesses in the design or operation of internal control over financial reporting which are reasonably likely to adversely affect the registrant’s ability to record, process, summarize, and report financial information; and |
| (b) | Any fraud, whether or not material, that involves management or other employees who have a significant role in the registrant’s internal control over financial reporting. |
| Date: | July 3, 2023 | /s/ James M. Dykas | |||
| James M. Dykas, President and Chief Executive Officer (principal executive officer) |
Certification Pursuant to Rule 30a-2(a)
under the 1940 Act and Section 302
of the Sarbanes-Oxley Act
I, Donald P. Swade, certify that:
| 1. | I have reviewed this report on Form N-CSR of First Trust High Income Long/Short Fund; |
| 2. | Based on my knowledge, this report does not contain any untrue statement of a material fact or omit to state a material fact necessary to make the statements made, in light of the circumstances under which such statements were made, not misleading with respect to the period covered by this report; |
| 3. | Based on my knowledge, the financial statements, and other financial information included in this report, fairly present in all material respects the financial condition, results of operations, changes in net assets, and cash flows (if the financial statements are required to include a statement of cash flows) of the registrant as of, and for, the periods presented in this report; |
| 4. | The registrant’s other certifying officer(s) and I are responsible for establishing and maintaining disclosure controls and procedures (as defined in Rule 30a-3(c) under the Investment Company Act of 1940) and internal control over financial reporting (as defined in Rule 30a-3(d) under the Investment Company Act of 1940) for the registrant and have: |
| (a) | Designed such disclosure controls and procedures, or caused such disclosure controls and procedures to be designed under our supervision, to ensure that material information relating to the registrant, including its consolidated subsidiaries, is made known to us by others within those entities, particularly during the period in which this report is being prepared; |
| (b) | Designed such internal control over financial reporting, or caused such internal control over financial reporting to be designed under our supervision, to provide reasonable assurance regarding the reliability of financial reporting and the preparation of financial statements for external purposes in accordance with generally accepted accounting principles; |
| (c) | Evaluated the effectiveness of the registrant’s disclosure controls and procedures and presented in this report our conclusions about the effectiveness of the disclosure controls and procedures, as of a date within 90 days prior to the filing date of this report based on such evaluation; and |
| (d) | Disclosed in this report any change in the registrant’s internal control over financial reporting that occurred during the period covered by this report that has materially affected, or is reasonably likely to materially affect, the registrant’s internal control over financial reporting; and |
| 5. | The registrant’s other certifying officer(s) and I have disclosed to the registrant’s auditors and the audit committee of the registrant’s board of directors (or persons performing the equivalent functions): |
| (a) | All significant deficiencies and material weaknesses in the design or operation of internal control over financial reporting which are reasonably likely to adversely affect the registrant’s ability to record, process, summarize, and report financial information; and |
| (b) | Any fraud, whether or not material, that involves management or other employees who have a significant role in the registrant’s internal control over financial reporting. |
| Date: | July 3, 2023 | /s/ Donald P. Swade | |||
| Donald P. Swade, Treasurer, Chief Financial Officer and Chief Accounting Officer (principal financial officer) |
Certification Pursuant to Rule 30a-2(b) under the
1940 Act and Section 906
of the Sarbanes-Oxley Act
I, James M. Dykas, Chairman of the Board, President and Chief Executive Officer of First Trust High Income Long/Short Fund (the “Registrant”), certify that:
| 1. | The Form N-CSR of the Registrant (the “Report”) fully complies with the requirements of Section 13(a) or 15(d) of the Securities Exchange Act of 1934, as amended; and |
| 2. | The information contained in the Report fairly presents, in all material respects, the financial condition and results of operations of the Registrant. |
| Date: | July 3, 2023 | /s/ James M. Dykas | |||
| James M. Dykas, President and Chief Executive Officer (principal executive officer) |
I, Donald P. Swade, Treasurer, Chief Financial Officer and Chief Accounting Officer of First Trust High Income Long/Short Fund (the “Registrant”), certify that:
| 1. | The Form N-CSR of the Registrant (the “Report”) fully complies with the requirements of Section 13(a) or 15(d) of the Securities Exchange Act of 1934, as amended; and |
| 2. | The information contained in the Report fairly presents, in all material respects, the financial condition and results of operations of the Registrant. |
| Date: | July 3, 2023 | /s/ Donald P. Swade | |||
| Donald P. Swade, Treasurer, Chief Financial Officer and Chief Accounting Officer (principal financial officer) |
N-2 |
6 Months Ended | ||||||
|---|---|---|---|---|---|---|---|
|
Apr. 30, 2023
shares
| |||||||
| Cover [Abstract] | |||||||
| Entity Central Index Key | 0001494530 | ||||||
| Amendment Flag | false | ||||||
| Entity Inv Company Type | N-2 | ||||||
| Document Type | N-CSRS | ||||||
| Entity Registrant Name | First Trust High Income Long/Short Fund | ||||||
| General Description of Registrant [Abstract] | |||||||
| Risk Factors [Table Text Block] | Principal Risks
The Fund is a closed-end
management investment company designed primarily as a long-term investment and not as a trading vehicle. The Fund is not intended to be a complete investment program and, due to the uncertainty inherent in all
investments, there can be no assurance that the Fund will achieve its investment objectives. The following discussion summarizes the principal risks associated with investing in the Fund, which includes the risk that
you could lose some or all of your investment in the Fund. The Fund is subject to the informational requirements of the Securities Exchange Act of 1934 and the Investment Company Act of 1940 and, in accordance
therewith, files reports, proxy statements and other information that is available for review. The order of the below risk factors does not indicate the significance of any particular risk factor.
Credit Agency Risk. Credit ratings are determined by credit rating agencies and are only the opinions of such entities. Ratings assigned by a rating agency are not absolute standards of credit quality and do
not evaluate market risk or the liquidity of securities. Any shortcomings or inefficiencies in credit rating agencies’ processes for determining credit ratings may adversely affect the credit ratings of
securities held by the Fund or such credit rating agency’s ability to evaluate creditworthiness and, as a result, may adversely affect those securities’ perceived or actual credit risk.
Credit and Below-Investment
Grade Securities Risk. Credit risk is the risk that the issuer or other obligated party of a debt security in the Fund’s portfolio will fail to pay dividends and/or interest or repay principal when due.
Below-investment grade instruments including instruments that are not rated but judged to be of comparable quality, are commonly referred to as high-yield securities or “junk” bonds and are
considered speculative with respect to the issuer’s capacity to pay dividends or interest and repay principal and are susceptible to default or decline in market value due to adverse economic and business
developments. High-yield securities are often unsecured and subordinated to other creditors of the issuer. The market values for high-yield securities tend to be very volatile, and these securities are generally less
liquid than investment grade securities. For these reasons, an investment in the Fund is subject to the following specific risks: (i) increased price sensitivity to changing interest rates and to a deteriorating
economic environment; (ii) greater risk of loss due to default or declining credit quality; (iii) adverse company specific events more likely to render the issuer unable to make dividend, interest and/or principal
payments; (iv) negative perception of the high-yield market which may depress the price and liquidity of high-yield securities; (v) volatility; and (vi) liquidity.
Currency Risk. The value of securities denominated or quoted in foreign currencies may be adversely affected by fluctuations in the relative currency exchange rates and by exchange control regulations.
The Fund’s investment performance may be negatively affected by a devaluation of a currency in which the Fund’s investments are denominated or quoted. Further, the Fund’s investment performance may
be significantly affected, either positively or negatively, by currency exchange rates because the U.S. dollar value of securities denominated or quoted in another currency will increase or decrease in response to
changes in the value of such currency in relation to the U.S. dollar.
Cyber Security Risk. The Fund is susceptible to potential operational risks through breaches in cyber security. A breach in cyber security refers to both intentional and unintentional events that may cause the
Fund to lose proprietary information, suffer data corruption or lose operational capacity. Such events could cause the Fund to incur regulatory penalties, reputational damage, additional compliance costs associated
with corrective measures and/or financial loss. Cyber security breaches may involve unauthorized access to the Fund’s digital information systems through “hacking” or malicious software coding, but
may also result from outside attacks such as denial-of-service attacks through efforts to make network services unavailable to intended users. In addition, cyber security breaches of the Fund’s third-party
service providers, such as its administrator, transfer agent, custodian, or Sub-Advisor, as applicable, or issuers in which the Fund invests, can also subject the Fund to many of the same risks associated with direct
cyber security breaches. The Fund has established risk management systems designed to reduce the risks associated with cyber security. However, there is no guarantee that such efforts will succeed, especially because
the Fund does not directly control the cyber
security systems of issuers or third
party service providers. Substantial costs may be incurred by the Fund in order to resolve or prevent cyber incidents in the future.
Distressed Securities
Risk. Distressed securities frequently do not produce income while they are outstanding. The Fund may be required to incur certain extraordinary expenses in order to protect and recover its
investment. The Fund also will be subject to significant uncertainty as to when and in what manner and for what value the obligations evidenced by the distressed securities will eventually be satisfied. Distressed
securities might be repaid only after lengthy workout, bankruptcy or similar proceedings, during which the issuer may not make any interest or other payments. Because there typically is substantial uncertainty
regarding the outcome of such proceedings, there is a high risk of loss, including loss of the entire investment.
Fixed-Income
Securities Risk. An investment in fixed-income securities is subject to certain risks, including:
Forward Foreign Currency
Exchange Contracts Risk. Forward foreign currency exchange contracts involve certain risks, including the risk of failure of the counterparty to perform its obligations under the contract and the risk that the use
of forward contracts may not serve as a complete hedge because of an imperfect correlation between movements in the prices of the contracts and the prices of the currencies hedged. While forward foreign currency
exchange contracts may limit the risk of loss due to a decline in the value of the hedged currencies, they also may limit any potential gain that might result should the value of the currencies increase. In addition,
because forward currency exchange contracts are privately negotiated transactions, there can be no assurance that the Fund will have flexibility to roll-over a forward currency exchange contract upon its expiration if
it desires to do so. Hedging against a decline in the value of a currency does not eliminate fluctuations in the value of a portfolio security traded in that currency or prevent a loss if the value of the security
declines. Moreover, it may not be possible for the Fund to hedge against a devaluation that is so generally anticipated that the Fund is not able to contract to sell the currency at a price above the devaluation level
it anticipates. The cost to the Fund of engaging in currency exchange transactions varies with such factors as the currency involved, the length of the contract period and prevailing market conditions.
Illiquid and Restricted
Securities Risk. The Fund may invest in securities that are restricted and/or illiquid. Restricted securities are securities that cannot be offered for public resale unless registered under the applicable
securities laws or that have a contractual restriction that prohibits or limits their resale. Restricted securities may be illiquid as they generally are not listed on an exchange and may have no active trading
market. Investments in restricted securities could have the effect of increasing the amount of the Fund’s assets invested in illiquid securities if qualified institutional buyers are unwilling to purchase these
securities. Illiquid and restricted securities may be difficult to dispose of at a fair price at the times when the Fund believes it is desirable to do so. The market price of illiquid and restricted securities
generally is more volatile than that of more liquid securities, which may adversely affect the price that the Fund pays for or recovers upon the sale of such securities. Illiquid and restricted securities are also
more difficult to value, especially in challenging markets.
Inflation Risk. The Fund invests in securities that are subject to inflation risk. Inflation risk is the risk that the value of assets or income from investments will be worth less in the future as
inflation decreases the value of money. As inflation increases, the present value of the Fund’s assets and distributions may decline. This risk is more prevalent with respect to debt securities. Inflation
creates uncertainty over the future real value (after inflation) of an investment. Inflation rates may change frequently and drastically as a result of various factors, including unexpected shifts in the domestic or
global economy, and the Fund’s investments may not keep pace with inflation, which may result in losses to Fund investors.
Interest Rate Risk. Interest rate risk is the risk that securities will decline in value because of changes in market interest rates. For fixed rate securities, when market interest rates rise,
the market value of such securities generally will fall. Investments in fixed rate securities with long-term maturities may experience significant price declines if long-term interest rates increase.
During periods of rising interest rates, the average life of certain types of securities may be extended because of slower than expected prepayments. This may lock in a below-market yield, increase the
security’s duration and further reduce the value of the security. Fixed rate securities
with longer durations tend to be more
sensitive to changes in interest rates, usually making them more volatile than securities with shorter durations. The duration of a security will be expected to change over time with changes in market factors
and time to maturity.
The interest rates
payable on floating rate securities are not fixed and may fluctuate based upon changes in market rates. As short-term interest rates decline, interest payable on floating rate securities typically decreases.
Alternatively, during periods of rising interest rates, interest payable on floating rate securities typically increases. Changes in interest rates on floating rate securities may lag behind changes in
market rates or may have limits on the maximum increases in interest rates. The value of floating rate securities may decline if their interest rates do not rise as much, or as quickly, as interest rates in
general.
Many financial
instruments use or may use a floating rate based upon the LIBOR. The United Kingdom’s Financial Conduct Authority (the “FCA”), which regulates LIBOR, intends to cease making LIBOR available as
a reference rate over a phase-out period that began in early 2022. However, subsequent announcements by the FCA, the LIBOR administrators, and other regulators indicate that it is possible that the most widely used
LIBOR rates may continue until mid-2023. The unavailability or replacement of LIBOR may affect the value, liquidity or return on certain Fund investments and may result in costs incurred in connection with
closing out positions and entering into new trades. Any potential effects of the transition away from LIBOR on the Fund or on certain instruments in which the Fund invests can be difficult to ascertain, and they may
vary depending on a variety of factors. In the United States, it is anticipated that in many instances the Secured Overnight Financing Rate (“SOFR”) will replace LIBOR as the reference rate for many
floating rate instruments. There is no assurance that the composition or characteristics of SOFR, or any alternative reference rate, will be similar to or produce the same value or economic equivalence as LIBOR or
that instruments using an alternative rate will have the same volume or liquidity. As a result, the transition process might lead to increased volatility and reduced liquidity in markets that currently rely on LIBOR
to determine interest rates; a reduction in the value of some LIBOR-based investments; increased difficulty in borrowing or refinancing and diminished effectiveness of any applicable hedging strategies against
instruments whose terms currently include LIBOR; and/ or costs incurred in connection with temporary borrowings and closing out positions and entering into new agreements. Any such effects (as well as other
unforeseen effects) of the transition away from LIBOR and the adoption of alternative reference rates could result in losses to the Fund.
Leverage Risk. The use of leverage by the Fund can magnify the effect of any losses. If the income and gains from the securities and investments purchased with leverage proceeds do not cover the cost of
leverage, the return to the common shares will be less than if leverage had not been used. Leverage involves risks and special considerations for common shareholders including: (i) the likelihood of greater volatility
of net asset value and market price of the common shares than a comparable portfolio without leverage; (ii) the risk that fluctuations in interest rates on borrowings will reduce the return to the common shareholders
or will result in fluctuations in the dividends paid on the common shares; (iii) in a declining market, the use of leverage is likely to cause a greater decline in the net asset value of the common shares than if the
Fund were not leveraged, which may result in a greater decline in the market price of the common shares; and (iv) when the Fund uses certain types of leverage, the investment advisory fee payable to the Advisor and by
the Advisor to the Sub-Advisor will be higher than if the Fund did not use leverage.
Management Risk and
Reliance on Key Personnel. The implementation of the Fund’s investment strategy depends upon the continued contributions of certain key employees of the Advisor and Sub-Advisor, some of whom have unique
talents and experience and would be difficult to replace. The loss or interruption of the services of a key member of the portfolio management team could have a negative impact on the Fund.
Market Discount from Net
Asset Value. Shares of closed-end investment companies such as the Fund frequently trade at a discount from their net asset value. The Fund cannot predict whether its common shares will trade at, below
or above net asset value.
Market Risk. Securities held by the Fund, as well as shares of the Fund itself, are subject to market fluctuations caused by factors such as general economic conditions, political events,
regulatory or market developments, changes in interest rates and perceived trends in securities prices. Shares of the Fund could decline in value or underperform other investments as a result of the risk of loss
associated with these market fluctuations. In addition, local, regional or global events such as war, acts of terrorism, spread of infectious diseases or other public health issues, recessions, or other events could
have a significant negative impact on the Fund and its investments. For example, the coronavirus (COVID-19) global pandemic and the aggressive responses taken by many governments, including closing borders,
restricting international and domestic travel, and the imposition of prolonged quarantines or similar restrictions, had negative impacts, and in many cases severe impacts, on markets worldwide. While the development
of vaccines has slowed the spread of the virus and allowed for the resumption of reasonably normal business activity in the United States, many countries continue to impose lockdown measures in an attempt to slow the
spread. Additionally, there is no guarantee that vaccines will be effective against emerging variants of the disease. Also, in February 2022, Russia invaded Ukraine which has caused and could continue to cause
significant market disruptions and volatility across markets globally, including the United States. The hostilities and sanctions resulting from those hostilities could have a significant impact on certain Fund
investments as well as Fund performance. As the global pandemic and conflict in Ukraine have illustrated, such events may affect certain geographic regions, countries, sectors and industries more significantly than
others. Recent and potential future bank failures could result in disruption to the broader banking
industry or markets generally and reduce
confidence in financial institutions and the economy as a whole, which may also heighten market volatility and reduce liquidity. These events also may adversely affect the prices and liquidity of the Fund’s
portfolio securities or other instruments and could result in disruptions in the trading markets. Any of such circumstances could have a materially negative impact on the value of the Fund’s shares and result in
increased market volatility. During any such events, the Fund’s shares may trade at increased premiums or discounts to their net asset value and the bid/ask spread on the Fund’s shares may widen.
Non-U.S. Securities
Risk. Investing in securities of non-U.S. issuers, which are generally denominated in non-U.S. currencies, may involve certain risks not typically associated with investing in securities of U.S.
issuers. These risks include: (i) there may be less publicly available information about non-U.S. issuers or markets due to less rigorous disclosure or accounting standards or regulatory practices; (ii) non-U.S.
markets may be smaller, less liquid and more volatile than the U.S. market; (iii) potential adverse effects of fluctuations in currency exchange rates or controls on the value of the Fund’s investments; (iv) the
economies of non-U.S. countries may grow at slower rates than expected or may experience a downturn or recession; (v) the impact of economic, political, social or diplomatic events; (vi) certain non-U.S. countries may
impose restrictions on the ability of non-U.S. issuers to make payments of principal and interest to investors located in the United States due to blockage of non-U.S. currency exchanges or otherwise; and (vii)
withholding and other non-U.S. taxes may decrease the Fund’s return. Foreign companies are generally not subject to the same accounting, auditing and financial reporting standards as are U.S. companies. In
addition, there may be difficulty in obtaining or enforcing a court judgment abroad, including in the event the issuer of a non-U.S. security defaults or enters bankruptcy, administration or other proceedings. These
risks may be more pronounced to the extent that the Fund invests a significant amount of its assets in companies located in one region or in emerging markets.
Operational Risk. The Fund is subject to risks arising from various operational factors, including, but not limited to, human error, processing and communication errors, errors of the Fund’s service
providers, counterparties or other third-parties, failed or inadequate processes and technology or systems failures. The Fund relies on third-parties for a range of services, including custody. Any delay or failure
relating to engaging or maintaining such service providers may affect the Fund’s ability to meet its investment objective. Although the Fund and the Advisor seek to reduce these operational risks through
controls and procedures, there is no way to completely protect against such risks.
Potential Conflicts of
Interest Risk. First Trust, MacKay and the portfolio managers have interests which may conflict with the interests of the Fund. In particular, First Trust and MacKay currently manage and may in the
future manage and/or advise other investment funds or accounts with the same or substantially similar investment objective and strategies as the Fund. In addition, while the Fund is using certain types of leverage,
the amount of the fees paid to First Trust (and by First Trust to MacKay) for investment advisory and management services are higher than if the Fund did not use leverage because the fees paid are calculated based on
managed assets. Therefore, First Trust and MacKay could have a financial incentive to leverage the Fund.
Preferred Securities
Risk. Preferred securities combine some of the characteristics of both common stocks and bonds. Preferred securities are typically subordinated to bonds and other debt securities in a
company’s capital structure in terms of priority to corporate income, subjecting them to greater credit risk than those debt securities. Generally, holders of preferred securities have no voting rights with
respect to the issuing company unless preferred dividends have been in arrears for a specified number of periods, at which time the preferred security holders may obtain limited rights. In certain circumstances, an
issuer of preferred securities may defer payment on the securities and, in some cases, redeem the securities prior to a specified date. Preferred securities may also be substantially less liquid than other securities,
including common stock.
Short Selling Risk. The Fund engages in short selling. Short sales are transactions in which the Fund sells a security that it does not own but can borrow in the market and allows the Fund to profit from
a decline in the market price (to the extent such decline exceeds the transaction costs and the costs of borrowing the securities). If a security sold short increases in price, the Fund may have to cover its short
position at a higher price than the short sale price, resulting in a loss. Because losses on short sales arise from increases in the value of the security sold short, such losses are theoretically unlimited. It is
possible that the Fund’s long securities positions will decline in value at the same time that the value of its short securities positions increase, thereby increasing potential losses to the Fund. In addition,
the Fund’s short selling strategies will limit its ability to fully benefit from increases in the fixed-income markets.
The Fund may not be able
to borrow a security that it needs to deliver or it may not be able to close out a short position at an acceptable price and may have to sell related long positions before it had intended to do so. Thus, the Fund may
not be able to successfully implement its short sale strategy due to limited availability of desired securities or for other reasons. Also, there is the risk that the counterparty to a short sale may fail to honor its
contractual terms, causing a loss to the Fund. Further, when the Fund is selling a security short, it must maintain a segregated account of cash or high-grade securities equal to the margin requirement. As a
result, the Fund may maintain high levels of cash or other liquid assets, which may limit the Fund’s ability to pursue other opportunities.
Valuation Risk. Unlike publicly traded common stock which trades on national exchanges, there is no central place or exchange for fixed-income securities trading. Fixed-income securities generally trade
on an “over-the-counter” market which may be anywhere in the world where the buyer and seller can settle on a price. Due to the lack of centralized information and trading, the valuation of fixed-income
securities may carry more risk than that of common stock. Uncertainties in the conditions of the financial market, unreliable reference data, lack of transparency and inconsistency of valuation models and processes
may lead to inaccurate asset pricing.
|
||||||
| Capital Stock, Long-Term Debt, and Other Securities [Abstract] | |||||||
| Outstanding Security, Title [Text Block] | Common Shares | ||||||
| Outstanding Security, Held [Shares] | 33,291,015 | ||||||
| Credit Agency Risk [Member] | |||||||
| General Description of Registrant [Abstract] | |||||||
| Risk [Text Block] | Credit Agency Risk. Credit ratings are determined by credit rating agencies and are only the opinions of such entities. Ratings assigned by a rating agency are not absolute standards of credit quality and do
not evaluate market risk or the liquidity of securities. Any shortcomings or inefficiencies in credit rating agencies’ processes for determining credit ratings may adversely affect the credit ratings of
securities held by the Fund or such credit rating agency’s ability to evaluate creditworthiness and, as a result, may adversely affect those securities’ perceived or actual credit risk.
|
||||||
| Credit And Below Investment Grade Securities Risk [Member] | |||||||
| General Description of Registrant [Abstract] | |||||||
| Risk [Text Block] | Credit and Below-Investment
Grade Securities Risk. Credit risk is the risk that the issuer or other obligated party of a debt security in the Fund’s portfolio will fail to pay dividends and/or interest or repay principal when due.
Below-investment grade instruments including instruments that are not rated but judged to be of comparable quality, are commonly referred to as high-yield securities or “junk” bonds and are
considered speculative with respect to the issuer’s capacity to pay dividends or interest and repay principal and are susceptible to default or decline in market value due to adverse economic and business
developments. High-yield securities are often unsecured and subordinated to other creditors of the issuer. The market values for high-yield securities tend to be very volatile, and these securities are generally less
liquid than investment grade securities. For these reasons, an investment in the Fund is subject to the following specific risks: (i) increased price sensitivity to changing interest rates and to a deteriorating
economic environment; (ii) greater risk of loss due to default or declining credit quality; (iii) adverse company specific events more likely to render the issuer unable to make dividend, interest and/or principal
payments; (iv) negative perception of the high-yield market which may depress the price and liquidity of high-yield securities; (v) volatility; and (vi) liquidity.
|
||||||
| Currency Risk [Member] | |||||||
| General Description of Registrant [Abstract] | |||||||
| Risk [Text Block] | Currency Risk. The value of securities denominated or quoted in foreign currencies may be adversely affected by fluctuations in the relative currency exchange rates and by exchange control regulations.
The Fund’s investment performance may be negatively affected by a devaluation of a currency in which the Fund’s investments are denominated or quoted. Further, the Fund’s investment performance may
be significantly affected, either positively or negatively, by currency exchange rates because the U.S. dollar value of securities denominated or quoted in another currency will increase or decrease in response to
changes in the value of such currency in relation to the U.S. dollar.
|
||||||
| Cyber Security Risk [Member] | |||||||
| General Description of Registrant [Abstract] | |||||||
| Risk [Text Block] | Cyber Security Risk. The Fund is susceptible to potential operational risks through breaches in cyber security. A breach in cyber security refers to both intentional and unintentional events that may cause the
Fund to lose proprietary information, suffer data corruption or lose operational capacity. Such events could cause the Fund to incur regulatory penalties, reputational damage, additional compliance costs associated
with corrective measures and/or financial loss. Cyber security breaches may involve unauthorized access to the Fund’s digital information systems through “hacking” or malicious software coding, but
may also result from outside attacks such as denial-of-service attacks through efforts to make network services unavailable to intended users. In addition, cyber security breaches of the Fund’s third-party
service providers, such as its administrator, transfer agent, custodian, or Sub-Advisor, as applicable, or issuers in which the Fund invests, can also subject the Fund to many of the same risks associated with direct
cyber security breaches. The Fund has established risk management systems designed to reduce the risks associated with cyber security. However, there is no guarantee that such efforts will succeed, especially because
the Fund does not directly control the cyber
security systems of issuers or third
party service providers. Substantial costs may be incurred by the Fund in order to resolve or prevent cyber incidents in the future.
|
||||||
| Distressed Securities Risk [Member] | |||||||
| General Description of Registrant [Abstract] | |||||||
| Risk [Text Block] | Distressed Securities
Risk. Distressed securities frequently do not produce income while they are outstanding. The Fund may be required to incur certain extraordinary expenses in order to protect and recover its
investment. The Fund also will be subject to significant uncertainty as to when and in what manner and for what value the obligations evidenced by the distressed securities will eventually be satisfied. Distressed
securities might be repaid only after lengthy workout, bankruptcy or similar proceedings, during which the issuer may not make any interest or other payments. Because there typically is substantial uncertainty
regarding the outcome of such proceedings, there is a high risk of loss, including loss of the entire investment.
|
||||||
| Fixed Income Securities Risk [Member] | |||||||
| General Description of Registrant [Abstract] | |||||||
| Risk [Text Block] | Fixed-Income
Securities Risk. An investment in fixed-income securities is subject to certain risks, including:
|
||||||
| Forward Foreign Currency Exchange Contracts Risk [Member] | |||||||
| General Description of Registrant [Abstract] | |||||||
| Risk [Text Block] | Forward Foreign Currency
Exchange Contracts Risk. Forward foreign currency exchange contracts involve certain risks, including the risk of failure of the counterparty to perform its obligations under the contract and the risk that the use
of forward contracts may not serve as a complete hedge because of an imperfect correlation between movements in the prices of the contracts and the prices of the currencies hedged. While forward foreign currency
exchange contracts may limit the risk of loss due to a decline in the value of the hedged currencies, they also may limit any potential gain that might result should the value of the currencies increase. In addition,
because forward currency exchange contracts are privately negotiated transactions, there can be no assurance that the Fund will have flexibility to roll-over a forward currency exchange contract upon its expiration if
it desires to do so. Hedging against a decline in the value of a currency does not eliminate fluctuations in the value of a portfolio security traded in that currency or prevent a loss if the value of the security
declines. Moreover, it may not be possible for the Fund to hedge against a devaluation that is so generally anticipated that the Fund is not able to contract to sell the currency at a price above the devaluation level
it anticipates. The cost to the Fund of engaging in currency exchange transactions varies with such factors as the currency involved, the length of the contract period and prevailing market conditions.
|
||||||
| Illiquid And Restricted Securities Risk [Member] | |||||||
| General Description of Registrant [Abstract] | |||||||
| Risk [Text Block] | Illiquid and Restricted
Securities Risk. The Fund may invest in securities that are restricted and/or illiquid. Restricted securities are securities that cannot be offered for public resale unless registered under the applicable
securities laws or that have a contractual restriction that prohibits or limits their resale. Restricted securities may be illiquid as they generally are not listed on an exchange and may have no active trading
market. Investments in restricted securities could have the effect of increasing the amount of the Fund’s assets invested in illiquid securities if qualified institutional buyers are unwilling to purchase these
securities. Illiquid and restricted securities may be difficult to dispose of at a fair price at the times when the Fund believes it is desirable to do so. The market price of illiquid and restricted securities
generally is more volatile than that of more liquid securities, which may adversely affect the price that the Fund pays for or recovers upon the sale of such securities. Illiquid and restricted securities are also
more difficult to value, especially in challenging markets.
|
||||||
| Inflation Risk [Member] | |||||||
| General Description of Registrant [Abstract] | |||||||
| Risk [Text Block] | Inflation Risk. The Fund invests in securities that are subject to inflation risk. Inflation risk is the risk that the value of assets or income from investments will be worth less in the future as
inflation decreases the value of money. As inflation increases, the present value of the Fund’s assets and distributions may decline. This risk is more prevalent with respect to debt securities. Inflation
creates uncertainty over the future real value (after inflation) of an investment. Inflation rates may change frequently and drastically as a result of various factors, including unexpected shifts in the domestic or
global economy, and the Fund’s investments may not keep pace with inflation, which may result in losses to Fund investors.
|
||||||
| Leverage Risk [Member] | |||||||
| General Description of Registrant [Abstract] | |||||||
| Risk [Text Block] | Leverage Risk. The use of leverage by the Fund can magnify the effect of any losses. If the income and gains from the securities and investments purchased with leverage proceeds do not cover the cost of
leverage, the return to the common shares will be less than if leverage had not been used. Leverage involves risks and special considerations for common shareholders including: (i) the likelihood of greater volatility
of net asset value and market price of the common shares than a comparable portfolio without leverage; (ii) the risk that fluctuations in interest rates on borrowings will reduce the return to the common shareholders
or will result in fluctuations in the dividends paid on the common shares; (iii) in a declining market, the use of leverage is likely to cause a greater decline in the net asset value of the common shares than if the
Fund were not leveraged, which may result in a greater decline in the market price of the common shares; and (iv) when the Fund uses certain types of leverage, the investment advisory fee payable to the Advisor and by
the Advisor to the Sub-Advisor will be higher than if the Fund did not use leverage.
|
||||||
| Management Risk And Reliance On Key Personnel [Member] | |||||||
| General Description of Registrant [Abstract] | |||||||
| Risk [Text Block] | Management Risk and
Reliance on Key Personnel. The implementation of the Fund’s investment strategy depends upon the continued contributions of certain key employees of the Advisor and Sub-Advisor, some of whom have unique
talents and experience and would be difficult to replace. The loss or interruption of the services of a key member of the portfolio management team could have a negative impact on the Fund.
|
||||||
| Market Discount From Net Asset Value [Member] | |||||||
| General Description of Registrant [Abstract] | |||||||
| Risk [Text Block] | Market Discount from Net
Asset Value. Shares of closed-end investment companies such as the Fund frequently trade at a discount from their net asset value. The Fund cannot predict whether its common shares will trade at, below
or above net asset value.
|
||||||
| Market Risk [Member] | |||||||
| General Description of Registrant [Abstract] | |||||||
| Risk [Text Block] | Market Risk. Securities held by the Fund, as well as shares of the Fund itself, are subject to market fluctuations caused by factors such as general economic conditions, political events,
regulatory or market developments, changes in interest rates and perceived trends in securities prices. Shares of the Fund could decline in value or underperform other investments as a result of the risk of loss
associated with these market fluctuations. In addition, local, regional or global events such as war, acts of terrorism, spread of infectious diseases or other public health issues, recessions, or other events could
have a significant negative impact on the Fund and its investments. For example, the coronavirus (COVID-19) global pandemic and the aggressive responses taken by many governments, including closing borders,
restricting international and domestic travel, and the imposition of prolonged quarantines or similar restrictions, had negative impacts, and in many cases severe impacts, on markets worldwide. While the development
of vaccines has slowed the spread of the virus and allowed for the resumption of reasonably normal business activity in the United States, many countries continue to impose lockdown measures in an attempt to slow the
spread. Additionally, there is no guarantee that vaccines will be effective against emerging variants of the disease. Also, in February 2022, Russia invaded Ukraine which has caused and could continue to cause
significant market disruptions and volatility across markets globally, including the United States. The hostilities and sanctions resulting from those hostilities could have a significant impact on certain Fund
investments as well as Fund performance. As the global pandemic and conflict in Ukraine have illustrated, such events may affect certain geographic regions, countries, sectors and industries more significantly than
others. Recent and potential future bank failures could result in disruption to the broader banking
industry or markets generally and reduce
confidence in financial institutions and the economy as a whole, which may also heighten market volatility and reduce liquidity. These events also may adversely affect the prices and liquidity of the Fund’s
portfolio securities or other instruments and could result in disruptions in the trading markets. Any of such circumstances could have a materially negative impact on the value of the Fund’s shares and result in
increased market volatility. During any such events, the Fund’s shares may trade at increased premiums or discounts to their net asset value and the bid/ask spread on the Fund’s shares may widen.
|
||||||
| Non U S Securities Risk [Member] | |||||||
| General Description of Registrant [Abstract] | |||||||
| Risk [Text Block] | Non-U.S. Securities
Risk. Investing in securities of non-U.S. issuers, which are generally denominated in non-U.S. currencies, may involve certain risks not typically associated with investing in securities of U.S.
issuers. These risks include: (i) there may be less publicly available information about non-U.S. issuers or markets due to less rigorous disclosure or accounting standards or regulatory practices; (ii) non-U.S.
markets may be smaller, less liquid and more volatile than the U.S. market; (iii) potential adverse effects of fluctuations in currency exchange rates or controls on the value of the Fund’s investments; (iv) the
economies of non-U.S. countries may grow at slower rates than expected or may experience a downturn or recession; (v) the impact of economic, political, social or diplomatic events; (vi) certain non-U.S. countries may
impose restrictions on the ability of non-U.S. issuers to make payments of principal and interest to investors located in the United States due to blockage of non-U.S. currency exchanges or otherwise; and (vii)
withholding and other non-U.S. taxes may decrease the Fund’s return. Foreign companies are generally not subject to the same accounting, auditing and financial reporting standards as are U.S. companies. In
addition, there may be difficulty in obtaining or enforcing a court judgment abroad, including in the event the issuer of a non-U.S. security defaults or enters bankruptcy, administration or other proceedings. These
risks may be more pronounced to the extent that the Fund invests a significant amount of its assets in companies located in one region or in emerging markets.
|
||||||
| Operational Risk [Member] | |||||||
| General Description of Registrant [Abstract] | |||||||
| Risk [Text Block] | Operational Risk. The Fund is subject to risks arising from various operational factors, including, but not limited to, human error, processing and communication errors, errors of the Fund’s service
providers, counterparties or other third-parties, failed or inadequate processes and technology or systems failures. The Fund relies on third-parties for a range of services, including custody. Any delay or failure
relating to engaging or maintaining such service providers may affect the Fund’s ability to meet its investment objective. Although the Fund and the Advisor seek to reduce these operational risks through
controls and procedures, there is no way to completely protect against such risks.
|
||||||
| Potential Conflicts Of Interest Risk [Member] | |||||||
| General Description of Registrant [Abstract] | |||||||
| Risk [Text Block] | Potential Conflicts of
Interest Risk. First Trust, MacKay and the portfolio managers have interests which may conflict with the interests of the Fund. In particular, First Trust and MacKay currently manage and may in the
future manage and/or advise other investment funds or accounts with the same or substantially similar investment objective and strategies as the Fund. In addition, while the Fund is using certain types of leverage,
the amount of the fees paid to First Trust (and by First Trust to MacKay) for investment advisory and management services are higher than if the Fund did not use leverage because the fees paid are calculated based on
managed assets. Therefore, First Trust and MacKay could have a financial incentive to leverage the Fund.
|
||||||
| Preferred Securities Risk [Member] | |||||||
| General Description of Registrant [Abstract] | |||||||
| Risk [Text Block] | Preferred Securities
Risk. Preferred securities combine some of the characteristics of both common stocks and bonds. Preferred securities are typically subordinated to bonds and other debt securities in a
company’s capital structure in terms of priority to corporate income, subjecting them to greater credit risk than those debt securities. Generally, holders of preferred securities have no voting rights with
respect to the issuing company unless preferred dividends have been in arrears for a specified number of periods, at which time the preferred security holders may obtain limited rights. In certain circumstances, an
issuer of preferred securities may defer payment on the securities and, in some cases, redeem the securities prior to a specified date. Preferred securities may also be substantially less liquid than other securities,
including common stock.
|
||||||
| Short Selling Risk [Member] | |||||||
| General Description of Registrant [Abstract] | |||||||
| Risk [Text Block] | Short Selling Risk. The Fund engages in short selling. Short sales are transactions in which the Fund sells a security that it does not own but can borrow in the market and allows the Fund to profit from
a decline in the market price (to the extent such decline exceeds the transaction costs and the costs of borrowing the securities). If a security sold short increases in price, the Fund may have to cover its short
position at a higher price than the short sale price, resulting in a loss. Because losses on short sales arise from increases in the value of the security sold short, such losses are theoretically unlimited. It is
possible that the Fund’s long securities positions will decline in value at the same time that the value of its short securities positions increase, thereby increasing potential losses to the Fund. In addition,
the Fund’s short selling strategies will limit its ability to fully benefit from increases in the fixed-income markets.
The Fund may not be able
to borrow a security that it needs to deliver or it may not be able to close out a short position at an acceptable price and may have to sell related long positions before it had intended to do so. Thus, the Fund may
not be able to successfully implement its short sale strategy due to limited availability of desired securities or for other reasons. Also, there is the risk that the counterparty to a short sale may fail to honor its
contractual terms, causing a loss to the Fund. Further, when the Fund is selling a security short, it must maintain a segregated account of cash or high-grade securities equal to the margin requirement. As a
result, the Fund may maintain high levels of cash or other liquid assets, which may limit the Fund’s ability to pursue other opportunities.
|
||||||
| Valuation Risk [Member] | |||||||
| General Description of Registrant [Abstract] | |||||||
| Risk [Text Block] | Valuation Risk. Unlike publicly traded common stock which trades on national exchanges, there is no central place or exchange for fixed-income securities trading. Fixed-income securities generally trade
on an “over-the-counter” market which may be anywhere in the world where the buyer and seller can settle on a price. Due to the lack of centralized information and trading, the valuation of fixed-income
securities may carry more risk than that of common stock. Uncertainties in the conditions of the financial market, unreliable reference data, lack of transparency and inconsistency of valuation models and processes
may lead to inaccurate asset pricing.
|
||||||
| Interest Rate Risk [Member] | |||||||
| General Description of Registrant [Abstract] | |||||||
| Risk [Text Block] | Interest Rate Risk. Interest rate risk is the risk that securities will decline in value because of changes in market interest rates. For fixed rate securities, when market interest rates rise,
the market value of such securities generally will fall. Investments in fixed rate securities with long-term maturities may experience significant price declines if long-term interest rates increase.
During periods of rising interest rates, the average life of certain types of securities may be extended because of slower than expected prepayments. This may lock in a below-market yield, increase the
security’s duration and further reduce the value of the security. Fixed rate securities
with longer durations tend to be more
sensitive to changes in interest rates, usually making them more volatile than securities with shorter durations. The duration of a security will be expected to change over time with changes in market factors
and time to maturity.
The interest rates
payable on floating rate securities are not fixed and may fluctuate based upon changes in market rates. As short-term interest rates decline, interest payable on floating rate securities typically decreases.
Alternatively, during periods of rising interest rates, interest payable on floating rate securities typically increases. Changes in interest rates on floating rate securities may lag behind changes in
market rates or may have limits on the maximum increases in interest rates. The value of floating rate securities may decline if their interest rates do not rise as much, or as quickly, as interest rates in
general.
Many financial
instruments use or may use a floating rate based upon the LIBOR. The United Kingdom’s Financial Conduct Authority (the “FCA”), which regulates LIBOR, intends to cease making LIBOR available as
a reference rate over a phase-out period that began in early 2022. However, subsequent announcements by the FCA, the LIBOR administrators, and other regulators indicate that it is possible that the most widely used
LIBOR rates may continue until mid-2023. The unavailability or replacement of LIBOR may affect the value, liquidity or return on certain Fund investments and may result in costs incurred in connection with
closing out positions and entering into new trades. Any potential effects of the transition away from LIBOR on the Fund or on certain instruments in which the Fund invests can be difficult to ascertain, and they may
vary depending on a variety of factors. In the United States, it is anticipated that in many instances the Secured Overnight Financing Rate (“SOFR”) will replace LIBOR as the reference rate for many
floating rate instruments. There is no assurance that the composition or characteristics of SOFR, or any alternative reference rate, will be similar to or produce the same value or economic equivalence as LIBOR or
that instruments using an alternative rate will have the same volume or liquidity. As a result, the transition process might lead to increased volatility and reduced liquidity in markets that currently rely on LIBOR
to determine interest rates; a reduction in the value of some LIBOR-based investments; increased difficulty in borrowing or refinancing and diminished effectiveness of any applicable hedging strategies against
instruments whose terms currently include LIBOR; and/ or costs incurred in connection with temporary borrowings and closing out positions and entering into new agreements. Any such effects (as well as other
unforeseen effects) of the transition away from LIBOR and the adoption of alternative reference rates could result in losses to the Fund.
|
1 Year First Trust High Income ... Chart |
1 Month First Trust High Income ... Chart |

It looks like you are not logged in. Click the button below to log in and keep track of your recent history.
Support: +44 (0) 203 8794 460 | support@advfn.com
By accessing the services available at ADVFN you are agreeing to be bound by ADVFN's Terms & Conditions
 Hot Features