We could not find any results for:
Make sure your spelling is correct or try broadening your search.
| Share Name | Share Symbol | Market | Type |
|---|---|---|---|
| First Trust Intermediate Duration Preferred and Income Fund | NYSE:FPF | NYSE | Common Stock |
| Price Change | % Change | Share Price | High Price | Low Price | Open Price | Shares Traded | Last Trade | |
|---|---|---|---|---|---|---|---|---|
| -0.02 | -0.11% | 17.90 | 18.00 | 17.80 | 17.99 | 60,764 | 17:05:50 |
UNITED STATES
SECURITIES AND EXCHANGE COMMISSION
Washington, D.C. 20549
FORM N-CSR
CERTIFIED SHAREHOLDER REPORT OF REGISTERED MANAGEMENT INVESTMENT COMPANIES
Investment Company Act file number 811-22795
(Exact name of registrant as specified in charter)
120 East Liberty Drive, Suite 400
Wheaton, IL 60187
(Address of principal executive offices) (Zip code)
W. Scott Jardine, Esq.
First Trust Portfolios L.P.
120 East Liberty Drive, Suite 400
Wheaton, IL 60187
(Name and address of agent for service)
Registrant’s telephone number, including area code: 630-765-8000
Date of fiscal year end: October 31
Date of reporting period: April 30, 2023
Form N-CSR is to be used by management investment companies to file reports with the Commission not later than 10 days after the transmission to stockholders of any report that is required to be transmitted to stockholders under Rule 30e-1 under the Investment Company Act of 1940 (17 CFR 270.30e-1). The Commission may use the information provided on Form N-CSR in its regulatory, disclosure review, inspection, and policymaking roles.
A registrant is required to disclose the information specified by Form N-CSR, and the Commission will make this information public. A registrant is not required to respond to the collection of information contained in Form N-CSR unless the Form displays a currently valid Office of Management and Budget ("OMB") control number. Please direct comments concerning the accuracy of the information collection burden estimate and any suggestions for reducing the burden to Secretary, Securities and Exchange Commission, 100 F Street, NE, Washington, DC 20549. The OMB has reviewed this collection of information under the clearance requirements of 44 U.S.C. § 3507.
Item 1. Reports to Stockholders.
| (a) | The Report to Shareholders is attached herewith. |


| 1 | |
| 2 | |
| 4 | |
| 7 | |
| 16 | |
| 17 | |
| 18 | |
| 19 | |
| 20 | |
| 21 | |
| 28 |

| Performance | ||||
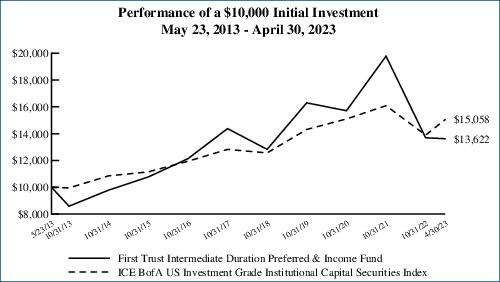
| Average Annual Total Returns | ||||
| 6 Months Ended 4/30/23 | 1 Year Ended 4/30/23 | 5 Years Ended 4/30/23 | Inception (5/23/13) to 4/30/23 | |
| Fund Performance(3) | ||||
| NAV | -2.74% | -12.60% | 0.71% | 4.65% |
| Market Value | -0.53% | -15.69% | -0.02% | 3.15% |
| Index Performance | ||||
| ICE BofA US Investment Grade Institutional Capital Securities Index | 8.39% | -0.33% | 3.35% | 3.95% |
| Blended Index(4) | 7.91% | 0.79% | 2.88% | 3.84% |
| (1) | Most recent distribution paid through April 30, 2023. Subject to change in the future. |
| (2) | Distribution rates are calculated by annualizing the most recent distribution paid through the report date and then dividing by Common Share Price or NAV, as applicable, as of April 30, 2023. Subject to change in the future. |
| (3) | Total return is based on the combination of reinvested dividend, capital gain, and return of capital distributions, if any, at prices obtained by the Dividend Reinvestment Plan and changes in NAV per share for NAV returns and changes in Common Share Price for market value returns. Total returns do not reflect sales load and are not annualized for periods of less than one year. Past performance is not indicative of future results. |
| (4) | The Blended Index consists of a 30/30/30/10 blend of the ICE BofA Core Plus Fixed Rate Preferred Securities Index, the ICE BofA US Investment Grade Institutional Capital Securities Index, the ICE USD Contingent Capital Index and the ICE BofA US High Yield Institutional Capital Securities Index. The Blended Index is intended to reflect the proportional market cap of each segment of the preferred and hybrid securities market. The Blended Index returns are calculated by using the monthly returns of the indices listed above during each period shown. At the beginning of each month the indices are rebalanced to a 30/30/30/10 and 50-50 ratio respectively to account for divergence from that ratio that occurred during the course of each month. The monthly returns are then compounded for each period shown above, giving the performance for the Blended Index for each period shown above. Since the ICE USD Contingent Capital Index had an inception date of December 31, 2013, the performance of the Blended Index is not available for all of the periods disclosed. |
| (5) | The credit quality and ratings information presented above reflect the ratings assigned by one or more nationally recognized statistical rating organizations (NRSROs), including S&P Global Ratings, Moody’s Investors Service, Inc., Fitch Ratings or a comparably rated NRSRO. For situations in which a security is rated by more than one NRSRO and the ratings are not equivalent, the highest rating is used. Sub-investment grade ratings are those rated BB+/Ba1 or lower. Investment grade ratings are those rated BBB-/Baa3 or higher. The credit ratings shown relate to the creditworthiness of the issuers of the underlying securities in the Fund, and not to the Fund or its shares. Credit ratings are subject to change. |
| Performance | ||||
| Average Annual Total Returns | ||||
| 6 Months Ended 4/30/23 | 1 Year Ended 4/30/23 | 5 Years Ended 4/30/23 | Inception (5/23/13) to 4/30/23 | |
| Fund Performance(1) | ||||
| NAV | -2.74% | -12.60% | 0.71% | 4.65% |
| Market Value | -0.53% | -15.69% | -0.02% | 3.15% |
| Index Performance | ||||
| ICE BofA US Investment Grade Institutional Capital Securities Index | 8.39% | -0.33% | 3.35% | 3.95% |
| Blended Index(2) | 7.91% | 0.79% | 2.88% | 3.84% |
| (1) | Total return is based on the combination of reinvested dividend, capital gain, and return of capital distributions, if any, at prices obtained by the Dividend Reinvestment Plan and changes in NAV per share for NAV returns and changes in Common Share Price for market value returns. Total returns do not reflect sales load and are not annualized for periods of less than one year. |
| (2) | The Blended Index consists of a 30/30/30/10 blend of the ICE BofA Core Plus Fixed Rate Preferred Securities Index, the ICE BofA US Investment Grade Institutional Capital Securities Index, the ICE USD Contingent Capital Index and the ICE BofA US High Yield Institutional Capital Securities Index. The Blended Index is intended to reflect the proportional market cap of each segment of the preferred and hybrid securities market. The Prior Blended Index consists of a 50/50 blend of the ICE BofA Fixed Rate Preferred Securities Index and the ICE BofA U.S. Capital Securities Index. The Blended Index was added to reflect the diverse allocation of institutional preferred and hybrid securities in the Fund’s portfolio. The Blended Index and Prior Blended Index returns are calculated by using the monthly returns of the indices listed above during each period shown. At the beginning of each month the indices are rebalanced to a 30/30/30/10 and 50-50 ratio respectively to account for divergence from that ratio that occurred during the course of each month. The monthly returns are then compounded for each period shown above, giving the performance for the Blended Index for each period shown above. Since the ICE USD Contingent Capital Index had an inception date of December 31, 2013, the performance of the Blended Index is not available for all of the periods disclosed. |
| Shares | Description | Stated Rate | Stated Maturity | Value | ||||
| $25 PAR PREFERRED SECURITIES – 23.9% | ||||||||
| Automobiles – 0.3% | ||||||||
| 134,551 | Ford Motor Co. (a) | 6.50% | 08/15/62 | $3,241,334 | ||||
| Banks – 2.6% | ||||||||
| 93 | Atlantic Union Bankshares Corp., Series A | 6.88% | (b) | 1,956 | ||||
| 227,073 | Bank of America Corp., Series KK (c) | 5.38% | (b) | 5,377,089 | ||||
| 49,151 | Bank of America Corp., Series SS (c) | 4.75% | (b) | 1,027,256 | ||||
| 23,977 | Citizens Financial Group, Inc., Series D (c) (d) | 6.35% | (b) | 550,032 | ||||
| 2,028 | Citizens Financial Group, Inc., Series E | 5.00% | (b) | 39,749 | ||||
| 40,000 | Fifth Third Bancorp, Series A (c) | 6.00% | (b) | 960,000 | ||||
| 77,002 | JPMorgan Chase & Co., Series LL (c) | 4.63% | (b) | 1,652,463 | ||||
| 177,126 | KeyCorp (c) (d) | 6.20% | (b) | 3,932,197 | ||||
| 1,141 | Old National Bancorp, Series A | 7.00% | (b) | 28,194 | ||||
| 268,089 | Pinnacle Financial Partners, Inc., Series B (c) | 6.75% | (b) | 6,364,433 | ||||
| 3,364 | Wells Fargo & Co., Series AA (c) | 4.70% | (b) | 66,473 | ||||
| 137,375 | WesBanco, Inc., Series A (c) (d) | 6.75% | (b) | 3,211,827 | ||||
| 174,262 | Wintrust Financial Corp., Series E (c) (d) | 6.88% | (b) | 4,124,781 | ||||
| 27,336,450 | ||||||||
| Capital Markets – 1.6% | ||||||||
| 29,434 | Affiliated Managers Group, Inc. | 4.75% | 09/30/60 | 586,914 | ||||
| 173,946 | Affiliated Managers Group, Inc. | 4.20% | 09/30/61 | 3,054,492 | ||||
| 476,991 | Carlyle Finance LLC | 4.63% | 05/15/61 | 9,005,590 | ||||
| 182,488 | KKR Group Finance Co., IX LLC (c) | 4.63% | 04/01/61 | 3,480,046 | ||||
| 149 | Morgan Stanley, Series P (c) | 6.50% | (b) | 3,895 | ||||
| 6,178 | Oaktree Capital Group LLC, Series A | 6.63% | (b) | 138,634 | ||||
| 4,751 | Oaktree Capital Group LLC, Series B | 6.55% | (b) | 106,280 | ||||
| 16,375,851 | ||||||||
| Consumer Finance – 0.2% | ||||||||
| 5,099 | Capital One Financial Corp., Series I | 5.00% | (b) | 104,631 | ||||
| 90,291 | Capital One Financial Corp., Series J (c) | 4.80% | (b) | 1,757,063 | ||||
| 1,861,694 | ||||||||
| Diversified REITs – 0.3% | ||||||||
| 168,343 | Global Net Lease, Inc., Series A (a) | 7.25% | (b) | 3,728,798 | ||||
| Diversified Telecommunication Services – 0.5% | ||||||||
| 172,303 | AT&T, Inc., Series C (c) | 4.75% | (b) | 3,597,687 | ||||
| 136,219 | Qwest Corp. | 6.50% | 09/01/56 | 1,814,437 | ||||
| 5,412,124 | ||||||||
| Electric Utilities – 1.1% | ||||||||
| 245,850 | Brookfield BRP Holdings Canada, Inc. | 4.63% | (b) | 3,963,102 | ||||
| 195,763 | Brookfield Infrastructure Finance ULC | 5.00% | 05/24/81 | 3,378,870 | ||||
| 120,245 | SCE Trust IV, Series J (c) (d) | 5.38% | (b) | 2,446,986 | ||||
| 80,333 | SCE Trust V, Series K (c) (d) | 5.45% | (b) | 1,789,819 | ||||
| 11,578,777 | ||||||||
| Financial Services – 2.4% | ||||||||
| 176,854 | Apollo Asset Management, Inc., Series B (c) | 6.38% | (b) | 4,477,943 | ||||
| 468,779 | Equitable Holdings, Inc., Series A (c) | 5.25% | (b) | 10,064,685 | ||||
| 421,508 | Jackson Financial, Inc. (d) | 8.00% | (b) | 10,508,195 | ||||
| 25,050,823 | ||||||||
| Food Products – 0.5% | ||||||||
| 224,752 | CHS, Inc., Series 3 (c) (d) | 6.75% | (b) | 5,636,780 | ||||
| Shares | Description | Stated Rate | Stated Maturity | Value | ||||
| $25 PAR PREFERRED SECURITIES (Continued) | ||||||||
| Gas Utilities – 0.4% | ||||||||
| 281,492 | South Jersey Industries, Inc. | 5.63% | 09/16/79 | $4,105,561 | ||||
| Independent Power & Renewable Electricity Producers – 0.3% | ||||||||
| 161,321 | Brookfield Renewable Partners L.P., Series 17 (c) | 5.25% | (b) | 3,065,099 | ||||
| Insurance – 9.3% | ||||||||
| 456,764 | Aegon Funding Co., LLC (c) | 5.10% | 12/15/49 | 10,153,864 | ||||
| 495,827 | American Equity Investment Life Holding Co., Series A (c) (d) | 5.95% | (b) | 11,433,771 | ||||
| 247,889 | American Equity Investment Life Holding Co., Series B (c) (d) | 6.63% | (b) | 5,919,589 | ||||
| 193,648 | AmTrust Financial Services, Inc. | 7.25% | 06/15/55 | 3,280,397 | ||||
| 210,480 | AmTrust Financial Services, Inc. | 7.50% | 09/15/55 | 3,390,833 | ||||
| 192,000 | Arch Capital Group Ltd., Series G (c) | 4.55% | (b) | 3,682,560 | ||||
| 15,137 | Argo Group International Holdings Ltd. (d) | 7.00% | (b) | 362,834 | ||||
| 66,549 | Aspen Insurance Holdings Ltd. (c) | 5.63% | (b) | 1,364,255 | ||||
| 346,650 | Aspen Insurance Holdings Ltd. (c) | 5.63% | (b) | 7,109,791 | ||||
| 21,147 | Aspen Insurance Holdings Ltd. (c) (d) | 5.95% | (b) | 510,066 | ||||
| 43,928 | Athene Holding Ltd., Series A (c) (d) | 6.35% | (b) | 952,798 | ||||
| 52,936 | Athene Holding Ltd., Series D | 4.88% | (b) | 884,561 | ||||
| 590,886 | Athene Holding Ltd., Series E (c) (d) | 7.75% | (b) | 14,606,702 | ||||
| 133,393 | CNO Financial Group, Inc. | 5.13% | 11/25/60 | 2,106,275 | ||||
| 584,250 | Delphi Financial Group, Inc., 3 Mo. LIBOR + 3.19% (a) (c) (e) | 8.05% | 05/15/37 | 12,999,562 | ||||
| 332,971 | Lincoln National Corp., Series D (c) | 9.00% | (b) | 8,780,445 | ||||
| 193,528 | Phoenix Cos. (The), Inc. | 7.45% | 01/15/32 | 3,415,769 | ||||
| 184,385 | Prudential Financial, Inc. (a) | 5.95% | 09/01/62 | 4,720,256 | ||||
| 2 | Reinsurance Group of America, Inc. (d) | 7.13% | 10/15/52 | 53 | ||||
| 114,588 | RenaissanceRe Holdings Ltd., Series G | 4.20% | (b) | 2,100,398 | ||||
| 97,774,779 | ||||||||
| Mortgage Real Estate Investment Trusts – 0.1% | ||||||||
| 32,703 | AGNC Investment Corp., Series F (a) (d) | 6.13% | (b) | 668,122 | ||||
| Multi-Utilities – 0.5% | ||||||||
| 90,867 | Algonquin Power & Utilities Corp. (d) | 6.88% | 10/17/78 | 2,104,479 | ||||
| 60,984 | Algonquin Power & Utilities Corp., Series 19-A (c) (d) | 6.20% | 07/01/79 | 1,395,314 | ||||
| 84,780 | Brookfield Infrastructure Partners L.P., Series 13 | 5.13% | (b) | 1,509,084 | ||||
| 8,373 | Sempra Energy | 5.75% | 07/01/79 | 206,311 | ||||
| 5,215,188 | ||||||||
| Oil, Gas & Consumable Fuels – 1.8% | ||||||||
| 27,462 | Energy Transfer L.P., Series C (c) (d) | 7.38% | (b) | 656,891 | ||||
| 1,879 | Energy Transfer L.P., Series D (d) | 7.63% | (b) | 44,138 | ||||
| 550,446 | Energy Transfer L.P., Series E (c) (d) | 7.60% | (b) | 12,726,311 | ||||
| 228,396 | NuStar Energy L.P., Series A, 3 Mo. LIBOR + 6.77% (c) (e) | 12.10% | (b) | 5,657,369 | ||||
| 19,084,709 | ||||||||
| Real Estate Management & Development – 1.5% | ||||||||
| 307,185 | Brookfield Property Partners L.P., Series A | 5.75% | (b) | 3,839,812 | ||||
| 388,145 | Brookfield Property Partners L.P., Series A2 | 6.38% | (b) | 5,387,453 | ||||
| 398,983 | Brookfield Property Preferred L.P. | 6.25% | 07/26/81 | 5,992,725 | ||||
| 23,528 | DigitalBridge Group, Inc., Series I (c) | 7.15% | (b) | 482,324 | ||||
| 1,939 | DigitalBridge Group, Inc., Series J | 7.13% | (b) | 40,001 | ||||
| 15,742,315 | ||||||||
| Specialized REITs – 0.0% | ||||||||
| 17,466 | National Storage Affiliates Trust, Series A (c) | 6.00% | (b) | 425,297 | ||||
| Shares | Description | Stated Rate | Stated Maturity | Value | ||||
| $25 PAR PREFERRED SECURITIES (Continued) | ||||||||
| Wireless Telecommunication Services – 0.5% | ||||||||
| 75,137 | United States Cellular Corp. | 6.25% | 09/01/69 | $1,261,550 | ||||
| 253,239 | United States Cellular Corp. | 5.50% | 06/01/70 | 3,861,895 | ||||
| 5,123,445 | ||||||||
Total $25 Par Preferred Securities | 251,427,146 | |||||||
| (Cost $289,685,712) | ||||||||
| $100 PAR PREFERRED SECURITIES – 0.8% | ||||||||
| Banks – 0.8% | ||||||||
| 54,250 | CoBank ACB, Series H (c) (d) | 6.20% | (b) | 5,201,219 | ||||
| 28,000 | Farm Credit Bank of Texas (d) (f) | 6.75% | (b) | 2,740,500 | ||||
Total $100 Par Preferred Securities | 7,941,719 | |||||||
| (Cost $8,265,750) | ||||||||
| $1,000 PAR PREFERRED SECURITIES – 4.8% | ||||||||
| Banks – 3.7% | ||||||||
| 6,977 | Bank of America Corp., Series L | 7.25% | (b) | 8,260,280 | ||||
| 26,113 | Wells Fargo & Co., Series L | 7.50% | (b) | 30,500,767 | ||||
| 38,761,047 | ||||||||
| Financial Services – 1.1% | ||||||||
| 12,000 | Compeer Financial ACA (d) (f) | 6.75% | (b) | 11,940,194 | ||||
Total $1,000 Par Preferred Securities | 50,701,241 | |||||||
| (Cost $56,571,526) | ||||||||
| $1,000,000 PAR PREFERRED SECURITIES – 1.2% | ||||||||
| Mortgage Real Estate Investment Trusts – 1.2% | ||||||||
| 12 | FT Real Estate Securities Co., Inc. (g) (h) (i) | 9.50% | (b) | 12,600,000 | ||||
| (Cost $15,990,000) | ||||||||
| Par Amount | Description | Stated Rate | Stated Maturity | Value | ||||
| CAPITAL PREFERRED SECURITIES – 116.3% | ||||||||
| Banks – 57.5% | ||||||||
| $12,935,000 | Australia & New Zealand Banking Group Ltd. (c) (d) (f) (j) | 6.75% | (b) | 12,491,500 | ||||
| 9,100,000 | Banco Bilbao Vizcaya Argentaria S.A., Series 9 (c) (d) (j) | 6.50% | (b) | 8,321,313 | ||||
| 5,000,000 | Banco Mercantil del Norte S.A. (d) (f) (j) | 7.50% | (b) | 4,416,750 | ||||
| 8,000,000 | Banco Mercantil del Norte S.A. (d) (f) (j) | 7.63% | (b) | 7,288,004 | ||||
| 7,400,000 | Banco Mercantil del Norte S.A. (d) (f) (j) | 8.38% | (b) | 7,005,950 | ||||
| 10,800,000 | Banco Santander S.A. (d) (j) | 4.75% | (b) | 8,432,640 | ||||
| 12,400,000 | Banco Santander S.A. (c) (d) (j) (k) | 7.50% | (b) | 11,971,394 | ||||
| 27,885,000 | Bank of America Corp., Series TT (c) (d) | 6.13% | (b) | 27,105,957 | ||||
| 2,860,000 | Bank of America Corp., Series X (c) (d) | 6.25% | (b) | 2,803,086 | ||||
| 3,800,000 | Bank of Nova Scotia (The) (d) | 4.90% | (b) | 3,486,281 | ||||
| 16,920,000 | Bank of Nova Scotia (The) (d) | 8.63% | 10/27/82 | 17,360,799 | ||||
| 32,200,000 | Barclays PLC (c) (d) (j) | 8.00% | (b) | 29,781,780 | ||||
| 34,670,000 | Barclays PLC (c) (d) (j) | 8.00% | (b) | 30,454,128 | ||||
| 8,550,000 | BBVA Bancomer S.A. (a) (d) (f) (j) | 5.88% | 09/13/34 | 7,744,675 | ||||
| 10,400,000 | BNP Paribas S.A. (d) (f) (j) | 4.63% | (b) | 7,403,760 | ||||
| 13,225,000 | BNP Paribas S.A. (c) (d) (f) (j) | 7.75% | (b) | 12,662,937 | ||||
| 4,000,000 | BNP Paribas S.A. (c) (d) (f) (j) | 9.25% | (b) | 4,123,600 | ||||
| 6,370,000 | Citigroup, Inc. (c) (d) | 3.88% | (b) | 5,454,312 | ||||
| 23,000,000 | Citigroup, Inc. (c) (d) | 7.38% | (b) | 22,770,000 | ||||
| 3,022,000 | Citigroup, Inc., 3 Mo. LIBOR + 4.07% (c) (e) | 9.34% | (b) | 3,020,489 | ||||
| 9,351,000 | Citigroup, Inc., Series M (c) (d) | 6.30% | (b) | 8,855,865 | ||||
| Par Amount | Description | Stated Rate | Stated Maturity | Value | ||||
| CAPITAL PREFERRED SECURITIES (Continued) | ||||||||
| Banks (Continued) | ||||||||
| $8,600,000 | Citigroup, Inc., Series P (c) (d) | 5.95% | (b) | $8,073,402 | ||||
| 607,000 | Citizens Financial Group, Inc., Series G (d) | 4.00% | (b) | 473,460 | ||||
| 25,000,000 | CoBank ACB, Series I (c) (d) | 6.25% | (b) | 23,595,000 | ||||
| 9,695,000 | CoBank ACB, Series K (c) (d) | 6.45% | (b) | 9,161,021 | ||||
| 2,800,000 | Commerzbank AG (d) (j) (k) | 7.00% | (b) | 2,471,350 | ||||
| 5,000,000 | Credit Agricole S.A. (c) (d) (f) (j) | 6.88% | (b) | 4,810,250 | ||||
| 31,540,000 | Credit Agricole S.A. (c) (d) (f) (j) | 8.13% | (b) | 31,394,948 | ||||
| 8,940,000 | Danske Bank A.S. (c) (d) (j) (k) | 7.00% | (b) | 8,376,825 | ||||
| 3,450,000 | Farm Credit Bank of Texas, Series 3 (a) (d) (f) | 6.20% | (b) | 3,061,875 | ||||
| 7,500,000 | Farm Credit Bank of Texas, Series 4 (c) (d) (f) | 5.70% | (b) | 6,600,000 | ||||
| 4,706,000 | Fifth Third Bancorp, Series L (d) | 4.50% | (b) | 4,179,645 | ||||
| 16,300,000 | HSBC Holdings PLC (c) (d) (j) | 8.00% | (b) | 16,218,500 | ||||
| 15,092,000 | ING Groep N.V. (c) (d) (j) | 5.75% | (b) | 13,155,545 | ||||
| 10,920,000 | ING Groep N.V. (c) (d) (j) | 6.50% | (b) | 10,105,963 | ||||
| 900,000 | ING Groep N.V. (d) (j) (k) | 7.50% | (b) | 822,937 | ||||
| 22,600,000 | Intesa Sanpaolo S.p.A. (c) (d) (f) (j) | 7.70% | (b) | 20,619,670 | ||||
| 9,600,000 | Lloyds Banking Group PLC (c) (d) (j) | 6.75% | (b) | 8,849,368 | ||||
| 16,316,502 | Lloyds Banking Group PLC (c) (d) (j) | 7.50% | (b) | 15,714,260 | ||||
| 7,912,000 | Lloyds Banking Group PLC (c) (d) (j) | 7.50% | (b) | 7,521,068 | ||||
| 13,717,000 | Lloyds Banking Group PLC (c) (d) (j) | 8.00% | (b) | 12,578,489 | ||||
| 3,979,659 | M&T Bank Corp. (c) (d) | 3.50% | (b) | 2,626,575 | ||||
| 648,000 | M&T Bank Corp., Series F (d) | 5.13% | (b) | 504,289 | ||||
| 2,000,000 | Macquarie Bank Ltd. (d) (f) (j) | 6.13% | (b) | 1,725,757 | ||||
| 5,100,000 | NatWest Group PLC (c) (d) (j) | 6.00% | (b) | 4,793,490 | ||||
| 10,150,000 | NatWest Group PLC (c) (d) (j) | 8.00% | (b) | 10,060,325 | ||||
| 2,680,000 | PNC Financial Services Group (The), Inc., Series U (c) (d) | 6.00% | (b) | 2,492,400 | ||||
| 16,480,000 | PNC Financial Services Group (The), Inc., Series V (c) (d) | 6.20% | (b) | 15,560,541 | ||||
| 13,800,000 | PNC Financial Services Group (The), Inc., Series W (c) (d) | 6.25% | (b) | 12,682,200 | ||||
| 24,100,000 | Societe Generale S.A. (d) (f) (j) | 5.38% | (b) | 16,930,250 | ||||
| 20,300,000 | Societe Generale S.A. (c) (d) (f) (j) | 9.38% | (b) | 19,323,570 | ||||
| 19,940,000 | Standard Chartered PLC (d) (f) (j) | 4.30% | (b) | 14,109,544 | ||||
| 65,000 | Standard Chartered PLC (d) (k) | 7.01% | (b) | 62,599 | ||||
| 9,200,000 | Standard Chartered PLC (c) (d) (f) (j) | 7.75% | (b) | 8,934,028 | ||||
| 2,779,000 | Texas Capital Bancshares, Inc. (c) (d) | 4.00% | 05/06/31 | 2,247,678 | ||||
| 16,000,000 | Toronto-Dominion Bank (The) (a) (d) | 8.13% | 10/31/82 | 16,336,480 | ||||
| 22,201,000 | UniCredit S.p.A. (c) (d) (j) (k) | 8.00% | (b) | 21,555,683 | ||||
| 5,000,000 | UniCredit S.p.A. (a) (d) (f) | 5.46% | 06/30/35 | 4,265,292 | ||||
| 604,949,497 | ||||||||
| Capital Markets – 4.5% | ||||||||
| 12,296,000 | Apollo Management Holdings L.P. (a) (c) (d) (f) | 4.95% | 01/14/50 | 10,400,804 | ||||
| 15,772,000 | Charles Schwab (The) Corp., Series G (d) | 5.38% | (b) | 15,091,833 | ||||
| 660,000 | Charles Schwab (The) Corp., Series I (d) | 4.00% | (b) | 554,413 | ||||
| 2,200,000 | Charles Schwab (The) Corp., Series K (c) (d) | 5.00% | (b) | 1,903,000 | ||||
| 19,220,000 | Credit Suisse Group AG (d) (g) (h) (i) (j) | 5.25% | (b) | 0 | ||||
| 15,730,000 | Credit Suisse Group AG (d) (g) (h) (i) (j) | 6.38% | (b) | 0 | ||||
| 28,250,000 | Credit Suisse Group AG (d) (g) (h) (i) (j) | 7.50% | (b) | 0 | ||||
| 6,400,000 | Credit Suisse Group AG (d) (g) (h) (i) (j) | 9.75% | (b) | 0 | ||||
| 18,300,000 | Deutsche Bank AG, Series 2020 (c) (d) (j) | 6.00% | (b) | 13,723,170 | ||||
| 6,850,000 | EFG International AG (d) (j) (k) | 5.50% | (b) | 4,936,281 | ||||
| 300,000 | Goldman Sachs Group (The), Inc., Series R (c) (d) | 4.95% | (b) | 281,239 | ||||
| 46,890,740 | ||||||||
| Construction Materials – 0.7% | ||||||||
| 7,800,000 | Cemex SAB de CV (d) (f) | 9.13% | (b) | 7,755,159 | ||||
| Par Amount | Description | Stated Rate | Stated Maturity | Value | ||||
| CAPITAL PREFERRED SECURITIES (Continued) | ||||||||
| Consumer Finance – 0.5% | ||||||||
| $5,639,000 | Ally Financial, Inc., Series B (d) | 4.70% | (b) | $4,176,384 | ||||
| 1,835,000 | Ally Financial, Inc., Series C (d) | 4.70% | (b) | 1,293,675 | ||||
| 5,470,059 | ||||||||
| Electric Utilities – 2.3% | ||||||||
| 7,950,000 | American Electric Power Co., Inc. (a) (c) (d) | 3.88% | 02/15/62 | 6,402,322 | ||||
| 5,116,000 | Edison International, Series B (c) (d) | 5.00% | (b) | 4,386,025 | ||||
| 6,976,000 | Emera, Inc., Series 16-A (a) (d) | 6.75% | 06/15/76 | 6,670,192 | ||||
| 1,929,000 | Southern (The) Co., Series 21-A (c) (d) | 3.75% | 09/15/51 | 1,646,356 | ||||
| 5,110,000 | Southern California Edison Co., Series E, 3 Mo. LIBOR + 4.20% (c) (e) | 9.01% | (b) | 5,058,900 | ||||
| 24,163,795 | ||||||||
| Energy Equipment & Services – 2.3% | ||||||||
| 21,650,000 | Transcanada Trust (a) (c) (d) | 5.50% | 09/15/79 | 18,425,184 | ||||
| 6,450,000 | Transcanada Trust (a) (c) (d) | 5.60% | 03/07/82 | 5,461,793 | ||||
| 23,886,977 | ||||||||
| Financial Services – 5.1% | ||||||||
| 15,000,000 | American AgCredit Corp. (c) (d) (f) | 5.25% | (b) | 13,106,250 | ||||
| 9,300,000 | Ares Finance Co. III LLC (a) (c) (d) (f) | 4.13% | 06/30/51 | 7,075,151 | ||||
| 9,350,000 | Capital Farm Credit ACA, Series 1 (c) (d) (f) | 5.00% | (b) | 8,438,375 | ||||
| 3,800,000 | Compeer Financial ACA (c) (d) (f) | 4.88% | (b) | 3,358,250 | ||||
| 22,150,000 | Corebridge Financial, Inc. (a) (c) (d) (f) | 6.88% | 12/15/52 | 20,095,246 | ||||
| 2,224,000 | Voya Financial, Inc., Series A (c) (d) | 6.13% | (b) | 2,147,672 | ||||
| 54,220,944 | ||||||||
| Food Products – 4.9% | ||||||||
| 6,000,000 | Dairy Farmers of America, Inc. (c) (g) | 7.13% | (b) | 5,145,000 | ||||
| 7,329,000 | Land O’Lakes Capital Trust I (a) (c) (g) | 7.45% | 03/15/28 | 6,944,228 | ||||
| 10,000,000 | Land O’Lakes, Inc. (a) (c) (f) | 7.25% | (b) | 8,650,000 | ||||
| 33,000,000 | Land O’Lakes, Inc. (c) (f) | 8.00% | (b) | 30,519,060 | ||||
| 51,258,288 | ||||||||
| Insurance – 16.9% | ||||||||
| 3,000,000 | Aegon N.V. (a) (d) | 5.50% | 04/11/48 | 2,915,730 | ||||
| 17,585,000 | Assurant, Inc. (a) (c) (d) | 7.00% | 03/27/48 | 16,857,192 | ||||
| 5,150,000 | Assured Guaranty Municipal Holdings, Inc. (a) (d) (f) | 6.40% | 12/15/66 | 4,644,193 | ||||
| 9,932,000 | AXIS Specialty Finance LLC (a) (c) (d) | 4.90% | 01/15/40 | 8,018,614 | ||||
| 2,000,000 | CNP Assurances (d) (k) | 4.88% | (b) | 1,501,670 | ||||
| 8,704,000 | Enstar Finance LLC (a) (d) | 5.75% | 09/01/40 | 7,307,924 | ||||
| 17,149,000 | Enstar Finance LLC (a) (d) | 5.50% | 01/15/42 | 12,369,175 | ||||
| 15,300,000 | Fortegra Financial Corp. (a) (c) (d) (g) | 8.50% | 10/15/57 | 14,458,500 | ||||
| 23,121,000 | Global Atlantic Fin Co. (a) (d) (f) | 4.70% | 10/15/51 | 18,506,478 | ||||
| 16,439,000 | Hartford Financial Services Group (The), Inc., 3 Mo. LIBOR + 2.13% (a) (c) (e) (f) | 6.99% | 02/12/47 | 13,438,882 | ||||
| 8,183,000 | Kuvare US Holdings, Inc. (c) (d) (f) | 7.00% | 02/17/51 | 8,305,745 | ||||
| 2,000,000 | La Mondiale SAM (c) (d) (k) | 5.88% | 01/26/47 | 1,913,358 | ||||
| 9,500,000 | Lancashire Holdings Ltd. (c) (d) (k) | 5.63% | 09/18/41 | 7,884,126 | ||||
| 6,700,000 | Liberty Mutual Group, Inc. (a) (c) (d) (f) | 4.13% | 12/15/51 | 5,411,691 | ||||
| 3,295,000 | Liberty Mutual Group, Inc. (f) | 4.30% | 02/01/61 | 1,965,579 | ||||
| 4,935,000 | Lincoln National Corp., Series C (c) (d) | 9.25% | (b) | 4,978,181 | ||||
| 2,442,000 | Nationwide Financial Services Capital Trust (a) (l) | 7.90% | 03/01/37 | 2,576,310 | ||||
| 2,910,000 | Nationwide Financial Services, Inc. (a) (c) | 6.75% | 05/15/37 | 2,806,172 | ||||
| 16,684,000 | Prudential Financial, Inc. (a) (d) | 6.00% | 09/01/52 | 16,058,581 | ||||
| Par Amount | Description | Stated Rate | Stated Maturity | Value | ||||
| CAPITAL PREFERRED SECURITIES (Continued) | ||||||||
| Insurance (Continued) | ||||||||
| $14,900,000 | QBE Insurance Group Ltd. (c) (d) (f) | 5.88% | (b) | $14,105,599 | ||||
| 9,765,000 | QBE Insurance Group Ltd. (c) (d) (k) | 6.75% | 12/02/44 | 9,689,310 | ||||
| 2,000,000 | QBE Insurance Group Ltd. (c) (d) (k) | 5.88% | 06/17/46 | 1,923,197 | ||||
| 177,636,207 | ||||||||
| Mortgage Real Estate Investment Trusts – 0.6% | ||||||||
| 1,200,000 | Scentre Group Trust 2 (a) (d) (f) | 4.75% | 09/24/80 | 1,081,620 | ||||
| 6,450,000 | Scentre Group Trust 2 (a) (c) (d) (f) | 5.13% | 09/24/80 | 5,451,760 | ||||
| 6,533,380 | ||||||||
| Multi-Utilities – 4.9% | ||||||||
| 25,481,000 | Algonquin Power & Utilities Corp. (a) (c) (d) | 4.75% | 01/18/82 | 20,636,752 | ||||
| 990,000 | Dominion Energy, Inc., Series B (c) (d) | 4.65% | (b) | 865,438 | ||||
| 10,795,000 | NiSource, Inc. (c) (d) | 5.65% | (b) | 10,297,351 | ||||
| 24,890,000 | Sempra Energy (c) (d) | 4.13% | 04/01/52 | 20,201,144 | ||||
| 52,000,685 | ||||||||
| Oil, Gas & Consumable Fuels – 11.0% | ||||||||
| 9,000,000 | Buckeye Partners L.P., 3 Mo. LIBOR + 4.02% (c) (e) | 9.29% | 01/22/78 | 7,765,876 | ||||
| 27,810,000 | Enbridge, Inc. (a) (c) (d) | 6.25% | 03/01/78 | 25,135,112 | ||||
| 5,000,000 | Enbridge, Inc. (c) (d) | 7.63% | 01/15/83 | 5,105,407 | ||||
| 21,262,000 | Enbridge, Inc., Series 16-A (a) (c) (d) | 6.00% | 01/15/77 | 19,887,055 | ||||
| 15,150,000 | Enbridge, Inc., Series 20-A (c) (d) | 5.75% | 07/15/80 | 13,894,247 | ||||
| 2,543,000 | Energy Transfer L.P., Series B (c) (d) | 6.63% | (b) | 1,952,512 | ||||
| 11,509,000 | Energy Transfer L.P., Series F (c) (d) | 6.75% | (b) | 10,160,644 | ||||
| 14,694,000 | Energy Transfer L.P., Series G (c) (d) | 7.13% | (b) | 12,416,430 | ||||
| 2,000,000 | Energy Transfer L.P., Series H (c) (d) | 6.50% | (b) | 1,775,000 | ||||
| 494,000 | Enterprise Products Operating LLC (d) | 5.38% | 02/15/78 | 403,864 | ||||
| 13,399,000 | Enterprise Products Operating LLC, 3 Mo. LIBOR + 2.78% (c) (e) | 7.74% | 06/01/67 | 12,006,693 | ||||
| 4,151,000 | Enterprise Products Operating LLC, Series D, 3 Mo. LIBOR + 2.99% (c) (e) | 7.86% | 08/16/77 | 3,953,794 | ||||
| 990,000 | Enterprise Products Operating LLC, Series E (c) (d) | 5.25% | 08/16/77 | 859,815 | ||||
| 115,316,449 | ||||||||
| Trading Companies & Distributors – 4.5% | ||||||||
| 40,945,000 | AerCap Holdings N.V. (c) (d) | 5.88% | 10/10/79 | 38,038,180 | ||||
| 4,863,000 | Air Lease Corp., Series B (c) (d) | 4.65% | (b) | 4,005,645 | ||||
| 7,685,000 | Aircastle Ltd. (c) (d) (f) | 5.25% | (b) | 5,614,793 | ||||
| 47,658,618 | ||||||||
| Transportation Infrastructure – 0.6% | ||||||||
| 6,974,000 | AerCap Global Aviation Trust (a) (c) (d) (f) | 6.50% | 06/15/45 | 6,560,247 | ||||
Total Capital Preferred Securities | 1,224,301,045 | |||||||
| (Cost $1,405,278,138) | ||||||||
| Principal Value | Description | Stated Coupon | Stated Maturity | Value | ||||
| FOREIGN CORPORATE BONDS AND NOTES – 2.6% | ||||||||
| Insurance – 2.6% | ||||||||
| 29,795,925 | Highlands Holdings Bond Issuer Ltd./Highlands Holdings Bond Co-Issuer, Inc. (a) (c) (f) (m) | 7.63% | 10/15/25 | 27,171,693 | ||||
| (Cost $30,115,321) | ||||||||
| Principal Value | Description | Stated Coupon | Stated Maturity | Value | ||||
| CORPORATE BONDS AND NOTES – 0.4% | ||||||||
| Insurance – 0.4% | ||||||||
| $4,396,000 | AmTrust Financial Services, Inc. (a) (c) | 6.13% | 08/15/23 | $4,334,093 | ||||
| (Cost $4,395,223) | ||||||||
Total Investments – 150.0% | 1,578,476,937 | |||
| (Cost $1,810,301,670) | ||||
| Shares | Description | Value | ||
| REVERSE REPURCHASE AGREEMENT – (9.5)% | ||||
| (100,000,000) | Scotia Bank, due 7/29/23, 1 month LIBOR plus 65 bps | (100,000,000) | ||
Outstanding Loan – (42.1)% | (443,100,000) | |||
Net Other Assets and Liabilities – 1.6% | 16,848,106 | |||
Net Assets – 100.0% | $1,052,225,043 | |||
| (a) | This security or a portion of this security is segregated as collateral for reverse repurchase agreements. All of these securities are corporate bonds with a remaining contractual maturity of 30-90 days. At April 30, 2023, securities noted as such are valued at $481,468,020. |
| (b) | Perpetual maturity. |
| (c) | All or a portion of this security serves as collateral on the outstanding loan. |
| (d) | Fixed-to-floating or fixed-to-variable rate security. The interest rate shown reflects the fixed rate in effect at April 30, 2023. At a predetermined date, the fixed rate will change to a floating rate or a variable rate. |
| (e) | Floating or variable rate security. |
| (f) | This security, sold within the terms of a private placement memorandum, is exempt from registration upon resale under Rule 144A of the Securities Act of 1933, as amended (the “1933 Act”), and may be resold in transactions exempt from registration, normally to qualified institutional buyers. Pursuant to procedures adopted by the Fund’s Board of Trustees, this security has been determined to be liquid by Stonebridge Advisors LLC (the “Sub-Advisor”). Although market instability can result in periods of increased overall market illiquidity, liquidity for each security is determined based on security specific factors and assumptions, which require subjective judgment. At April 30, 2023, securities noted as such amounted to $431,249,629 or 41.0% of net assets. |
| (g) | This security, sold within the terms of a private placement memorandum, is exempt from registration upon resale under Rule 144A of the 1933 Act, and may be resold in transactions exempt from registration, normally to qualified institutional buyers (see Note 2D - Restricted Securities in the Notes to Financial Statements). |
| (h) | This security is fair valued by the Advisor’s Pricing Committee in accordance with procedures approved by the Fund’s Board of Trustees, and in accordance with the provisions of the Investment Company Act of 1940 and rules thereunder, as amended. At April 30, 2023, securities noted as such are valued at $12,600,000 or 1.2% of net assets. |
| (i) | This security’s value was determined using significant unobservable inputs. (see Note 2A - Portfolio Valuation in the Notes to Financial Statements). |
| (j) | This security is a contingent convertible capital security which may be subject to conversion into common stock of the issuer under certain circumstances. At April 30, 2023, securities noted as such amounted to $420,829,702 or 26.4% of managed assets. Of these securities, 6.3% originated in emerging markets, and 93.7% originated in foreign markets. |
| (k) | This security may be resold to qualified foreign investors and foreign institutional buyers under Regulation S of the 1933 Act. |
| (l) | Pursuant to procedures adopted by the Fund’s Board of Trustees, this security has been determined to be illiquid by the Sub-Advisor. |
| (m) | These notes are Senior Payment-in-kind (“PIK”) Toggle Notes whereby the issuer may, at its option, elect to pay interest on the notes (1) entirely in cash or (2) entirely in PIK interest. Interest paid in cash will accrue on the notes at a rate of 7.63% per annum (“Cash Interest Rate”) and PIK interest will accrue on the notes at a rate per annum equal to the Cash Interest Rate plus 75 basis points. For the six months ended April 30, 2023, this security paid all of its interest in cash. |
| LIBOR | London Interbank Offered Rate |
| ASSETS TABLE | ||||
| Total Value at 4/30/2023 | Level 1 Quoted Prices | Level 2 Significant Observable Inputs | Level 3 Significant Unobservable Inputs | |
| $25 Par Preferred Securities: | ||||
Financial Services | $ 25,050,823 | $ 14,542,628 | $ 10,508,195 | $ — |
Gas Utilities | 4,105,561 | — | 4,105,561 | — |
Insurance | 97,774,779 | 74,688,218 | 23,086,561 | — |
Other Industry Categories* | 124,495,983 | 124,495,983 | — | — |
$100 Par Preferred Securities* | 7,941,719 | — | 7,941,719 | — |
| $1,000 Par Preferred Securities: | ||||
Banks | 38,761,047 | 38,761,047 | — | — |
Financial Services | 11,940,194 | — | 11,940,194 | — |
$1,000,000 Par Preferred Securities* | 12,600,000 | — | — | 12,600,000 |
| Capital Preferred Securities: | ||||
Capital Markets | 46,890,740 | — | 46,890,740 | —** |
Other Industry Categories* | 1,177,410,305 | — | 1,177,410,305 | — |
Foreign Corporate Bonds and Notes* | 27,171,693 | — | 27,171,693 | — |
Corporate Bonds and Notes* | 4,334,093 | — | 4,334,093 | — |
Total Investments | $ 1,578,476,937 | $ 252,487,876 | $ 1,313,389,061 | $ 12,600,000 |
| LIABILITIES TABLE | ||||
| Total Value at 4/30/2023 | Level 1 Quoted Prices | Level 2 Significant Observable Inputs | Level 3 Significant Unobservable Inputs | |
Reverse Repurchase Agreement | $ (100,000,000) | $ — | $ (100,000,000) | $ — |
| * | See Portfolio of Investments for industry breakout. |
| ** | Investments are valued at $0. |
| Beginning Balance at October 31, 2022 | |
| $1,000,000 Par Preferred Securities | $13,440,000 |
| Capital Preferred Securities | — |
| Net Realized Gain (Loss) | — |
| Net Change in Unrealized Appreciation/Depreciation | (840,000) |
| Purchases | — |
| Sales | — |
| Transfers In | — |
| Capital Preferred Securities | —* |
| Transfers Out | — |
| Ending Balance at April 30, 2023 | |
| $1,000,000 Par Preferred Securities | 12,600,000 |
| Capital Preferred Securities | —* |
| Total Level 3 holdings | $12,600,000 |
| * Investments are valued at $0. |
| ASSETS: | |
Investments, at value (Cost $1,810,301,670) | $ 1,578,476,937 |
Cash | 348,804 |
| Receivables: | |
Interest | 19,764,434 |
Investment securities sold | 4,305,495 |
Dividends | 894,648 |
Interest reclaims | 91,553 |
Dividend reclaims | 87,473 |
Prepaid expenses | 8,259 |
Total Assets | 1,603,977,603 |
| LIABILITIES: | |
Outstanding loan | 443,100,000 |
Reverse repurchase agreement | 100,000,000 |
| Payables: | |
Investment securities purchased | 4,271,640 |
Interest and fees on loan and repurchase agreement | 2,730,023 |
Investment advisory fees | 1,108,803 |
Administrative fees | 441,038 |
Custodian fees | 48,297 |
Audit and tax fees | 26,035 |
Legal fees | 11,285 |
Trustees’ fees and expenses | 5,696 |
Shareholder reporting fees | 3,038 |
Transfer agent fees | 1,993 |
Financial reporting fees | 723 |
Other liabilities | 3,989 |
Total Liabilities | 551,752,560 |
NET ASSETS | $1,052,225,043 |
| NET ASSETS consist of: | |
Paid-in capital | $ 1,424,671,112 |
Par value | 608,478 |
Accumulated distributable earnings (loss) | (373,054,547) |
NET ASSETS | $1,052,225,043 |
NET ASSET VALUE, per Common Share (par value $0.01 per Common Share) | $17.29 |
Number of |
| INVESTMENT INCOME: | ||
Interest (net of foreign withholding tax of $23,571) | $ 47,236,892 | |
Dividends (net of foreign withholding tax of $50,003) | 12,877,120 | |
Total investment income | 60,114,012 | |
| EXPENSES: | ||
Interest and fees on loan and repurchase agreement | 15,259,978 | |
Investment advisory fees | 7,270,396 | |
Administrative fees | 317,254 | |
Legal fees | 138,993 | |
Shareholder reporting fees | 110,086 | |
Custodian fees | 96,932 | |
Listing expense | 30,004 | |
Audit and tax fees | 21,083 | |
Transfer agent fees | 11,410 | |
Trustees’ fees and expenses | 10,451 | |
Financial reporting fees | 4,577 | |
Other | 36,897 | |
Total expenses | 23,308,061 | |
NET INVESTMENT INCOME (LOSS) | 36,805,951 | |
| NET REALIZED AND UNREALIZED GAIN (LOSS): | ||
| Net realized gain (loss) on: | ||
Investments | (82,845,753) | |
Foreign currency transactions | 1,580 | |
Net realized gain (loss) | (82,844,173) | |
Net change in unrealized appreciation (depreciation) on investments | 14,840,317 | |
NET REALIZED AND UNREALIZED GAIN (LOSS) | (68,003,856) | |
NET INCREASE (DECREASE) IN NET ASSETS RESULTING FROM OPERATIONS | $(31,197,905) | |
| Six Months Ended 4/30/2023 (Unaudited) | Year Ended 10/31/2022 | ||
| OPERATIONS: | |||
Net investment income (loss) | $ 36,805,951 | $ 86,952,196 | |
Net realized gain (loss) | (82,844,173) | (11,458,089) | |
Net change in unrealized appreciation (depreciation) | 14,840,317 | (377,373,900) | |
Net increase (decrease) in net assets resulting from operations | (31,197,905) | (301,879,793) | |
| DISTRIBUTIONS TO SHAREHOLDERS FROM: | |||
Investment operations | (40,463,805) | (85,119,106) | |
Return of capital | — | (6,147,414) | |
Total distributions to shareholders | (40,463,805) | (91,266,520) | |
| CAPITAL TRANSACTIONS: | |||
Proceeds from Common Shares reinvested | — | 669,324 | |
Net increase (decrease) in net assets resulting from capital transactions | — | 669,324 | |
Total increase (decrease) in net assets | (71,661,710) | (392,476,989) | |
| NET ASSETS: | |||
Beginning of period | 1,123,886,753 | 1,516,363,742 | |
End of period | $ 1,052,225,043 | $ 1,123,886,753 | |
| CAPITAL TRANSACTIONS were as follows: | |||
Common Shares at beginning of period | 60,847,827 | 60,820,579 | |
Common Shares issued as reinvestment under the Dividend Reinvestment Plan | — | 27,248 | |
Common Shares at end of period | 60,847,827 | 60,847,827 |
| Cash flows from operating activities: | ||
Net increase (decrease) in net assets resulting from operations | $(31,197,905) | |
| Adjustments to reconcile net increase (decrease) in net assets resulting from operations to net cash provided by operating activities: | ||
Purchases of investments | (407,683,826) | |
Sales, maturities and paydown of investments | 417,792,208 | |
Net amortization/accretion of premiums/discounts on investments | 55,039 | |
Net realized gain/loss on investments | 82,845,753 | |
Net change in unrealized appreciation/depreciation on investments | (14,840,317) | |
| Changes in assets and liabilities: | ||
Increase in interest receivable | (757,157) | |
Decrease in interest reclaims receivable | 299,717 | |
Increase in dividend reclaims receivable | (5,713) | |
Increase in dividends receivable | (57,328) | |
Increase in prepaid expenses | (7,931) | |
Increase in interest and fees payable on loan and repurchase agreement | 713,249 | |
Decrease in investment advisory fees payable | (100,422) | |
Decrease in audit and tax fees payable | (23,128) | |
Increase in legal fees payable | 8,445 | |
Decrease in shareholder reporting fees payable | (56,856) | |
Increase in administrative fees payable | 97,950 | |
Increase in custodian fees payable | 16,996 | |
Decrease in transfer agent fees payable | (870) | |
Increase in trustees’ fees and expenses payable | 5,696 | |
Decrease in financial reporting fees payable | (48) | |
Increase in other liabilities payable | 3,989 | |
Cash provided by operating activities | $47,107,541 | |
| Cash flows from financing activities: | ||
Distributions to Common Shareholders from investment operations | (40,463,805) | |
Repayment of borrowing | (79,000,000) | |
Proceeds from borrowing | 72,500,000 | |
Cash used in financing activities | (46,963,805) | |
Increase in cash | 143,736 | |
Cash at beginning of period | 205,068 | |
Cash at end of period | $348,804 | |
| Supplemental disclosure of cash flow information: | ||
Cash paid during the period for interest and fees | $14,546,729 |
| Six Months Ended 4/30/2023 (Unaudited) | Year Ended October 31, | |||||||||||
| 2022 | 2021 | 2020 | 2019 | 2018 | ||||||||
Net asset value, beginning of period | $ 18.47 | $ 24.93 | $ 22.66 | $ 24.40 | $ 22.84 | $ 25.26 | ||||||
| Income from investment operations: | ||||||||||||
Net investment income (loss) | 0.61 | 1.43 | 1.58 | 1.56 | 1.65 | 1.73 | ||||||
Net realized and unrealized gain (loss) | (1.12) | (6.39) | 2.22 | (1.71) | 1.61 | (2.38) | ||||||
Total from investment operations | (0.51) | (4.96) | 3.80 | (0.15) | 3.26 | (0.65) | ||||||
| Distributions paid to shareholders from: | ||||||||||||
Net investment income | (0.67) | (1.40) | (1.48) | (1.45) | (1.64) | (1.70) | ||||||
Return of capital | — | (0.10) | (0.05) | (0.14) | (0.06) | (0.07) | ||||||
Total distributions paid to Common Shareholders | (0.67) | (1.50) | (1.53) | (1.59) | (1.70) | (1.77) | ||||||
Net asset value, end of period | $ | $18.47 | $24.93 | $22.66 | $24.40 | $22.84 | ||||||
Market value, end of period | $ | $16.39 | $25.48 | $21.56 | $24.07 | $20.47 | ||||||
Total return based on net asset value (a) | (2.74)% | (20.30)% | 17.25% | (0.05)% | 15.44% | (2.23)% | ||||||
Total return based on market value (a) | (0.53)% | (30.77)% | 25.89% | (3.60)% | 27.06% | (10.78)% | ||||||
| Ratios to average net assets/supplemental data: | ||||||||||||
Net assets, end of period (in 000’s) | $ 1,052,225 | $ 1,123,887 | $ 1,516,364 | $ 1,376,701 | $ 1,482,428 | $ 1,387,961 | ||||||
Ratio of total expenses to average net assets | 4.10% (b) | 2.22% | 1.72% | 1.98% | 2.70% | 2.49% | ||||||
Ratio of total expenses to average net assets excluding interest expense | 1.42% (b) | 1.35% | 1.33% | 1.31% | 1.33% | 1.33% | ||||||
Ratio of net investment income (loss) to average net assets | 6.47% (b) | 6.59% | 6.44% | 6.93% | 7.14% | 7.21% | ||||||
Portfolio turnover rate | 24% | 25% | 39% | 45% | 40% | 29% | ||||||
| Indebtedness: | ||||||||||||
Total loan and repurchase agreement outstanding (in 000’s) | $ 543,100 | $ 549,600 | $ 676,000 | $ 616,000 | $ 646,000 | $ 620,000 | ||||||
Asset coverage per $1,000 of indebtedness (c) | $ 2,937 | $ 3,045 | $ 3,243 | $ 3,235 | $ 3,295 | $ 3,239 | ||||||
| (a) | Total return is based on the combination of reinvested dividend, capital gain and return of capital distributions, if any, at prices obtained by the Dividend Reinvestment Plan, and changes in net asset value per share for net asset value returns and changes in Common Share Price for market value returns. Total returns do not reflect sales load and are not annualized for periods of less than one year. Past performance is not indicative of future results. |
| (b) | Annualized. |
| (c) | Calculated by subtracting the Fund’s total liabilities (not including the loan and repurchase agreement outstanding) from the Fund’s total assets, and dividing by the outstanding loan and repurchase agreement balances in 000’s. |
| 1) | benchmark yields; |
| 2) | reported trades; |
| 3) | broker/dealer quotes; |
| 4) | issuer spreads; |
| 5) | benchmark securities; |
| 6) | bids and offers; and |
| 7) | reference data including market research publications. |
| 1) | the last sale price on the exchange on which they are principally traded or, for Nasdaq and AIM securities, the official closing price; |
| 2) | the type of security; |
| 3) | the size of the holding; |
| 4) | the initial cost of the security; |
| 5) | transactions in comparable securities; |
| 6) | price quotes from dealers and/or third-party pricing services; |
| 7) | relationships among various securities; |
| 8) | information obtained by contacting the issuer, analysts, or the appropriate stock exchange; |
| 9) | an analysis of the issuer’s financial statements; |
| 10) | the existence of merger proposals or tender offers that might affect the value of the security; and |
| 11) | other relevant factors. |
| 1) | the value of similar foreign securities traded on other foreign markets; |
| 2) | ADR trading of similar securities; |
| 3) | closed-end fund or exchange-traded fund trading of similar securities; |
| 4) | foreign currency exchange activity; |
| 5) | the trading prices of financial products that are tied to baskets of foreign securities; |
| 6) | factors relating to the event that precipitated the pricing problem; |
| 7) | whether the event is likely to recur; |
| 8) | whether the effects of the event are isolated or whether they affect entire markets, countries or regions; and |
| 9) | other relevant factors. |
| • | Level 1 – Level 1 inputs are quoted prices in active markets for identical investments. An active market is a market in which transactions for the investment occur with sufficient frequency and volume to provide pricing information on an ongoing basis. |
| • | Level 2 – Level 2 inputs are observable inputs, either directly or indirectly, and include the following: |
| o | Quoted prices for similar investments in active markets. |
| o | Quoted prices for identical or similar investments in markets that are non-active. A non-active market is a market where there are few transactions for the investment, the prices are not current, or price quotations vary substantially either over time or among market makers, or in which little information is released publicly. |
| o | Inputs other than quoted prices that are observable for the investment (for example, interest rates and yield curves observable at commonly quoted intervals, volatilities, prepayment speeds, loss severities, credit risks, and default rates). |
| o | Inputs that are derived principally from or corroborated by observable market data by correlation or other means. |
| • | Level 3 – Level 3 inputs are unobservable inputs. Unobservable inputs may reflect the reporting entity’s own assumptions about the assumptions that market participants would use in pricing the investment. |
| Security | Acquisition Date | Principal Value/Shares | Current Price | Carrying Cost | Value | % of Net Assets | ||
| Credit Suisse Group AG, 5.25% | 8/4/20 - 6/7/22 | $19,220,000 | $— | $19,020,560 | $— | —% | ||
| Credit Suisse Group AG, 6.38% | 8/14/19 - 8/19/22 | $15,730,000 | — | 15,308,000 | — | — | ||
| Credit Suisse Group AG, 7.50% | 7/19/18 - 3/4/21 | $28,250,000 | — | 29,635,527 | — | — | ||
| Credit Suisse Group AG, 9.75% | 6/16/22 - 12/5/22 | $6,400,000 | — | 6,250,500 | — | — | ||
| Dairy Farmers of America, Inc., 7.13% | 9/15/16 | $6,000,000 | 85.75 | 6,000,000 | 5,145,000 | 0.49 | ||
| Fortegra Financial Corp., 8.50%, 10/15/57 | 10/12/17 - 3/12/18 | $15,300,000 | 94.50 | 15,343,691 | 14,458,500 | 1.37 | ||
| FT Real Estate Securities Co., Inc., 9.50% | 6/15/16 | 12 | 1,050,000.00 | 15,990,000 | 12,600,000 | 1.20 | ||
| Land O’Lakes Capital Trust I, 7.45%, 03/15/28 | 3/20/15 - 2/25/19 | $7,329,000 | 94.75 | 7,650,552 | 6,944,228 | 0.66 | ||
| $115,198,830 | $39,147,728 | 3.72% |
| Gross Amounts not Offset in the Statement of Assets and Liabilities | |||||||||||
| Gross Amounts of Recognized Liabilities | Gross Amounts Offset in the Statement of Assets and Liabilities | Net Amounts of Liabilities Presented in the Statement of Assets and Liabilities | Financial Instruments | Cash Segregated as Collateral | Net Amount | ||||||
| Reverse Repurchase Agreement | $ (100,000,000) | $ — | $ (100,000,000) | $ 100,000,000 | $ — | $ — | |||||
| Distributions paid from: | |
Ordinary income | $85,119,106 |
Capital gains | — |
Return of capital | 6,147,414 |
Undistributed ordinary income | $— |
Undistributed capital gains | — |
Total undistributed earnings | — |
Accumulated capital and other losses | (61,989,983) |
Net unrealized appreciation (depreciation) | (239,402,854) |
Total accumulated earnings (losses) | (301,392,837) |
Other | — |
Paid-in capital | 1,425,279,590 |
Total net assets | $1,123,886,753 |
| Tax Cost | Gross Unrealized Appreciation | Gross Unrealized (Depreciation) | Net Unrealized Appreciation (Depreciation) | |||
| $1,810,301,670 | $11,049,573 | $(242,874,306) | $(231,824,733) |
| (1) | If Common Shares are trading at or above net asset value (“NAV”) at the time of valuation, the Fund will issue new shares at a price equal to the greater of (i) NAV per Common Share on that date or (ii) 95% of the market price on that date. |
| (2) | If Common Shares are trading below NAV at the time of valuation, the Plan Agent will receive the dividend or distribution in cash and will purchase Common Shares in the open market, on the NYSE or elsewhere, for the participants’ accounts. It is possible that the market price for the Common Shares may increase before the Plan Agent has completed its purchases. Therefore, the average purchase price per share paid by the Plan Agent may exceed the market price at the time of valuation, resulting in the purchase of fewer shares than if the dividend or distribution had been paid in Common Shares issued by the Fund. The Plan Agent will use all dividends and distributions received in cash to purchase Common Shares in the open market within 30 days of the valuation date except where temporary curtailment or suspension of purchases is necessary to comply with federal securities laws. Interest will not be paid on any uninvested cash payments. |
| • | Issuer Risk. The value of these securities may decline for a number of reasons which directly relate to the issuer, such as management performance, leverage and reduced demand for the issuer’s goods and services. |
| • | Interest Rate Risk. Interest rate risk is the risk that fixed rate securities will decline in value because of changes in market interest rates. When market interest rates rise, the market value of fixed rate securities generally will fall. Market value generally falls further for fixed rate securities with longer duration. During periods of rising interest rates, the average life of certain types of securities may be extended because of slower than expected prepayments. This may lock in a below-market yield, increase the security’s duration and further reduce the value of the security. Investments in fixed rate securities with long-term maturities may experience significant price declines if long-term interest rates increase. |
| • | Floating Rate and Fixed-to-Floating Rate Risk. The market value of floating rate and fixed-to-floating rate securities may fall in a declining interest rate environment and may also fall in a rising interest rate environment if there is a lag between the rise in interest rates and the interest rate reset. Securities with a floating or variable interest rate component can be less sensitive to interest rate changes than securities with fixed interest rates. A secondary risk associated with declining interest rates is the risk that income earned by the Fund on floating rate and fixed-to-floating rate securities may decline due to lower coupon payments on floating rate securities. |
| • | Prepayment Risk. Prepayment risk is the risk that the issuer of a debt security will repay principal prior to the scheduled maturity date. During periods of declining interest rates, the issuer of a security may exercise its option to prepay principal earlier than scheduled, forcing the Fund to reinvest the proceeds from such prepayment in lower yielding securities, which may result in a decline in the Fund’s income and distributions to common shareholders. |
| • | Reinvestment Risk. Reinvestment risk is the risk that income from the Fund’s portfolio will decline if the Fund invests the proceeds from matured, traded or called securities at market interest rates that are below the Fund portfolio’s current earnings rate. |
| • | Subordination Risk. Preferred securities are typically subordinated to bonds and other debt instruments in a company’s capital structure, in terms of priority to corporate income and liquidation payments, and therefore will be subject to greater credit risk than those debt instruments. |
| (b) | Not applicable. |
Item 2. Code of Ethics.
Not applicable.
Item 3. Audit Committee Financial Expert.
Not applicable.
Item 4. Principal Accountant Fees and Services.
Not applicable.
Item 5. Audit Committee of Listed Registrants.
Not applicable.
Item 6. Investments.
| (a) | Schedule of Investments in securities of unaffiliated issuers as of the close of the reporting period is included as part of the report to shareholders filed under Item 1 of this form. |
| (b) | Not applicable. |
Item 7. Disclosure of Proxy Voting Policies and Procedures for Closed-End Management Investment Companies.
Not applicable.
Item 8. Portfolio Managers of Closed-End Management Investment Companies.
| (a) | Not applicable. |
| (b) | Not applicable. |
Item 9. Purchases of Equity Securities by Closed-End Management Investment Company and Affiliated Purchasers.
Not applicable.
Item 10. Submission of Matters to a Vote of Security Holders.
There have been no material changes to the procedures by which the shareholders may recommend nominees to the registrant’s board of directors, where those changes were implemented after the registrant last provided disclosure in response to the requirements of Item 407(c)(2)(iv) of Regulation S-K (17 CFR 229.407) (as required by Item 22(b)(15) of Schedule 14A (17 CFR 240.14a-101)), or this Item.
Item 11. Controls and Procedures.
| (a) | The registrant’s principal executive and principal financial officers, or persons performing similar functions, have concluded that the registrant’s disclosure controls and procedures (as defined in Rule 30a-3(c) under the Investment Company Act of 1940, as amended (the “1940 Act”) (17 CFR 270.30a-3(c))) are effective, as of a date within 90 days of the filing date of the report that includes the disclosure required by this paragraph, based on their evaluation of these controls and procedures required by Rule 30a-3(b) under the 1940 Act (17 CFR 270.30a-3(b)) and Rules 13a-15(b) or 15d-15(b) under the Securities Exchange Act of 1934, as amended (17 CFR 240.13a-15(b) or 240.15d-15(b)). |
| (b) | There were no changes in the registrant’s internal control over financial reporting (as defined in Rule 30a-3(d) under the 1940 Act (17 CFR 270.30a-3(d)) that occurred during the period covered by this report that has materially affected, or is reasonably likely to materially affect, the registrant’s internal control over financial reporting. |
Item 12. Disclosure of Securities Lending Activities for Closed-End Management Investment Companies.
| (a) | Not applicable. |
| (b) | Not applicable. |
Item 13. Exhibits.
| (a)(1) | Not Applicable. |
| (a)(2) | Certifications pursuant to Rule 30a-2(a) under the 1940 Act and Section 302 of the Sarbanes-Oxley Act of 2002 are attached hereto. |
| (a)(3) | Not applicable. |
| (a)(4) | Not applicable. |
| (b) | Certifications pursuant to Rule 30a-2(b) under the 1940 Act and Section 906 of the Sarbanes-Oxley Act of 2002 are attached hereto. |
SIGNATURES
Pursuant to the requirements of the Securities Exchange Act of 1934 and the Investment Company Act of 1940, the registrant has duly caused this report to be signed on its behalf by the undersigned, thereunto duly authorized.
| (registrant) | First Trust Intermediate Duration Preferred & Income Fund |
| By (Signature and Title)* | /s/ James M. Dykas | |
| James M. Dykas, President and Chief Executive Officer (principal executive officer) |
| Date: | July 10, 2023 |
Pursuant to the requirements of the Securities Exchange Act of 1934 and the Investment Company Act of 1940, this report has been signed below by the following persons on behalf of the registrant and in the capacities and on the dates indicated.
| By (Signature and Title)* | /s/ James M. Dykas | |
| James M. Dykas, President and Chief Executive Officer (principal executive officer) |
| Date: | July 10, 2023 |
| By (Signature and Title)* | /s/ Donald P. Swade | |
| Donald P. Swade, Treasurer, Chief Financial Officer and Chief Accounting Officer (principal financial officer) |
| Date: | July 10, 2023 |
* Print the name and title of each signing officer under his or her signature.
Certification Pursuant to Rule 30a-2(a)
under the 1940 Act and Section 302
of the Sarbanes-Oxley Act
I, James M. Dykas, certify that:
| 1. | I have reviewed this report on Form N-CSR of First Trust Intermediate Duration Preferred & Income Fund; |
| 2. | Based on my knowledge, this report does not contain any untrue statement of a material fact or omit to state a material fact necessary to make the statements made, in light of the circumstances under which such statements were made, not misleading with respect to the period covered by this report; |
| 3. | Based on my knowledge, the financial statements, and other financial information included in this report, fairly present in all material respects the financial condition, results of operations, changes in net assets, and cash flows (if the financial statements are required to include a statement of cash flows) of the registrant as of, and for, the periods presented in this report; |
| 4. | The registrant’s other certifying officer(s) and I are responsible for establishing and maintaining disclosure controls and procedures (as defined in Rule 30a-3(c) under the Investment Company Act of 1940) and internal control over financial reporting (as defined in Rule 30a-3(d) under the Investment Company Act of 1940) for the registrant and have: |
| (a) | Designed such disclosure controls and procedures, or caused such disclosure controls and procedures to be designed under our supervision, to ensure that material information relating to the registrant, including its consolidated subsidiaries, is made known to us by others within those entities, particularly during the period in which this report is being prepared; |
| (b) | Designed such internal control over financial reporting, or caused such internal control over financial reporting to be designed under our supervision, to provide reasonable assurance regarding the reliability of financial reporting and the preparation of financial statements for external purposes in accordance with generally accepted accounting principles; |
| (c) | Evaluated the effectiveness of the registrant’s disclosure controls and procedures and presented in this report our conclusions about the effectiveness of the disclosure controls and procedures, as of a date within 90 days prior to the filing date of this report based on such evaluation; and |
| (d) | Disclosed in this report any change in the registrant’s internal control over financial reporting that occurred during the period covered by this report that has materially affected, or is reasonably likely to materially affect, the registrant’s internal control over financial reporting; and |
| 5. | The registrant’s other certifying officer(s) and I have disclosed to the registrant’s auditors and the audit committee of the registrant’s board of directors (or persons performing the equivalent functions): |
| (a) | All significant deficiencies and material weaknesses in the design or operation of internal control over financial reporting which are reasonably likely to adversely affect the registrant’s ability to record, process, summarize, and report financial information; and |
| (b) | Any fraud, whether or not material, that involves management or other employees who have a significant role in the registrant’s internal control over financial reporting. |
| Date: | July 10, 2023 | /s/ James M. Dykas | |||
| James M. Dykas, President and Chief Executive Officer (principal executive officer) |
Certification Pursuant to Rule 30a-2(a)
under the 1940 Act and Section 302
of the Sarbanes-Oxley Act
I, Donald P. Swade, certify that:
| 1. | I have reviewed this report on Form N-CSR of First Trust Intermediate Duration Preferred & Income Fund; |
| 2. | Based on my knowledge, this report does not contain any untrue statement of a material fact or omit to state a material fact necessary to make the statements made, in light of the circumstances under which such statements were made, not misleading with respect to the period covered by this report; |
| 3. | Based on my knowledge, the financial statements, and other financial information included in this report, fairly present in all material respects the financial condition, results of operations, changes in net assets, and cash flows (if the financial statements are required to include a statement of cash flows) of the registrant as of, and for, the periods presented in this report; |
| 4. | The registrant’s other certifying officer(s) and I are responsible for establishing and maintaining disclosure controls and procedures (as defined in Rule 30a-3(c) under the Investment Company Act of 1940) and internal control over financial reporting (as defined in Rule 30a-3(d) under the Investment Company Act of 1940) for the registrant and have: |
| (a) | Designed such disclosure controls and procedures, or caused such disclosure controls and procedures to be designed under our supervision, to ensure that material information relating to the registrant, including its consolidated subsidiaries, is made known to us by others within those entities, particularly during the period in which this report is being prepared; |
| (b) | Designed such internal control over financial reporting, or caused such internal control over financial reporting to be designed under our supervision, to provide reasonable assurance regarding the reliability of financial reporting and the preparation of financial statements for external purposes in accordance with generally accepted accounting principles; |
| (c) | Evaluated the effectiveness of the registrant’s disclosure controls and procedures and presented in this report our conclusions about the effectiveness of the disclosure controls and procedures, as of a date within 90 days prior to the filing date of this report based on such evaluation; and |
| (d) | Disclosed in this report any change in the registrant’s internal control over financial reporting that occurred during the period covered by this report that has materially affected, or is reasonably likely to materially affect, the registrant’s internal control over financial reporting; and |
| 5. | The registrant’s other certifying officer(s) and I have disclosed to the registrant’s auditors and the audit committee of the registrant’s board of directors (or persons performing the equivalent functions): |
| (a) | All significant deficiencies and material weaknesses in the design or operation of internal control over financial reporting which are reasonably likely to adversely affect the registrant’s ability to record, process, summarize, and report financial information; and |
| (b) | Any fraud, whether or not material, that involves management or other employees who have a significant role in the registrant’s internal control over financial reporting. |
| Date: | July 10, 2023 | /s/ Donald P. Swade | |||
| Donald P. Swade, Treasurer, Chief Financial Officer and Chief Accounting Officer (principal financial officer) |
Certification Pursuant to Rule 30a-2(b) under
the 1940 Act and Section 906
of the Sarbanes-Oxley Act
I, James M. Dykas, President and Chief Executive Officer of First Trust Intermediate Duration Preferred & Income Fund (the “Registrant”), certify that:
| 1. | The Form N-CSR of the Registrant (the “Report”) fully complies with the requirements of Section 13(a) or 15(d) of the Securities Exchange Act of 1934, as amended; and |
| 2. | The information contained in the Report fairly presents, in all material respects, the financial condition and results of operations of the Registrant. |
| Date: | July 10, 2023 | /s/ James M. Dykas | |||
| James M. Dykas, President and Chief Executive Officer (principal executive officer) |
I, Donald P. Swade, Treasurer, Chief Financial Officer and Chief Accounting Officer of First Trust Intermediate Duration Preferred & Income Fund (the “Registrant”), certify that:
| 1. | The Form N-CSR of the Registrant (the “Report”) fully complies with the requirements of Section 13(a) or 15(d) of the Securities Exchange Act of 1934, as amended; and |
| 2. | The information contained in the Report fairly presents, in all material respects, the financial condition and results of operations of the Registrant. |
| Date: | July 10, 2023 | /s/ Donald P. Swade | |||
| Donald P. Swade, Treasurer, Chief Financial Officer and Chief Accounting Officer (principal financial officer) |
N-2 |
6 Months Ended | ||||||||||||
|---|---|---|---|---|---|---|---|---|---|---|---|---|---|
|
Apr. 30, 2023
$ / shares
shares
| |||||||||||||
| Cover [Abstract] | |||||||||||||
| Entity Central Index Key | 0001567569 | ||||||||||||
| Amendment Flag | false | ||||||||||||
| Entity Inv Company Type | N-2 | ||||||||||||
| Document Type | N-CSRS | ||||||||||||
| Entity Registrant Name | First Trust Intermediate Duration Preferred & Income Fund | ||||||||||||
| General Description of Registrant [Abstract] | |||||||||||||
| Risk Factors [Table Text Block] | Principal Risks
The Fund is a closed-end
management investment company designed primarily as a long-term investment and not as a trading vehicle. The Fund is not intended to be a complete investment program and, due to the uncertainty inherent in all
investments, there can be no assurance that the Fund will achieve its investment objectives. The following discussion summarizes the principal risks associated with investing in the Fund, which includes the risk that
you could lose some or all of your investment in the Fund. The Fund is subject to the informational requirements of the Securities Exchange Act of 1934 and the Investment Company Act of 1940 and, in accordance
therewith, files reports, proxy statements and other information that is available for review.
Contingent Convertible
Securities Risk. CoCos are hybrid securities most commonly issued by banking institutions that present risks similar to debt securities and convertible securities. CoCos are distinct in that they are
intended to either convert into equity or have their principal written down upon the occurrence of certain “triggers.” When an issuer’s capital ratio falls below a specified trigger level, or in a
regulator’s discretion depending on the regulator’s judgment about the issuer’s solvency prospects, a CoCo may be written down, written off or converted into an equity security. Due to the contingent
write-down, write-off and conversion feature, CoCos may have substantially greater risk than other securities in times of financial stress. If the trigger level is breached, the issuer’s decision to write down,
write off or convert a CoCo may be outside its control, and the Fund may suffer a complete loss on an investment in CoCos with no chance of recovery even if the issuer remains in existence. CoCos are usually issued in
the form of subordinated debt instruments to provide the appropriate regulatory capital treatment. If an issuer liquidates, dissolves or winds-up before a conversion to equity has occurred, the rights and claims of
the holders of the CoCos (such as the Fund) against the issuer generally rank junior to the claims of holders of unsubordinated obligations of the issuer. In addition, if the CoCos are converted into the
issuer’s underlying equity securities after a conversion event (i.e., a “trigger”), each holder will be further subordinated. CoCos also may have no stated maturity and have fully discretionary
coupons. This means coupon payments can be canceled at the issuer’s discretion or at the request of the relevant regulatory authority in order to help the bank absorb losses, without causing a default. In
general, the value of CoCos is unpredictable and is influenced by many factors including, without limitation: the creditworthiness of the issuer and/or fluctuations in such issuer’s applicable capital ratios;
supply and demand for CoCos; general market conditions and available liquidity; and economic, financial and political events that affect the issuer, its particular market or the financial markets in general.
Credit Agency Risk. Credit ratings are determined by credit rating agencies and are only the opinions of such entities. Ratings assigned by a rating agency are not absolute standards of credit quality
and do not evaluate market risk or the liquidity of securities. Any shortcomings or inefficiencies in credit rating agencies’ processes for determining credit ratings may adversely affect the credit ratings of
securities held by the Fund or such credit rating agency’s ability to evaluate creditworthiness and, as a result, may adversely affect those securities’ perceived or actual credit risk.
Credit and Below-Investment
Grade Securities Risk. Credit risk is the risk that the issuer or other obligated party of a debt security in the Fund’s portfolio will fail to pay, or it is perceived that it will fail to pay, dividends
or interest and/or repay principal when due. Below-investment grade instruments, including instruments that are not rated but judged to be of comparable quality, are commonly referred to as high-yield securities or
“junk” bonds and are considered speculative with respect to the issuer’s capacity to pay dividends or interest and repay principal and are more susceptible to default or decline in market value than
investment grade securities due to adverse economic and business developments. High-yield securities are often unsecured and subordinated to other creditors of the issuer. The market values for high-yield securities
tend to be very volatile, and these securities are generally less liquid than investment grade securities. For these reasons, an investment in the Fund is subject to the following specific risks: (i) increased price
sensitivity to changing interest rates and to a deteriorating economic environment; (ii) greater risk of loss due to default or declining credit quality; (iii) adverse company specific events more likely to render the
issuer unable to make dividend, interest and/or principal payments; (iv) negative perception of the high-yield market which may depress the price and liquidity of high-yield securities; (v) volatility; and (vi)
liquidity.
Cyber Security Risk. The Fund is susceptible to potential operational risks through breaches in cyber security. A breach in cyber security refers to both intentional and unintentional events that may cause the
Fund to lose proprietary information, suffer data corruption or lose operational capacity. Such events could cause the Fund to incur regulatory penalties, reputational damage, additional compliance costs associated
with corrective measures and/or financial loss. Cyber security breaches may involve unauthorized access to the Fund’s digital information systems through “hacking” or malicious software coding, but
may also result from outside attacks such as denial-of-service attacks through efforts to make network services unavailable to intended users. In addition, cyber security breaches of the Fund’s third-party
service providers, such as its administrator, transfer agent, custodian, or Sub-Advisor, as applicable, or issuers in which the Fund invests, can also subject the Fund to many of the same risks associated with direct
cyber security breaches. The Fund has established risk management systems designed to reduce the risks associated with cyber security. However, there is no guarantee that such efforts will succeed, especially because
the Fund does not directly control the cyber security systems of issuers or third party service providers. Substantial costs may be incurred by the Fund in order to resolve or prevent cyber incidents in the
future.
Illiquid and Restricted
Securities Risk. The Fund may invest in securities that are restricted and/or illiquid securities. Restricted securities are securities that cannot be offered for public resale unless
registered under the applicable securities laws or that have a contractual restriction that prohibits or limits their resale. Restricted securities may be illiquid as they generally are not listed on an exchange
and may have no active trading market. Investments in restricted securities could have the effect of increasing the amount of the Fund’s assets invested in illiquid securities if qualified institutional buyers
are unwilling to purchase these securities. Illiquid and restricted securities may be difficult to dispose of at a fair price at the times when the Fund believes it is desirable to do so. The market price of illiquid
and restricted securities generally is more volatile than that of more liquid securities, which may adversely affect the price that the Fund pays for or recovers upon the sale of such securities. Illiquid and
restricted securities are also more difficult to value, especially in challenging markets.
Inflation Risk. The Fund invests in securities that are subject to inflation risk. Inflation risk is the risk that the value of assets or income from investments will be worth less in the future as
inflation decreases the value of money. As inflation increases, the present value of the Fund’s assets and distributions may decline. This risk is more prevalent with respect to debt securities. Inflation
creates uncertainty over the future real value (after inflation) of an investment. Inflation rates may change frequently and drastically as a result of various factors, including unexpected shifts in the domestic or
global economy, and the Fund’s investments may not keep pace with inflation, which may result in losses to Fund investors.
Interest Rate and Duration
Risk. Interest rate risk is the risk that securities will decline in value because of changes in market interest rates. For fixed rate securities, when market interest rates rise,
the market value of such securities generally will fall. Investments in fixed rate securities with long-term maturities may experience significant price declines if long-term interest rates increase.
During periods of rising interest rates, the average life of certain types of securities may be extended because of slower than expected prepayments. This may lock in a below-market yield, increase the
security’s duration and further reduce the value of the security. Fixed rate securities with longer durations tend to be more sensitive to changes in interest rates, usually making them more volatile than
securities with shorter durations. The duration of a security will be expected to change over time with changes in market factors and time to maturity. Although the Fund seeks to maintain a duration, under
normal market circumstances, excluding the effects of leverage, of between three and eight years, if the effect of the Fund’s use of leverage was included in calculating duration, it could result in a longer
duration for the Fund.
The interest rates
payable on floating rate securities are not fixed and may fluctuate based upon changes in market rates. As short-term interest rates decline, interest payable on floating rate securities typically decreases.
Alternatively, during periods of rising interest rates, interest payable on floating rate securities typically increases. Changes in interest rates on floating rate securities may lag behind changes in
market rates or may have limits on the maximum increases in interest rates. The value of floating rate securities may decline if their interest rates do not rise as much, or as quickly, as interest rates in
general.
Many financial
instruments use or may use a floating rate based upon the LIBOR. The United Kingdom’s Financial Conduct Authority (the “FCA”), which regulates LIBOR, intends to cease making LIBOR available as a
reference rate over a phase-out period that began in early 2022. However, subsequent announcements by the FCA, the LIBOR administrators, and other regulators indicate that it is possible that the most widely used
LIBOR rates may continue until mid-2023. The unavailability or replacement of LIBOR may affect the value, liquidity or return on certain Fund investments and may result in costs incurred in connection with closing out
positions and entering into new trades. Any potential effects of the transition away from LIBOR on the Fund or on certain instruments in which the Fund invests can be difficult to ascertain, and they may vary
depending on a variety of factors. In the United States, it is anticipated that in many instances the Secured Overnight Financing Rate (“SOFR”) will replace LIBOR as the reference rate for many floating
rate instruments. There is no assurance that the composition or characteristics of SOFR, or any alternative reference rate, will be similar to or produce the same value or economic equivalence as LIBOR or that
instruments using an alternative rate will have the same volume or liquidity. As a result, the transition process might lead to increased volatility and reduced liquidity in markets that
currently rely on LIBOR to determine
interest rates; a reduction in the value of some LIBOR-based investments; increased difficulty in borrowing or refinancing and diminished effectiveness of any applicable hedging strategies against instruments whose
terms currently include LIBOR; and/ or costs incurred in connection with temporary borrowings and closing out positions and entering into new agreements. Any such effects (as well as other unforeseen effects) of the
transition away from LIBOR and the adoption of alternative reference rates could result in losses to the Fund.
Interest Rate Swaps
Risk. If short-term interest rates are lower than the Fund’s fixed rate of payment on an interest rate swap, the swap will reduce common share net earnings. In addition, a default by
the counterparty to a swap transaction could also negatively impact the performance of the common shares.
Leverage Risk. The use of leverage by the Fund can magnify the effect of any losses. If the income and gains from the securities and investments purchased with leverage proceeds do not cover the cost of
leverage, the return to the common shares will be less than if leverage had not been used. Leverage involves risks and special considerations for common shareholders including: (i) the likelihood of greater volatility
of net asset value and market price of the common shares than a comparable portfolio without leverage; (ii) the risk that fluctuations in interest rates on borrowings will reduce the return to the common shareholders
or will result in fluctuations in the dividends paid on the common shares; (iii) in a declining market, the use of leverage is likely to cause a greater decline in the net asset value of the common shares than if the
Fund were not leveraged, which may result in a greater decline in the market price of the common shares; and (iv) when the Fund uses certain types of leverage, the investment advisory fee payable to the Advisor and by
the Advisor to the Sub-Advisor will be higher than if the Fund did not use leverage.
Management Risk and
Reliance on Key Personnel. The implementation of the Fund’s investment strategy depends upon the continued contributions of certain key employees of the Advisor and Sub-Advisor, some of whom have unique
talents and experience and would be difficult to replace. The loss or interruption of the services of a key member of the portfolio management team could have a negative impact on the Fund.
Market Discount from Net
Asset Value. Shares of closed-end investment companies such as the Fund frequently trade at a discount from their net asset value. The Fund cannot predict whether its common shares will trade
at, below or above net asset value.
Market Risk. Securities held by the Fund, as well as shares of the Fund itself, are subject to market fluctuations caused by factors such as general economic conditions, political events, regulatory or
market developments, changes in interest rates and perceived trends in securities prices. Shares of the Fund could decline in value or underperform other investments as a result of the risk of loss associated with
these market fluctuations. In addition, local, regional or global events such as war, acts of terrorism, spread of infectious diseases or other public health issues, recessions, or other events could have a
significant negative impact on the Fund and its investments. For example, the coronavirus (COVID-19) global pandemic and the aggressive responses taken by many governments, including closing borders, restricting
international and domestic travel, and the imposition of prolonged quarantines or similar restrictions, had negative impacts, and in many cases severe impacts, on markets worldwide. While the development of vaccines
has slowed the spread of the virus and allowed for the resumption of reasonably normal business activity in the United States, many countries continue to impose lockdown measures in an attempt to slow the spread.
Additionally, there is no guarantee that vaccines will be effective against emerging variants of the disease. Also, in February 2022, Russia invaded Ukraine which has caused and could continue to cause significant
market disruptions and volatility across markets globally, including the United States. The hostilities and sanctions resulting from those hostilities could have a significant impact on certain Fund investments as
well as Fund performance. As the global pandemic and conflict in Ukraine have illustrated, such events may affect certain geographic regions, countries, sectors and industries more significantly than others.
Recent and potential future bank failures could result in disruption to the broader banking industry or markets generally and reduce confidence in financial institutions and the economy as a whole, which may also
heighten market volatility and reduce liquidity. These events also may adversely affect the prices and liquidity of the Fund’s portfolio securities or other instruments and could result in disruptions in the
trading markets. Any of such circumstances could have a materially negative impact on the value of the Fund’s shares and result in increased market volatility. During any such events, the Fund’s shares may
trade at increased premiums or discounts to their net asset value and the bid/ask spread on the Fund’s shares may widen.
Non-U.S. Securities
Risk. Investing in securities of non-U.S. issuers, which are generally denominated in non-U.S. currencies, may involve certain risks not typically associated with investing in securities
of U.S. issuers. These risks include: (i) there may be less publicly available information about non-U.S. issuers or markets due to less rigorous disclosure or accounting standards or regulatory practices; (ii)
non-U.S. markets may be smaller, less liquid and more volatile than the U.S. market; (iii) potential adverse effects of fluctuations in currency exchange rates or controls on the value of the Fund’s investments;
(iv) the economies of non-U.S. countries may grow at slower rates than expected or may experience a downturn or recession; (v) the impact of economic, political, social or diplomatic events; (vi) certain non-U.S.
countries may impose restrictions on the ability of non-U.S. issuers to make payments of principal and interest to investors located in the United States due to blockage of non-U.S. currency exchanges or otherwise;
and (vii) withholding and other non-U.S. taxes may decrease the Fund’s return. Foreign companies are generally not subject to the same accounting, auditing and financial reporting standards as are U.S.
companies. In addition, there may be difficulty in obtaining or
enforcing a court judgment abroad. These
risks may be more pronounced to the extent that the Fund invests a significant amount of its assets in companies located in one region or in emerging markets.
Operational Risk. The Fund is subject to risks arising from various operational factors, including, but not limited to, human error, processing and communication errors, errors of the Fund’s service
providers, counterparties or other third-parties, failed or inadequate processes and technology or systems failures. The Fund relies on third-parties for a range of services, including custody. Any delay or failure
relating to engaging or maintaining such service providers may affect the Fund’s ability to meet its investment objective. Although the Fund and the Fund’s investment advisor seek to reduce these
operational risks through controls and procedures, there is no way to completely protect against such risks.
Potential Conflicts on
Interest Risk. First Trust, Stonebridge and the portfolio managers have interests which may conflict with the interests of the Fund. In particular, First Trust and Stonebridge currently manage and may
in the future manage and/or advise other investment funds or accounts with the same or substantially similar investment objective and strategies as the Fund. In addition, while the Fund is using leverage, the amount
of the fees paid to First Trust (and by First Trust to Stonebridge) for investment advisory and management services are higher than if the Fund did not use leverage because the fees paid are calculated based on
managed assets. Therefore, First Trust and Stonebridge have a financial incentive to leverage the Fund.
Preferred/Hybrid Preferred
and Debt Securities Risk. An investment in preferred/hybrid preferred and debt securities is subject to certain risks, including:
In addition, preferred
and hybrid preferred securities are subject to certain other risks, including deferral and omission risk, limited voting rights risk and special redemption rights risk.
Reverse Repurchase
Agreements Risk. The Fund’s use of reverse repurchase agreements may involve leverage risk. There is also the risk that the market value of the securities acquired with the proceeds of the reverse
repurchase agreement may decline below the price of the securities that the Fund has sold but remains obligated to repurchase. In addition, there is a risk that the market value of the securities retained by the Fund
may decline. Reverse repurchase agreements also involve the risk that the purchaser fails to return the securities as agreed upon, files for bankruptcy or becomes insolvent. The Fund may be restricted from taking
normal portfolio actions during such time, could be subject to loss to the extent that the proceeds of the agreement are less than the value of securities subject to the agreement and may experience adverse tax
consequences.
Risks of Concentration in
the Financials Sector. Because the Fund invests 25% or more of its managed assets in the financials sector, it will be more susceptible to adverse economic or regulatory occurrences affecting this sector, such
as changes in interest rates, loan concentration and competition. The Fund may emphasize its investments in certain industries such as the banking and insurance
industries and therefore may make the
Fund more economically vulnerable in the event of a downturn in those industries. Financial companies are subject to extensive governmental regulation and intervention, which may adversely affect the scope of their
activities, the prices they can charge, the amount and types of capital they must maintain and, potentially, their size. Governmental regulation may change frequently and may have significant adverse consequences for
financial companies, including effects not intended by such regulation. The impact of more stringent capital requirements, or recent or future regulation in various countries, on any individual financial company or on
financial companies as a whole cannot be predicted. Certain risks may impact the value of investments in financial companies more severely than those of investments in other issuers, including the risks associated
with companies that operate with substantial financial leverage. Financial companies may also be adversely affected by volatility in interest rates, loan losses and other customer defaults, decreases in the
availability of money or asset valuations, credit rating downgrades and adverse conditions in other related markets. Insurance companies in particular may be subject to severe price competition and/or rate regulation,
which may have an adverse impact on their profitability. Financial companies are also a target for cyber attacks and may experience technology malfunctions and disruptions as a result.
Trust Preferred Securities
Risk. The risks associated with trust preferred securities typically include the financial condition of the financial institution that creates the trust, as the trust typically has no
business operations other than holding the subordinated debt issued by the financial institution and issuing the trust preferred securities and common stock backed by the subordinated debt. If a financial institution
is financially unsound and defaults on interest payments to the trust, the trust will not be able to make payments to holders of the trust preferred securities such as the Fund. The issuer of trust preferred
securities is generally able to defer or skip payments for up to five years without being in default and certain enhanced trust preferred securities may have longer interest payment deferral periods.
Valuation Risk. Unlike publicly traded common stock which trades on national exchanges, there is no central place or exchange for certain preferred securities and debt securities trading. Preferred
securities and debt securities generally trade on an “over-the- counter” market which may be anywhere in the world where the buyer and seller can settle on a price. Due to the lack of centralized
information and trading, the valuation of certain preferred securities and debt securities may carry more risk than that of common stock. Uncertainties in the conditions of the financial market, unreliable reference
data, lack of transparency and inconsistency of valuation models and processes may lead to inaccurate asset pricing.
|
||||||||||||
| Share Price | $ 15.68 | ||||||||||||
| NAV Per Share | $ 17.29 | ||||||||||||
| Capital Stock, Long-Term Debt, and Other Securities [Abstract] | |||||||||||||
| Outstanding Security, Title [Text Block] | Common Shares | ||||||||||||
| Outstanding Security, Held [Shares] | shares | 60,847,827 | ||||||||||||
| Contingent Convertible Securities Risk [Member] | |||||||||||||
| General Description of Registrant [Abstract] | |||||||||||||
| Risk [Text Block] | Contingent Convertible
Securities Risk. CoCos are hybrid securities most commonly issued by banking institutions that present risks similar to debt securities and convertible securities. CoCos are distinct in that they are
intended to either convert into equity or have their principal written down upon the occurrence of certain “triggers.” When an issuer’s capital ratio falls below a specified trigger level, or in a
regulator’s discretion depending on the regulator’s judgment about the issuer’s solvency prospects, a CoCo may be written down, written off or converted into an equity security. Due to the contingent
write-down, write-off and conversion feature, CoCos may have substantially greater risk than other securities in times of financial stress. If the trigger level is breached, the issuer’s decision to write down,
write off or convert a CoCo may be outside its control, and the Fund may suffer a complete loss on an investment in CoCos with no chance of recovery even if the issuer remains in existence. CoCos are usually issued in
the form of subordinated debt instruments to provide the appropriate regulatory capital treatment. If an issuer liquidates, dissolves or winds-up before a conversion to equity has occurred, the rights and claims of
the holders of the CoCos (such as the Fund) against the issuer generally rank junior to the claims of holders of unsubordinated obligations of the issuer. In addition, if the CoCos are converted into the
issuer’s underlying equity securities after a conversion event (i.e., a “trigger”), each holder will be further subordinated. CoCos also may have no stated maturity and have fully discretionary
coupons. This means coupon payments can be canceled at the issuer’s discretion or at the request of the relevant regulatory authority in order to help the bank absorb losses, without causing a default. In
general, the value of CoCos is unpredictable and is influenced by many factors including, without limitation: the creditworthiness of the issuer and/or fluctuations in such issuer’s applicable capital ratios;
supply and demand for CoCos; general market conditions and available liquidity; and economic, financial and political events that affect the issuer, its particular market or the financial markets in general.
|
||||||||||||
| Credit Agency Risk [Member] | |||||||||||||
| General Description of Registrant [Abstract] | |||||||||||||
| Risk [Text Block] | Credit Agency Risk. Credit ratings are determined by credit rating agencies and are only the opinions of such entities. Ratings assigned by a rating agency are not absolute standards of credit quality
and do not evaluate market risk or the liquidity of securities. Any shortcomings or inefficiencies in credit rating agencies’ processes for determining credit ratings may adversely affect the credit ratings of
securities held by the Fund or such credit rating agency’s ability to evaluate creditworthiness and, as a result, may adversely affect those securities’ perceived or actual credit risk.
|
||||||||||||
| Credit And Below Investment Grade Securities Risk [Member] | |||||||||||||
| General Description of Registrant [Abstract] | |||||||||||||
| Risk [Text Block] | Credit and Below-Investment
Grade Securities Risk. Credit risk is the risk that the issuer or other obligated party of a debt security in the Fund’s portfolio will fail to pay, or it is perceived that it will fail to pay, dividends
or interest and/or repay principal when due. Below-investment grade instruments, including instruments that are not rated but judged to be of comparable quality, are commonly referred to as high-yield securities or
“junk” bonds and are considered speculative with respect to the issuer’s capacity to pay dividends or interest and repay principal and are more susceptible to default or decline in market value than
investment grade securities due to adverse economic and business developments. High-yield securities are often unsecured and subordinated to other creditors of the issuer. The market values for high-yield securities
tend to be very volatile, and these securities are generally less liquid than investment grade securities. For these reasons, an investment in the Fund is subject to the following specific risks: (i) increased price
sensitivity to changing interest rates and to a deteriorating economic environment; (ii) greater risk of loss due to default or declining credit quality; (iii) adverse company specific events more likely to render the
issuer unable to make dividend, interest and/or principal payments; (iv) negative perception of the high-yield market which may depress the price and liquidity of high-yield securities; (v) volatility; and (vi)
liquidity.
|
||||||||||||
| Cyber Security Risk [Member] | |||||||||||||
| General Description of Registrant [Abstract] | |||||||||||||
| Risk [Text Block] | Cyber Security Risk. The Fund is susceptible to potential operational risks through breaches in cyber security. A breach in cyber security refers to both intentional and unintentional events that may cause the
Fund to lose proprietary information, suffer data corruption or lose operational capacity. Such events could cause the Fund to incur regulatory penalties, reputational damage, additional compliance costs associated
with corrective measures and/or financial loss. Cyber security breaches may involve unauthorized access to the Fund’s digital information systems through “hacking” or malicious software coding, but
may also result from outside attacks such as denial-of-service attacks through efforts to make network services unavailable to intended users. In addition, cyber security breaches of the Fund’s third-party
service providers, such as its administrator, transfer agent, custodian, or Sub-Advisor, as applicable, or issuers in which the Fund invests, can also subject the Fund to many of the same risks associated with direct
cyber security breaches. The Fund has established risk management systems designed to reduce the risks associated with cyber security. However, there is no guarantee that such efforts will succeed, especially because
the Fund does not directly control the cyber security systems of issuers or third party service providers. Substantial costs may be incurred by the Fund in order to resolve or prevent cyber incidents in the
future.
|
||||||||||||
| Illiquid And Restricted Securities Risk [Member] | |||||||||||||
| General Description of Registrant [Abstract] | |||||||||||||
| Risk [Text Block] | Illiquid and Restricted
Securities Risk. The Fund may invest in securities that are restricted and/or illiquid securities. Restricted securities are securities that cannot be offered for public resale unless
registered under the applicable securities laws or that have a contractual restriction that prohibits or limits their resale. Restricted securities may be illiquid as they generally are not listed on an exchange
and may have no active trading market. Investments in restricted securities could have the effect of increasing the amount of the Fund’s assets invested in illiquid securities if qualified institutional buyers
are unwilling to purchase these securities. Illiquid and restricted securities may be difficult to dispose of at a fair price at the times when the Fund believes it is desirable to do so. The market price of illiquid
and restricted securities generally is more volatile than that of more liquid securities, which may adversely affect the price that the Fund pays for or recovers upon the sale of such securities. Illiquid and
restricted securities are also more difficult to value, especially in challenging markets.
|
||||||||||||
| Inflation Risk [Member] | |||||||||||||
| General Description of Registrant [Abstract] | |||||||||||||
| Risk [Text Block] | Inflation Risk. The Fund invests in securities that are subject to inflation risk. Inflation risk is the risk that the value of assets or income from investments will be worth less in the future as
inflation decreases the value of money. As inflation increases, the present value of the Fund’s assets and distributions may decline. This risk is more prevalent with respect to debt securities. Inflation
creates uncertainty over the future real value (after inflation) of an investment. Inflation rates may change frequently and drastically as a result of various factors, including unexpected shifts in the domestic or
global economy, and the Fund’s investments may not keep pace with inflation, which may result in losses to Fund investors.
|
||||||||||||
| Interest Rate And Duration Risk [Member] | |||||||||||||
| General Description of Registrant [Abstract] | |||||||||||||
| Risk [Text Block] | Interest Rate and Duration
Risk. Interest rate risk is the risk that securities will decline in value because of changes in market interest rates. For fixed rate securities, when market interest rates rise,
the market value of such securities generally will fall. Investments in fixed rate securities with long-term maturities may experience significant price declines if long-term interest rates increase.
During periods of rising interest rates, the average life of certain types of securities may be extended because of slower than expected prepayments. This may lock in a below-market yield, increase the
security’s duration and further reduce the value of the security. Fixed rate securities with longer durations tend to be more sensitive to changes in interest rates, usually making them more volatile than
securities with shorter durations. The duration of a security will be expected to change over time with changes in market factors and time to maturity. Although the Fund seeks to maintain a duration, under
normal market circumstances, excluding the effects of leverage, of between three and eight years, if the effect of the Fund’s use of leverage was included in calculating duration, it could result in a longer
duration for the Fund.
The interest rates
payable on floating rate securities are not fixed and may fluctuate based upon changes in market rates. As short-term interest rates decline, interest payable on floating rate securities typically decreases.
Alternatively, during periods of rising interest rates, interest payable on floating rate securities typically increases. Changes in interest rates on floating rate securities may lag behind changes in
market rates or may have limits on the maximum increases in interest rates. The value of floating rate securities may decline if their interest rates do not rise as much, or as quickly, as interest rates in
general.
Many financial
instruments use or may use a floating rate based upon the LIBOR. The United Kingdom’s Financial Conduct Authority (the “FCA”), which regulates LIBOR, intends to cease making LIBOR available as a
reference rate over a phase-out period that began in early 2022. However, subsequent announcements by the FCA, the LIBOR administrators, and other regulators indicate that it is possible that the most widely used
LIBOR rates may continue until mid-2023. The unavailability or replacement of LIBOR may affect the value, liquidity or return on certain Fund investments and may result in costs incurred in connection with closing out
positions and entering into new trades. Any potential effects of the transition away from LIBOR on the Fund or on certain instruments in which the Fund invests can be difficult to ascertain, and they may vary
depending on a variety of factors. In the United States, it is anticipated that in many instances the Secured Overnight Financing Rate (“SOFR”) will replace LIBOR as the reference rate for many floating
rate instruments. There is no assurance that the composition or characteristics of SOFR, or any alternative reference rate, will be similar to or produce the same value or economic equivalence as LIBOR or that
instruments using an alternative rate will have the same volume or liquidity. As a result, the transition process might lead to increased volatility and reduced liquidity in markets that
currently rely on LIBOR to determine
interest rates; a reduction in the value of some LIBOR-based investments; increased difficulty in borrowing or refinancing and diminished effectiveness of any applicable hedging strategies against instruments whose
terms currently include LIBOR; and/ or costs incurred in connection with temporary borrowings and closing out positions and entering into new agreements. Any such effects (as well as other unforeseen effects) of the
transition away from LIBOR and the adoption of alternative reference rates could result in losses to the Fund.
|
||||||||||||
| Interest Rate Swaps Risk [Member] | |||||||||||||
| General Description of Registrant [Abstract] | |||||||||||||
| Risk [Text Block] | Interest Rate Swaps
Risk. If short-term interest rates are lower than the Fund’s fixed rate of payment on an interest rate swap, the swap will reduce common share net earnings. In addition, a default by
the counterparty to a swap transaction could also negatively impact the performance of the common shares.
|
||||||||||||
| Leverage Risk [Member] | |||||||||||||
| General Description of Registrant [Abstract] | |||||||||||||
| Risk [Text Block] | Leverage Risk. The use of leverage by the Fund can magnify the effect of any losses. If the income and gains from the securities and investments purchased with leverage proceeds do not cover the cost of
leverage, the return to the common shares will be less than if leverage had not been used. Leverage involves risks and special considerations for common shareholders including: (i) the likelihood of greater volatility
of net asset value and market price of the common shares than a comparable portfolio without leverage; (ii) the risk that fluctuations in interest rates on borrowings will reduce the return to the common shareholders
or will result in fluctuations in the dividends paid on the common shares; (iii) in a declining market, the use of leverage is likely to cause a greater decline in the net asset value of the common shares than if the
Fund were not leveraged, which may result in a greater decline in the market price of the common shares; and (iv) when the Fund uses certain types of leverage, the investment advisory fee payable to the Advisor and by
the Advisor to the Sub-Advisor will be higher than if the Fund did not use leverage.
|
||||||||||||
| Management Risk And Reliance On Key Personnel [Member] | |||||||||||||
| General Description of Registrant [Abstract] | |||||||||||||
| Risk [Text Block] | Management Risk and
Reliance on Key Personnel. The implementation of the Fund’s investment strategy depends upon the continued contributions of certain key employees of the Advisor and Sub-Advisor, some of whom have unique
talents and experience and would be difficult to replace. The loss or interruption of the services of a key member of the portfolio management team could have a negative impact on the Fund.
|
||||||||||||
| Market Discount From Net Asset Value [Member] | |||||||||||||
| General Description of Registrant [Abstract] | |||||||||||||
| Risk [Text Block] | Market Discount from Net
Asset Value. Shares of closed-end investment companies such as the Fund frequently trade at a discount from their net asset value. The Fund cannot predict whether its common shares will trade
at, below or above net asset value.
|
||||||||||||
| Market Risk [Member] | |||||||||||||
| General Description of Registrant [Abstract] | |||||||||||||
| Risk [Text Block] | Market Risk. Securities held by the Fund, as well as shares of the Fund itself, are subject to market fluctuations caused by factors such as general economic conditions, political events, regulatory or
market developments, changes in interest rates and perceived trends in securities prices. Shares of the Fund could decline in value or underperform other investments as a result of the risk of loss associated with
these market fluctuations. In addition, local, regional or global events such as war, acts of terrorism, spread of infectious diseases or other public health issues, recessions, or other events could have a
significant negative impact on the Fund and its investments. For example, the coronavirus (COVID-19) global pandemic and the aggressive responses taken by many governments, including closing borders, restricting
international and domestic travel, and the imposition of prolonged quarantines or similar restrictions, had negative impacts, and in many cases severe impacts, on markets worldwide. While the development of vaccines
has slowed the spread of the virus and allowed for the resumption of reasonably normal business activity in the United States, many countries continue to impose lockdown measures in an attempt to slow the spread.
Additionally, there is no guarantee that vaccines will be effective against emerging variants of the disease. Also, in February 2022, Russia invaded Ukraine which has caused and could continue to cause significant
market disruptions and volatility across markets globally, including the United States. The hostilities and sanctions resulting from those hostilities could have a significant impact on certain Fund investments as
well as Fund performance. As the global pandemic and conflict in Ukraine have illustrated, such events may affect certain geographic regions, countries, sectors and industries more significantly than others.
Recent and potential future bank failures could result in disruption to the broader banking industry or markets generally and reduce confidence in financial institutions and the economy as a whole, which may also
heighten market volatility and reduce liquidity. These events also may adversely affect the prices and liquidity of the Fund’s portfolio securities or other instruments and could result in disruptions in the
trading markets. Any of such circumstances could have a materially negative impact on the value of the Fund’s shares and result in increased market volatility. During any such events, the Fund’s shares may
trade at increased premiums or discounts to their net asset value and the bid/ask spread on the Fund’s shares may widen.
|
||||||||||||
| Non U S Securities Risk [Member] | |||||||||||||
| General Description of Registrant [Abstract] | |||||||||||||
| Risk [Text Block] | Non-U.S. Securities
Risk. Investing in securities of non-U.S. issuers, which are generally denominated in non-U.S. currencies, may involve certain risks not typically associated with investing in securities
of U.S. issuers. These risks include: (i) there may be less publicly available information about non-U.S. issuers or markets due to less rigorous disclosure or accounting standards or regulatory practices; (ii)
non-U.S. markets may be smaller, less liquid and more volatile than the U.S. market; (iii) potential adverse effects of fluctuations in currency exchange rates or controls on the value of the Fund’s investments;
(iv) the economies of non-U.S. countries may grow at slower rates than expected or may experience a downturn or recession; (v) the impact of economic, political, social or diplomatic events; (vi) certain non-U.S.
countries may impose restrictions on the ability of non-U.S. issuers to make payments of principal and interest to investors located in the United States due to blockage of non-U.S. currency exchanges or otherwise;
and (vii) withholding and other non-U.S. taxes may decrease the Fund’s return. Foreign companies are generally not subject to the same accounting, auditing and financial reporting standards as are U.S.
companies. In addition, there may be difficulty in obtaining or
enforcing a court judgment abroad. These
risks may be more pronounced to the extent that the Fund invests a significant amount of its assets in companies located in one region or in emerging markets.
|
||||||||||||
| Operational Risk [Member] | |||||||||||||
| General Description of Registrant [Abstract] | |||||||||||||
| Risk [Text Block] | Operational Risk. The Fund is subject to risks arising from various operational factors, including, but not limited to, human error, processing and communication errors, errors of the Fund’s service
providers, counterparties or other third-parties, failed or inadequate processes and technology or systems failures. The Fund relies on third-parties for a range of services, including custody. Any delay or failure
relating to engaging or maintaining such service providers may affect the Fund’s ability to meet its investment objective. Although the Fund and the Fund’s investment advisor seek to reduce these
operational risks through controls and procedures, there is no way to completely protect against such risks.
|
||||||||||||
| Potential Conflicts On Interest Risk [Member] | |||||||||||||
| General Description of Registrant [Abstract] | |||||||||||||
| Risk [Text Block] | Potential Conflicts on
Interest Risk. First Trust, Stonebridge and the portfolio managers have interests which may conflict with the interests of the Fund. In particular, First Trust and Stonebridge currently manage and may
in the future manage and/or advise other investment funds or accounts with the same or substantially similar investment objective and strategies as the Fund. In addition, while the Fund is using leverage, the amount
of the fees paid to First Trust (and by First Trust to Stonebridge) for investment advisory and management services are higher than if the Fund did not use leverage because the fees paid are calculated based on
managed assets. Therefore, First Trust and Stonebridge have a financial incentive to leverage the Fund.
|
||||||||||||
| Preferred Hybrid Preferred And Debt Securities Risk [Member] | |||||||||||||
| General Description of Registrant [Abstract] | |||||||||||||
| Risk [Text Block] | Preferred/Hybrid Preferred
and Debt Securities Risk. An investment in preferred/hybrid preferred and debt securities is subject to certain risks, including:
In addition, preferred
and hybrid preferred securities are subject to certain other risks, including deferral and omission risk, limited voting rights risk and special redemption rights risk.
|
||||||||||||
| Reverse Repurchase Agreements Risk [Member] | |||||||||||||
| General Description of Registrant [Abstract] | |||||||||||||
| Risk [Text Block] | Reverse Repurchase
Agreements Risk. The Fund’s use of reverse repurchase agreements may involve leverage risk. There is also the risk that the market value of the securities acquired with the proceeds of the reverse
repurchase agreement may decline below the price of the securities that the Fund has sold but remains obligated to repurchase. In addition, there is a risk that the market value of the securities retained by the Fund
may decline. Reverse repurchase agreements also involve the risk that the purchaser fails to return the securities as agreed upon, files for bankruptcy or becomes insolvent. The Fund may be restricted from taking
normal portfolio actions during such time, could be subject to loss to the extent that the proceeds of the agreement are less than the value of securities subject to the agreement and may experience adverse tax
consequences.
|
||||||||||||
| Risks Of Concentration In The Financials Sector [Member] | |||||||||||||
| General Description of Registrant [Abstract] | |||||||||||||
| Risk [Text Block] | Risks of Concentration in
the Financials Sector. Because the Fund invests 25% or more of its managed assets in the financials sector, it will be more susceptible to adverse economic or regulatory occurrences affecting this sector, such
as changes in interest rates, loan concentration and competition. The Fund may emphasize its investments in certain industries such as the banking and insurance
industries and therefore may make the
Fund more economically vulnerable in the event of a downturn in those industries. Financial companies are subject to extensive governmental regulation and intervention, which may adversely affect the scope of their
activities, the prices they can charge, the amount and types of capital they must maintain and, potentially, their size. Governmental regulation may change frequently and may have significant adverse consequences for
financial companies, including effects not intended by such regulation. The impact of more stringent capital requirements, or recent or future regulation in various countries, on any individual financial company or on
financial companies as a whole cannot be predicted. Certain risks may impact the value of investments in financial companies more severely than those of investments in other issuers, including the risks associated
with companies that operate with substantial financial leverage. Financial companies may also be adversely affected by volatility in interest rates, loan losses and other customer defaults, decreases in the
availability of money or asset valuations, credit rating downgrades and adverse conditions in other related markets. Insurance companies in particular may be subject to severe price competition and/or rate regulation,
which may have an adverse impact on their profitability. Financial companies are also a target for cyber attacks and may experience technology malfunctions and disruptions as a result.
|
||||||||||||
| Trust Preferred Securities Risk [Member] | |||||||||||||
| General Description of Registrant [Abstract] | |||||||||||||
| Risk [Text Block] | Trust Preferred Securities
Risk. The risks associated with trust preferred securities typically include the financial condition of the financial institution that creates the trust, as the trust typically has no
business operations other than holding the subordinated debt issued by the financial institution and issuing the trust preferred securities and common stock backed by the subordinated debt. If a financial institution
is financially unsound and defaults on interest payments to the trust, the trust will not be able to make payments to holders of the trust preferred securities such as the Fund. The issuer of trust preferred
securities is generally able to defer or skip payments for up to five years without being in default and certain enhanced trust preferred securities may have longer interest payment deferral periods.
|
||||||||||||
| Valuation Risk [Member] | |||||||||||||
| General Description of Registrant [Abstract] | |||||||||||||
| Risk [Text Block] | Valuation Risk. Unlike publicly traded common stock which trades on national exchanges, there is no central place or exchange for certain preferred securities and debt securities trading. Preferred
securities and debt securities generally trade on an “over-the- counter” market which may be anywhere in the world where the buyer and seller can settle on a price. Due to the lack of centralized
information and trading, the valuation of certain preferred securities and debt securities may carry more risk than that of common stock. Uncertainties in the conditions of the financial market, unreliable reference
data, lack of transparency and inconsistency of valuation models and processes may lead to inaccurate asset pricing.
|
1 Year First Trust Intermediate... Chart |
1 Month First Trust Intermediate... Chart |

It looks like you are not logged in. Click the button below to log in and keep track of your recent history.
Support: +44 (0) 203 8794 460 | support@advfn.com
By accessing the services available at ADVFN you are agreeing to be bound by ADVFN's Terms & Conditions
 Hot Features