
We could not find any results for:
Make sure your spelling is correct or try broadening your search.
| Share Name | Share Symbol | Market | Type |
|---|---|---|---|
| EOG Resources Inc | NYSE:EOG | NYSE | Common Stock |
| Price Change | % Change | Share Price | High Price | Low Price | Open Price | Shares Traded | Last Trade | |
|---|---|---|---|---|---|---|---|---|
| 0.00 | 0.00% | 130.10 | 1 | 12:36:57 |
| (State or other jurisdiction of incorporation) | (Commission File Number) | (I.R.S. Employer Identification No.) | ||||||
Title of each class | Trading symbol(s) | Name of each exchange on which registered | ||||||
| EOG RESOURCES, INC. (Registrant) | ||||||||
| Date: February 22, 2024 | By: | /s/ ANN D. JANSSEN Ann D. Janssen Executive Vice President and Chief Financial Officer (Principal Financial Officer and Duly Authorized Officer) | ||||||
| Table of Contents |  | ||||
| Fourth Quarter 2023 | |||||
| Supplemental Financial and Operating Data | Page | ||||
| Income Statements | |||||
| Wellhead Volumes and Prices | |||||
| Balance Sheets | |||||
| Cash Flow Statements | |||||
| Non-GAAP Financial Measures | |||||
| Adjusted Net Income (Loss) | |||||
| Net Income Per Share | |||||
| Adjusted Net Income Per Share | |||||
| Cash Flow from Operations and Free Cash Flow | |||||
| Net Debt-to-Total Capitalization Ratio | |||||
| Proved Reserves and Reserve Replacement Data | |||||
| Reserve Replacement Cost Data | |||||
| Income Statements | | ||||||||||||||||||||||||||||||||||
| In millions of USD, except share data (in millions) and per share data (Unaudited) | |||||||||||||||||||||||||||||||||||
| 2022 | 2023 | ||||||||||||||||||||||||||||||||||
| 1st Qtr | 2nd Qtr | 3rd Qtr | 4th Qtr | Year | 1st Qtr | 2nd Qtr | 3rd Qtr | 4th Qtr | Year | ||||||||||||||||||||||||||
| Operating Revenues and Other | |||||||||||||||||||||||||||||||||||
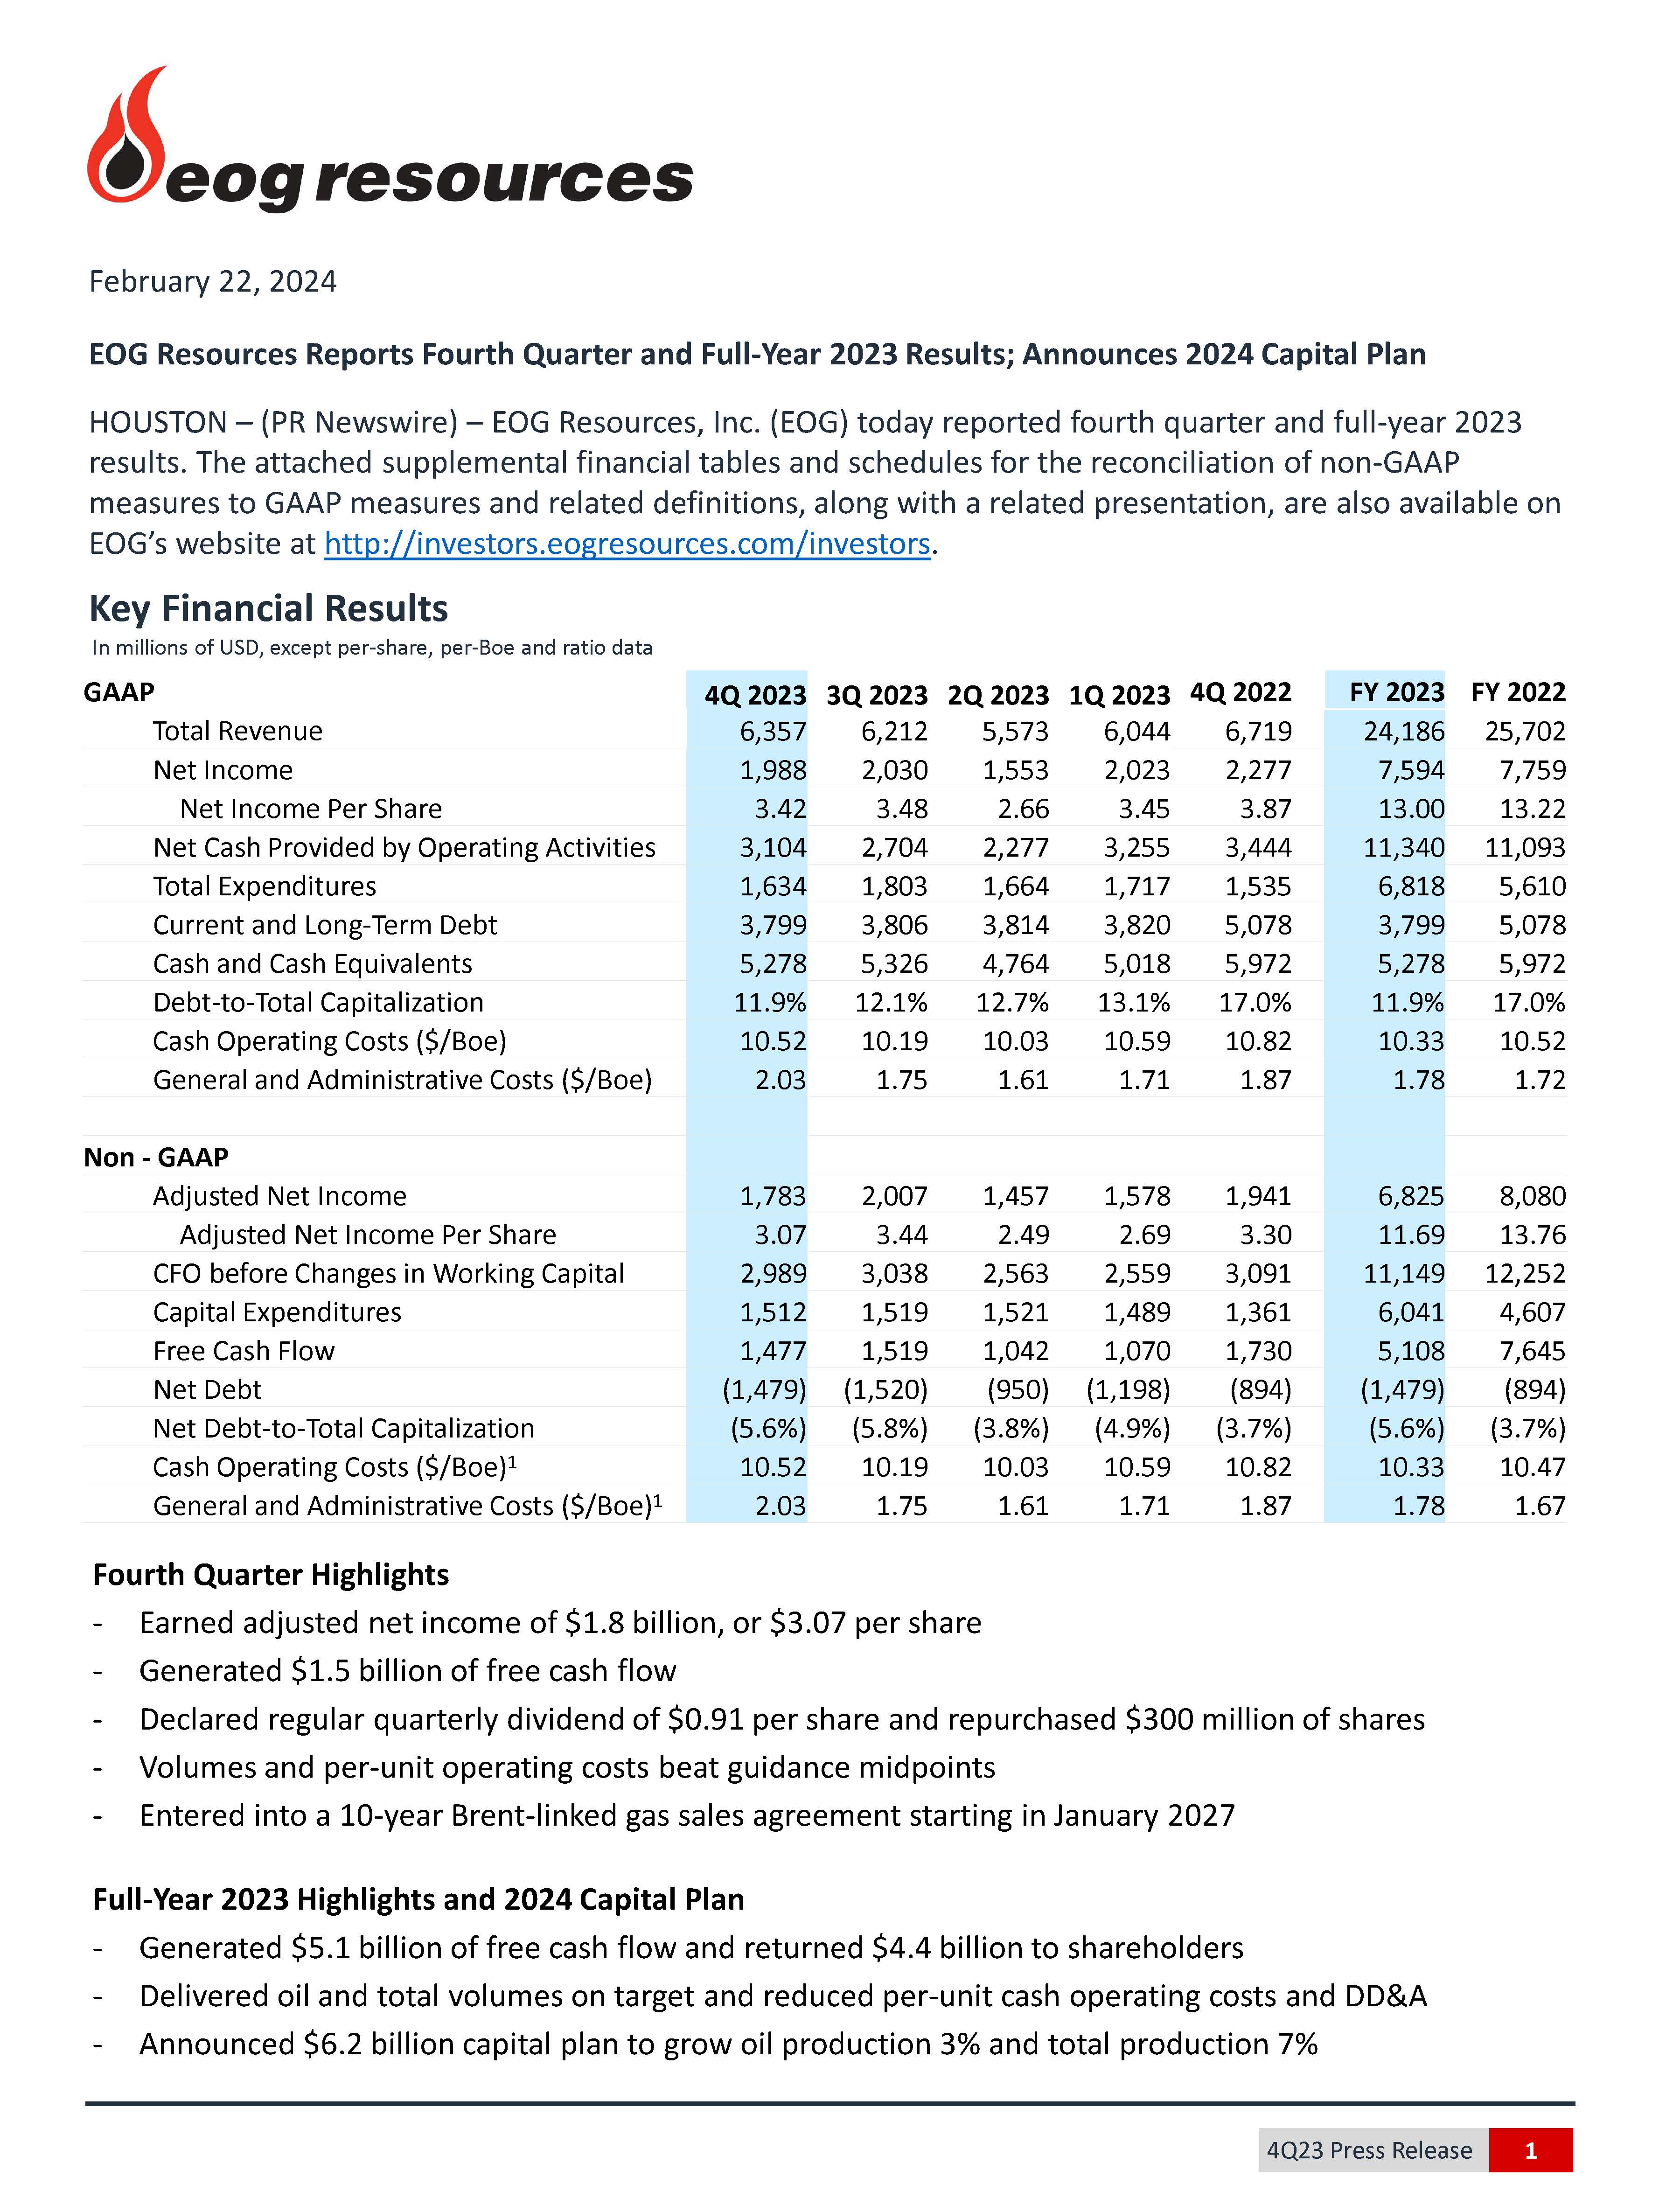
| Crude Oil and Condensate | 3,889 | 4,699 | 4,109 | 3,670 | 16,367 | 3,182 | 3,252 | 3,717 | 3,597 | 13,748 | |||||||||||||||||||||||||
| Natural Gas Liquids | 681 | 777 | 693 | 497 | 2,648 | 490 | 409 | 501 | 484 | 1,884 | |||||||||||||||||||||||||
| Natural Gas | 716 | 1,000 | 1,235 | 830 | 3,781 | 517 | 334 | 417 | 476 | 1,744 | |||||||||||||||||||||||||
| Gains (Losses) on Mark-to-Market Financial Commodity Derivative Contracts, Net | (2,820) | (1,377) | (18) | 233 | (3,982) | 376 | 101 | 43 | 298 | 818 | |||||||||||||||||||||||||
| Gathering, Processing and Marketing | 1,469 | 2,169 | 1,561 | 1,497 | 6,696 | 1,390 | 1,465 | 1,478 | 1,473 | 5,806 | |||||||||||||||||||||||||
| Gains (Losses) on Asset Dispositions, Net | 25 | 97 | (21) | (27) | 74 | 69 | (9) | 35 | — | 95 | |||||||||||||||||||||||||
| Other, Net | 23 | 42 | 34 | 19 | 118 | 20 | 21 | 21 | 29 | 91 | |||||||||||||||||||||||||
| Total | 3,983 | 7,407 | 7,593 | 6,719 | 25,702 | 6,044 | 5,573 | 6,212 | 6,357 | 24,186 | |||||||||||||||||||||||||
| Operating Expenses | |||||||||||||||||||||||||||||||||||
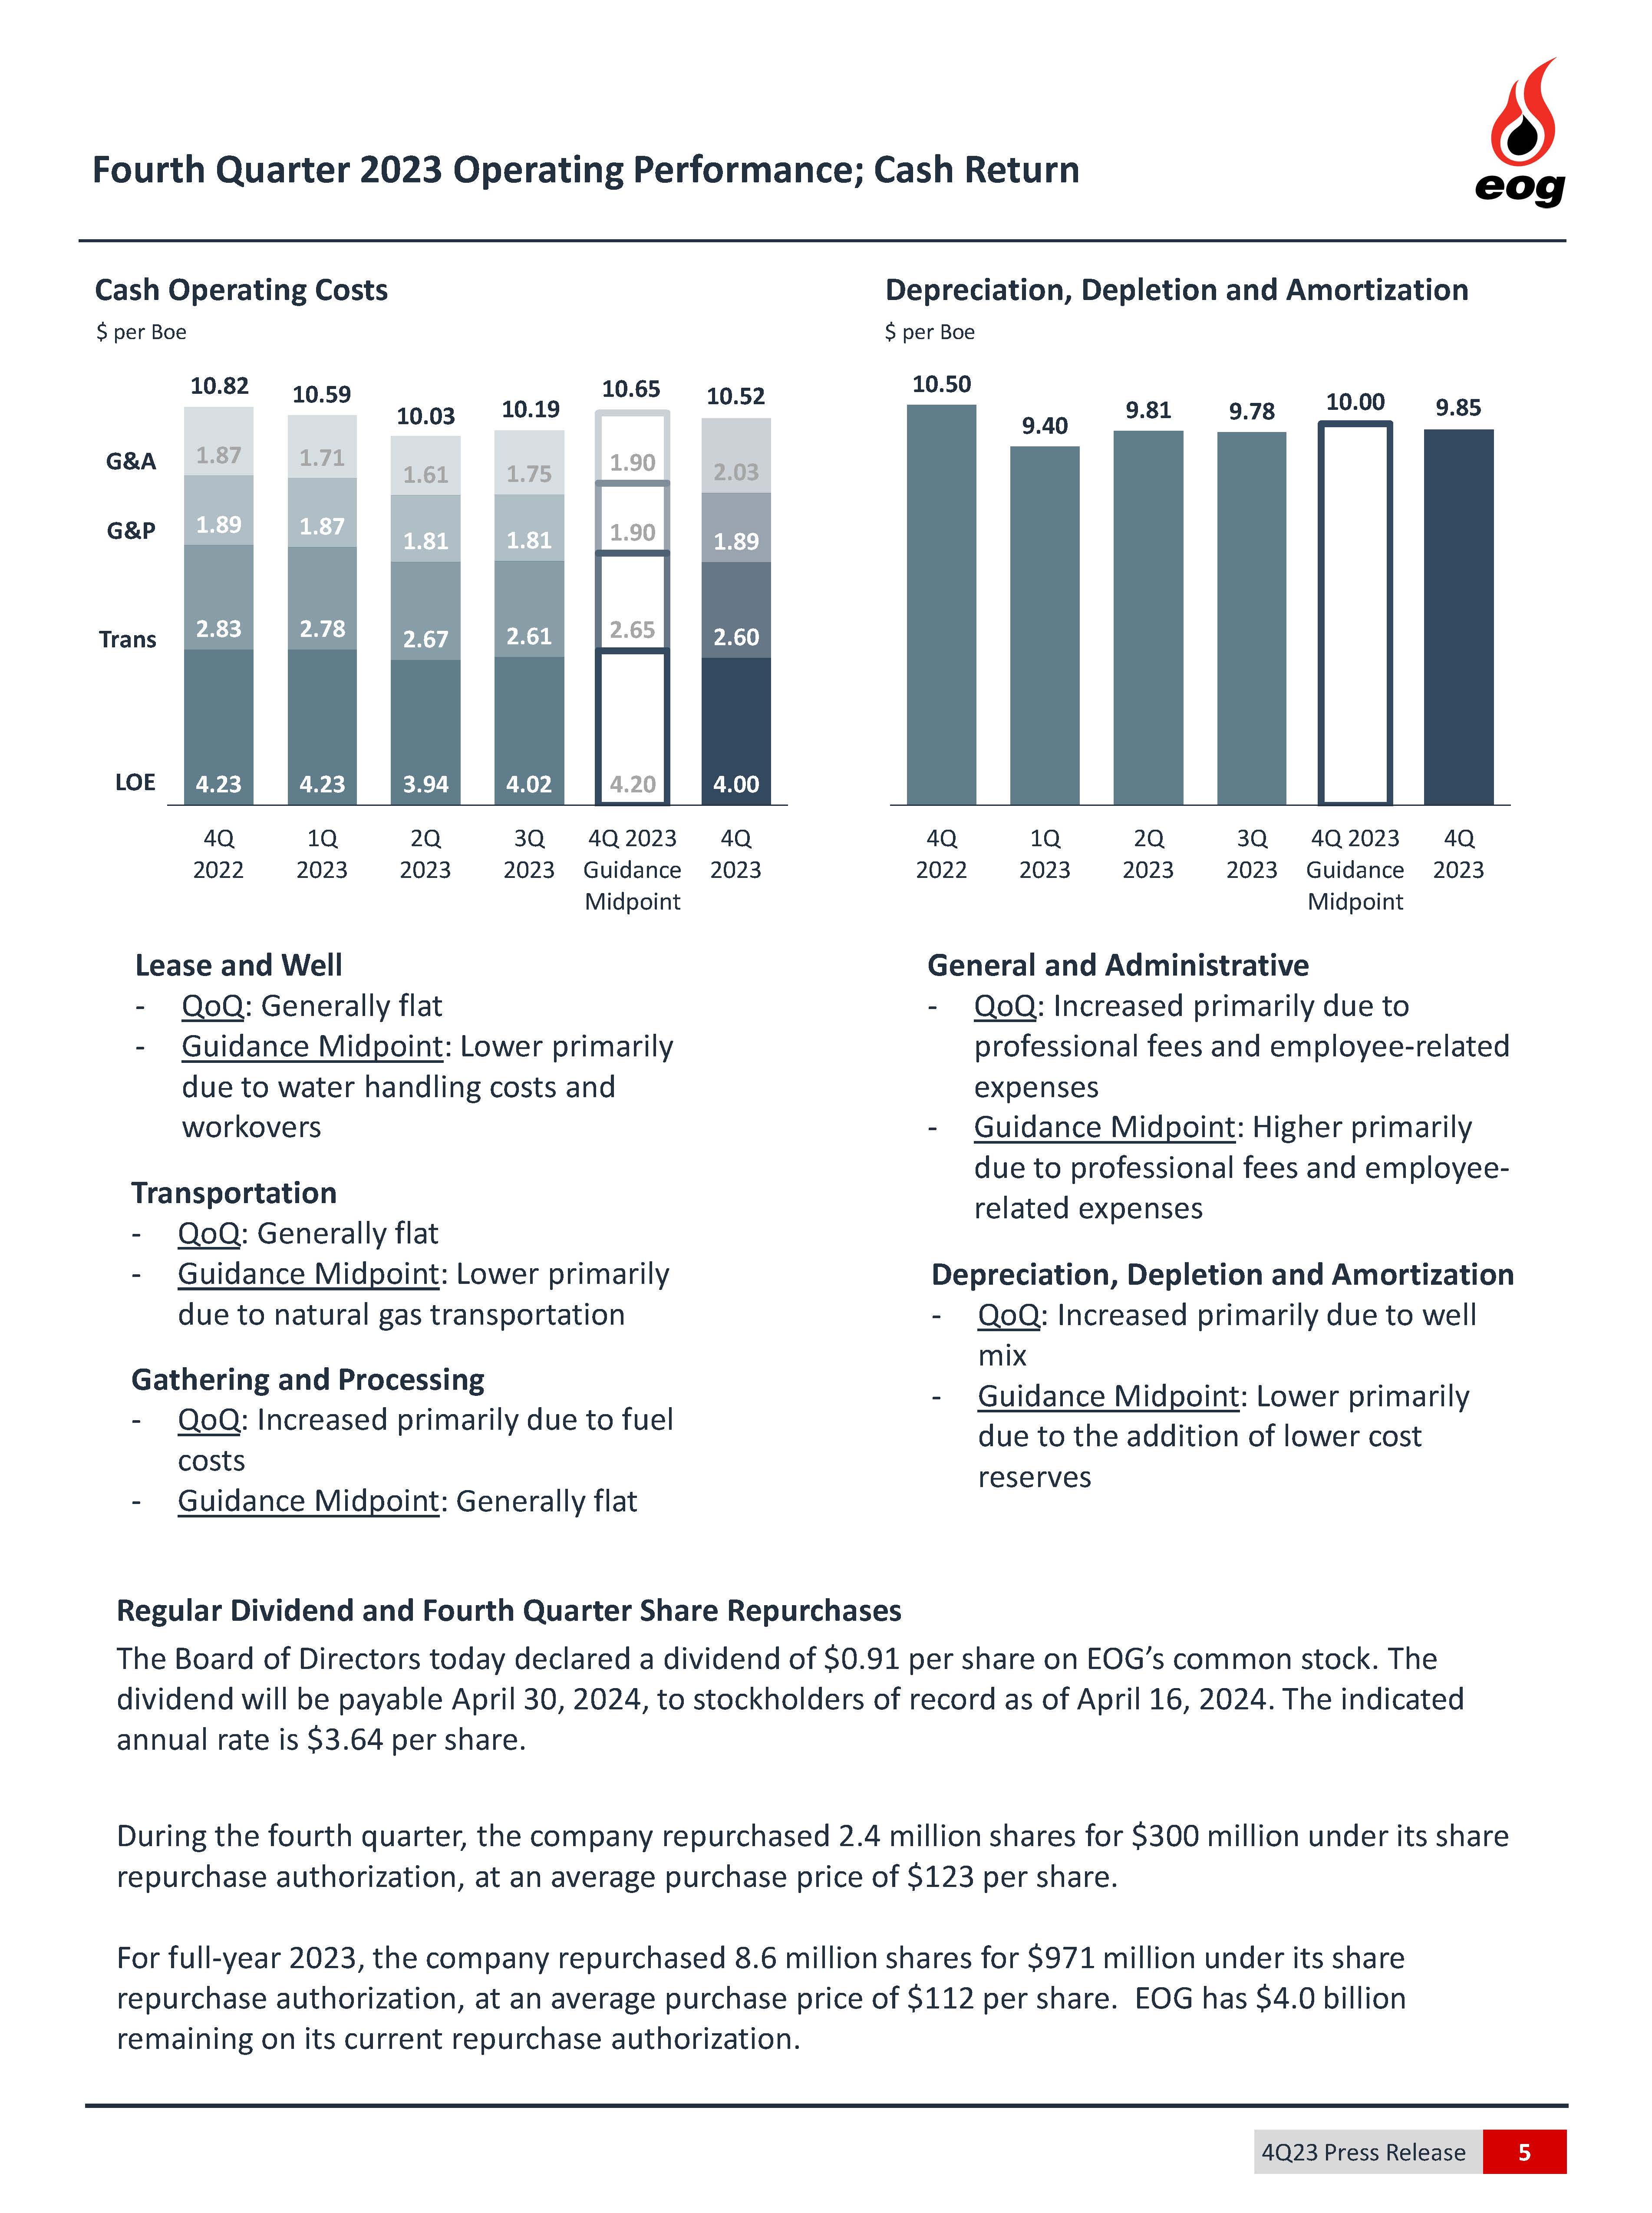
| Lease and Well | 318 | 324 | 335 | 354 | 1,331 | 359 | 348 | 369 | 378 | 1,454 | |||||||||||||||||||||||||
| Transportation Costs | 228 | 244 | 257 | 237 | 966 | 236 | 236 | 240 | 245 | 957 | |||||||||||||||||||||||||
| Gathering and Processing Costs | 144 | 152 | 167 | 158 | 621 | 159 | 160 | 166 | 178 | 663 | |||||||||||||||||||||||||
| Exploration Costs | 45 | 35 | 35 | 44 | 159 | 50 | 47 | 43 | 41 | 181 | |||||||||||||||||||||||||
| Dry Hole Costs | 3 | 20 | 18 | 4 | 45 | 1 | — | — | — | 1 | |||||||||||||||||||||||||
| Impairments | 55 | 91 | 94 | 142 | 382 | 34 | 35 | 54 | 79 | 202 | |||||||||||||||||||||||||
| Marketing Costs | 1,283 | 2,127 | 1,621 | 1,504 | 6,535 | 1,361 | 1,456 | 1,383 | 1,509 | 5,709 | |||||||||||||||||||||||||
| Depreciation, Depletion and Amortization | 847 | 911 | 906 | 878 | 3,542 | 798 | 866 | 898 | 930 | 3,492 | |||||||||||||||||||||||||
| General and Administrative | 124 | 128 | 162 | 156 | 570 | 145 | 142 | 161 | 192 | 640 | |||||||||||||||||||||||||
| Taxes Other Than Income | 390 | 472 | 334 | 389 | 1,585 | 329 | 313 | 341 | 301 | 1,284 | |||||||||||||||||||||||||
| Total | 3,437 | 4,504 | 3,929 | 3,866 | 15,736 | 3,472 | 3,603 | 3,655 | 3,853 | 14,583 | |||||||||||||||||||||||||
| Operating Income | 546 | 2,903 | 3,664 | 2,853 | 9,966 | 2,572 | 1,970 | 2,557 | 2,504 | 9,603 | |||||||||||||||||||||||||
| Other Income (Expense), Net | (1) | 27 | 40 | 48 | 114 | 65 | 51 | 52 | 66 | 234 | |||||||||||||||||||||||||
| Income Before Interest Expense and Income Taxes | 545 | 2,930 | 3,704 | 2,901 | 10,080 | 2,637 | 2,021 | 2,609 | 2,570 | 9,837 | |||||||||||||||||||||||||
| Interest Expense, Net | 48 | 48 | 41 | 42 | 179 | 42 | 35 | 36 | 35 | 148 | |||||||||||||||||||||||||
| Income Before Income Taxes | 497 | 2,882 | 3,663 | 2,859 | 9,901 | 2,595 | 1,986 | 2,573 | 2,535 | 9,689 | |||||||||||||||||||||||||
| Income Tax Provision | 107 | 644 | 809 | 582 | 2,142 | 572 | 433 | 543 | 547 | 2,095 | |||||||||||||||||||||||||
| Net Income | 390 | 2,238 | 2,854 | 2,277 | 7,759 | 2,023 | 1,553 | 2,030 | 1,988 | 7,594 | |||||||||||||||||||||||||
| Dividends Declared per Common Share | 1.7500 | 2.5500 | 2.2500 | 2.3250 | 8.8750 | 1.8250 | 0.8250 | 0.8250 | 2.4100 | 5.8850 | |||||||||||||||||||||||||
| Net Income Per Share | |||||||||||||||||||||||||||||||||||
| Basic | 0.67 | 3.84 | 4.90 | 3.90 | 13.31 | 3.46 | 2.68 | 3.51 | 3.43 | 13.07 | |||||||||||||||||||||||||
| Diluted | 0.67 | 3.81 | 4.86 | 3.87 | 13.22 | 3.45 | 2.66 | 3.48 | 3.42 | 13.00 | |||||||||||||||||||||||||
| Average Number of Common Shares | |||||||||||||||||||||||||||||||||||
| Basic | 582 | 583 | 583 | 584 | 583 | 584 | 580 | 579 | 579 | 581 | |||||||||||||||||||||||||
| Diluted | 586 | 588 | 587 | 588 | 587 | 587 | 584 | 583 | 581 | 584 | |||||||||||||||||||||||||
| Wellhead Volumes and Prices | | ||||||||||||||||||||||||||||||||||
| (Unaudited) | |||||||||||||||||||||||||||||||||||
| 2022 | 2023 | ||||||||||||||||||||||||||||||||||
| 1st Qtr | 2nd Qtr | 3rd Qtr | 4th Qtr | Year | 1st Qtr | 2nd Qtr | 3rd Qtr | 4th Qtr | Year | ||||||||||||||||||||||||||
Crude Oil and Condensate Volumes (MBbld) (A) | |||||||||||||||||||||||||||||||||||
| United States | 449.4 | 463.5 | 464.6 | 465.1 | 460.7 | 457.1 | 476.0 | 482.8 | 484.6 | 475.2 | |||||||||||||||||||||||||
| Trinidad | 0.7 | 0.6 | 0.5 | 0.5 | 0.6 | 0.6 | 0.6 | 0.5 | 0.6 | 0.6 | |||||||||||||||||||||||||
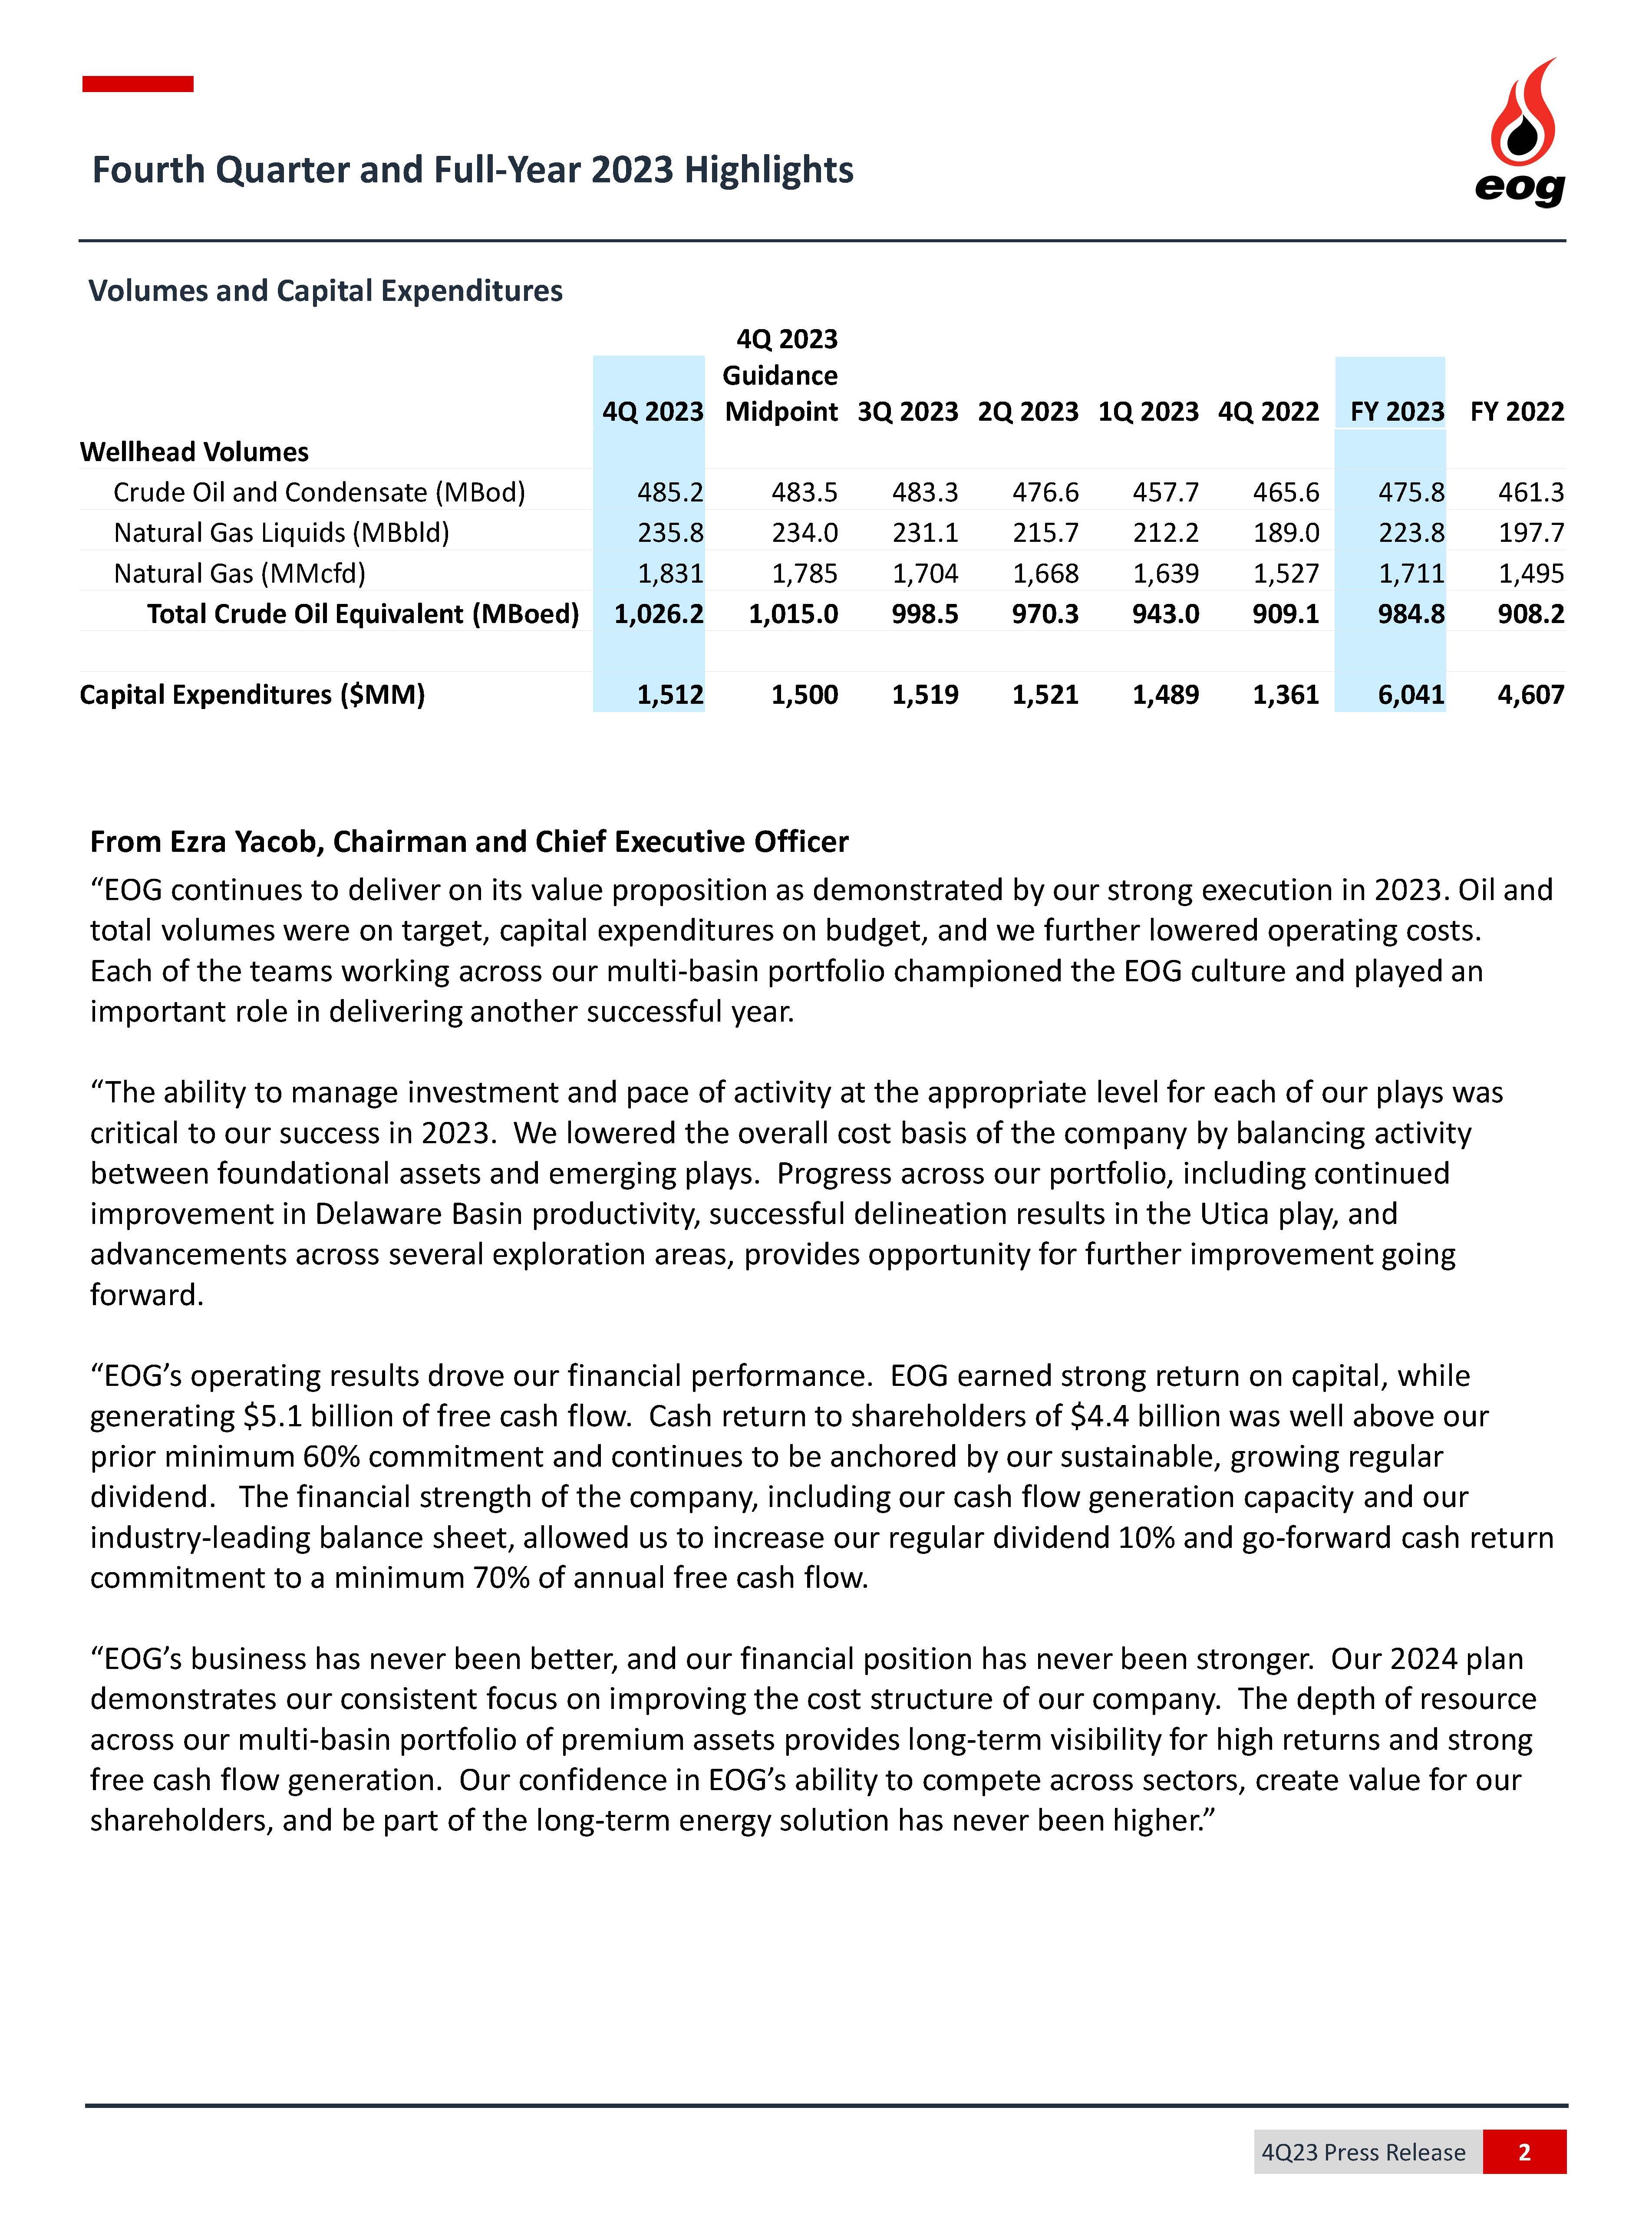
| Total | 450.1 | 464.1 | 465.1 | 465.6 | 461.3 | 457.7 | 476.6 | 483.3 | 485.2 | 475.8 | |||||||||||||||||||||||||
Average Crude Oil and Condensate Prices ($/Bbl) (B) | |||||||||||||||||||||||||||||||||||
| United States | $ | 96.02 | $ | 111.26 | $ | 96.05 | $ | 85.68 | $ | 97.22 | $ | 77.27 | $ | 74.98 | $ | 83.61 | 80.61 | $ | 79.18 | ||||||||||||||||
| Trinidad | 83.82 | 98.29 | 84.98 | 75.21 | 86.16 | 68.98 | 64.88 | 71.38 | 69.21 | 68.58 | |||||||||||||||||||||||||
| Composite | 96.00 | 111.25 | 96.04 | 85.67 | 97.21 | 77.26 | 74.97 | 83.60 | 80.60 | 79.17 | |||||||||||||||||||||||||
Natural Gas Liquids Volumes (MBbld) (A) | |||||||||||||||||||||||||||||||||||
| United States | 190.3 | 201.9 | 209.3 | 189.0 | 197.7 | 212.2 | 215.7 | 231.1 | 235.8 | 223.8 | |||||||||||||||||||||||||
| Total | 190.3 | 201.9 | 209.3 | 189.0 | 197.7 | 212.2 | 215.7 | 231.1 | 235.8 | 223.8 | |||||||||||||||||||||||||
Average Natural Gas Liquids Prices ($/Bbl) (B) | |||||||||||||||||||||||||||||||||||
| United States | $ | 39.77 | $ | 42.28 | $ | 36.02 | $ | 28.55 | $ | 36.70 | $ | 25.67 | $ | 20.85 | $ | 23.56 | 22.29 | $ | 23.07 | ||||||||||||||||
| Composite | 39.77 | 42.28 | 36.02 | 28.55 | 36.70 | 25.67 | 20.85 | 23.56 | 22.29 | 23.07 | |||||||||||||||||||||||||
Natural Gas Volumes (MMcfd) (A) | |||||||||||||||||||||||||||||||||||
| United States | 1,249 | 1,324 | 1,306 | 1,378 | 1,315 | 1,475 | 1,513 | 1,562 | 1,653 | 1,551 | |||||||||||||||||||||||||
| Trinidad | 209 | 204 | 163 | 149 | 180 | 164 | 155 | 142 | 178 | 160 | |||||||||||||||||||||||||
| Total | 1,458 | 1,528 | 1,469 | 1,527 | 1,495 | 1,639 | 1,668 | 1,704 | 1,831 | 1,711 | |||||||||||||||||||||||||
Average Natural Gas Prices ($/Mcf) (B) | |||||||||||||||||||||||||||||||||||
| United States | $ | 5.81 | $ | 7.77 | $ | 9.35 | $ | 6.12 | $ | 7.27 | $ | 3.47 | $ | 2.07 | $ | 2.59 | 2.72 | $ | 2.70 | ||||||||||||||||
Trinidad (D) | 3.36 | 3.42 | 7.45 | 3.97 | 4.43 | 3.87 | 3.45 | 3.41 | 3.81 | 3.65 | |||||||||||||||||||||||||
| Composite | 5.46 | 7.19 | 9.14 | 5.91 | 6.93 | 3.51 | 2.20 | 2.66 | 2.82 | 2.79 | |||||||||||||||||||||||||
Crude Oil Equivalent Volumes (MBoed) (C) | |||||||||||||||||||||||||||||||||||
| United States | 847.8 | 886.1 | 891.6 | 883.8 | 877.5 | 915.0 | 943.8 | 974.2 | 995.8 | 957.5 | |||||||||||||||||||||||||
| Trinidad | 35.5 | 34.6 | 27.6 | 25.3 | 30.7 | 28.0 | 26.5 | 24.3 | 30.4 | 27.3 | |||||||||||||||||||||||||
| Total | 883.3 | 920.7 | 919.2 | 909.1 | 908.2 | 943.0 | 970.3 | 998.5 | 1,026.2 | 984.8 | |||||||||||||||||||||||||
Total MMBoe (C) | 79.5 | 83.8 | 84.6 | 83.6 | 331.5 | 84.9 | 88.3 | 91.9 | 94.4 | 359.4 | |||||||||||||||||||||||||
| Balance Sheets | | ||||||||||||||||||||||||||||
| In millions of USD (Unaudited) | |||||||||||||||||||||||||||||
| 2022 | 2023 | ||||||||||||||||||||||||||||
| MAR | JUN | SEP | DEC | MAR | JUN | SEP | DEC | ||||||||||||||||||||||
| Current Assets | |||||||||||||||||||||||||||||
| Cash and Cash Equivalents | 4,009 | 3,073 | 5,272 | 5,972 | 5,018 | 4,764 | 5,326 | 5,278 | |||||||||||||||||||||
| Accounts Receivable, Net | 3,213 | 3,735 | 3,343 | 2,774 | 2,455 | 2,263 | 2,927 | 2,716 | |||||||||||||||||||||
| Inventories | 586 | 739 | 872 | 1,058 | 1,131 | 1,355 | 1,379 | 1,275 | |||||||||||||||||||||
| Assets from Price Risk Management Activities | — | 1 | — | — | — | — | — | 106 | |||||||||||||||||||||
| Income Taxes Receivable | — | — | 93 | 97 | — | 1 | — | — | |||||||||||||||||||||
| Other | 671 | 605 | 621 | 574 | 580 | 523 | 626 | 560 | |||||||||||||||||||||
| Total | 8,479 | 8,153 | 10,201 | 10,475 | 9,184 | 8,906 | 10,258 | 9,935 | |||||||||||||||||||||
| Property, Plant and Equipment | |||||||||||||||||||||||||||||
| Oil and Gas Properties (Successful Efforts Method) | 65,408 | 66,098 | 67,065 | 67,322 | 67,907 | 69,178 | 70,730 | 72,090 | |||||||||||||||||||||
| Other Property, Plant and Equipment | 4,801 | 4,862 | 4,659 | 4,786 | 5,101 | 5,282 | 5,355 | 5,497 | |||||||||||||||||||||
| Total Property, Plant and Equipment | 70,209 | 70,960 | 71,724 | 72,108 | 73,008 | 74,460 | 76,085 | 77,587 | |||||||||||||||||||||
| Less: Accumulated Depreciation, Depletion and Amortization | (41,747) | (42,113) | (42,623) | (42,679) | (42,785) | (43,550) | (44,362) | (45,290) | |||||||||||||||||||||
| Total Property, Plant and Equipment, Net | 28,462 | 28,847 | 29,101 | 29,429 | 30,223 | 30,910 | 31,723 | 32,297 | |||||||||||||||||||||
| Deferred Income Taxes | 13 | 12 | 18 | 33 | 31 | 33 | 33 | 42 | |||||||||||||||||||||
| Other Assets | 1,143 | 1,127 | 1,167 | 1,434 | 1,587 | 1,638 | 1,633 | 1,583 | |||||||||||||||||||||
| Total Assets | 38,097 | 38,139 | 40,487 | 41,371 | 41,025 | 41,487 | 43,647 | 43,857 | |||||||||||||||||||||
| Current Liabilities | |||||||||||||||||||||||||||||
| Accounts Payable | 2,660 | 2,896 | 2,718 | 2,532 | 2,438 | 2,205 | 2,464 | 2,437 | |||||||||||||||||||||
| Accrued Taxes Payable | 1,130 | 594 | 542 | 405 | 637 | 425 | 605 | 466 | |||||||||||||||||||||
| Dividends Payable | 436 | 437 | 437 | 482 | 482 | 478 | 478 | 526 | |||||||||||||||||||||
| Liabilities from Price Risk Management Activities | 260 | 79 | 243 | 169 | 31 | 22 | 22 | — | |||||||||||||||||||||
| Current Portion of Long-Term Debt | 1,283 | 1,282 | 1,282 | 1,283 | 33 | 34 | 34 | 34 | |||||||||||||||||||||
| Current Portion of Operating Lease Liabilities | 223 | 216 | 235 | 296 | 354 | 335 | 337 | 325 | |||||||||||||||||||||
| Other | 272 | 264 | 289 | 346 | 253 | 232 | 285 | 286 | |||||||||||||||||||||
| Total | 6,264 | 5,768 | 5,746 | 5,513 | 4,228 | 3,731 | 4,225 | 4,074 | |||||||||||||||||||||
| Long-Term Debt | 3,816 | 3,809 | 3,802 | 3,795 | 3,787 | 3,780 | 3,772 | 3,765 | |||||||||||||||||||||
| Other Liabilities | 2,191 | 2,067 | 2,573 | 2,574 | 2,620 | 2,581 | 2,698 | 2,526 | |||||||||||||||||||||
| Deferred Income Taxes | 4,286 | 4,183 | 4,517 | 4,710 | 4,943 | 5,138 | 5,194 | 5,402 | |||||||||||||||||||||
| Commitments and Contingencies | |||||||||||||||||||||||||||||
| Stockholders' Equity | |||||||||||||||||||||||||||||
| Common Stock, $0.01 Par | 206 | 206 | 206 | 206 | 206 | 206 | 206 | 206 | |||||||||||||||||||||
| Additional Paid in Capital | 6,095 | 6,128 | 6,155 | 6,187 | 6,219 | 6,257 | 6,133 | 6,166 | |||||||||||||||||||||
| Accumulated Other Comprehensive Loss | (13) | (12) | (6) | (8) | (8) | (9) | (7) | (9) | |||||||||||||||||||||
| Retained Earnings | 15,283 | 16,028 | 17,563 | 18,472 | 19,423 | 20,497 | 22,047 | 22,634 | |||||||||||||||||||||
| Common Stock Held in Treasury | (31) | (38) | (69) | (78) | (393) | (694) | (621) | (907) | |||||||||||||||||||||
| Total Stockholders' Equity | 21,540 | 22,312 | 23,849 | 24,779 | 25,447 | 26,257 | 27,758 | 28,090 | |||||||||||||||||||||
| Total Liabilities and Stockholders' Equity | 38,097 | 38,139 | 40,487 | 41,371 | 41,025 | 41,487 | 43,647 | 43,857 | |||||||||||||||||||||
| Cash Flow Statements | | ||||||||||||||||||||||||||||||||||
| In millions of USD (Unaudited) | |||||||||||||||||||||||||||||||||||
| 2022 | 2023 | ||||||||||||||||||||||||||||||||||
| 1st Qtr | 2nd Qtr | 3rd Qtr | 4th Qtr | Year | 1st Qtr | 2nd Qtr | 3rd Qtr | 4th Qtr | Year | ||||||||||||||||||||||||||
| Cash Flows from Operating Activities | |||||||||||||||||||||||||||||||||||
| Reconciliation of Net Income to Net Cash Provided by Operating Activities: | |||||||||||||||||||||||||||||||||||
| Net Income | 390 | 2,238 | 2,854 | 2,277 | 7,759 | 2,023 | 1,553 | 2,030 | 1,988 | 7,594 | |||||||||||||||||||||||||
| Items Not Requiring (Providing) Cash | |||||||||||||||||||||||||||||||||||
| Depreciation, Depletion and Amortization | 847 | 911 | 906 | 878 | 3,542 | 798 | 866 | 898 | 930 | 3,492 | |||||||||||||||||||||||||
| Impairments | 55 | 91 | 94 | 142 | 382 | 34 | 35 | 54 | 79 | 202 | |||||||||||||||||||||||||
| Stock-Based Compensation Expenses | 35 | 30 | 34 | 34 | 133 | 34 | 35 | 57 | 51 | 177 | |||||||||||||||||||||||||
| Deferred Income Taxes | (465) | (102) | 327 | 179 | (61) | 234 | 194 | 56 | 199 | 683 | |||||||||||||||||||||||||
| (Gains) Losses on Asset Dispositions, Net | (25) | (97) | 21 | 27 | (74) | (69) | 9 | (35) | — | (95) | |||||||||||||||||||||||||
| Other, Net | 6 | (16) | (5) | 15 | — | 4 | 2 | (1) | 22 | 27 | |||||||||||||||||||||||||
| Dry Hole Costs | 3 | 20 | 18 | 4 | 45 | 1 | — | — | — | 1 | |||||||||||||||||||||||||
| Mark-to-Market Financial Commodity Derivative Contracts (Gains) Losses, Net | 2,820 | 1,377 | 18 | (233) | 3,982 | (376) | (101) | (43) | (298) | (818) | |||||||||||||||||||||||||
| Net Cash Received from (Payments for) Settlements of Financial Commodity Derivative Contracts | (296) | (2,114) | (847) | (244) | (3,501) | (123) | (30) | 23 | 18 | (112) | |||||||||||||||||||||||||
| Other, Net | 2 | 19 | 12 | 12 | 45 | (1) | — | (1) | — | (2) | |||||||||||||||||||||||||
| Changes in Components of Working Capital and Other Assets and Liabilities | |||||||||||||||||||||||||||||||||||
| Accounts Receivable | (878) | (522) | 392 | 661 | (347) | 338 | 137 | (714) | 201 | (38) | |||||||||||||||||||||||||
| Inventories | (14) | (157) | (140) | (223) | (534) | (77) | (226) | (28) | 100 | (231) | |||||||||||||||||||||||||
| Accounts Payable | 130 | 259 | (88) | (211) | 90 | (77) | (231) | 238 | (49) | (119) | |||||||||||||||||||||||||
| Accrued Taxes Payable | 613 | (536) | (53) | (137) | (113) | 232 | (212) | 180 | (139) | 61 | |||||||||||||||||||||||||
| Other Assets | (213) | 71 | (129) | (93) | (364) | 52 | 43 | (92) | 36 | 39 | |||||||||||||||||||||||||
| Other Liabilities | (2,250) | 433 | 1,269 | 282 | (266) | 193 | (47) | 54 | (16) | 184 | |||||||||||||||||||||||||
| Changes in Components of Working Capital Associated with Investing Activities | 68 | 143 | 90 | 74 | 375 | 35 | 250 | 28 | (18) | 295 | |||||||||||||||||||||||||
| Net Cash Provided by Operating Activities | 828 | 2,048 | 4,773 | 3,444 | 11,093 | 3,255 | 2,277 | 2,704 | 3,104 | 11,340 | |||||||||||||||||||||||||
| Investing Cash Flows | |||||||||||||||||||||||||||||||||||
| Additions to Oil and Gas Properties | (939) | (1,349) | (1,102) | (1,229) | (4,619) | (1,305) | (1,341) | (1,379) | (1,360) | (5,385) | |||||||||||||||||||||||||
| Additions to Other Property, Plant and Equipment | (70) | (75) | (103) | (133) | (381) | (319) | (180) | (139) | (162) | (800) | |||||||||||||||||||||||||
| Proceeds from Sales of Assets | 121 | 110 | 79 | 39 | 349 | 92 | 29 | 14 | 5 | 140 | |||||||||||||||||||||||||
| Other Investing Activities | — | (30) | — | — | (30) | — | — | — | — | — | |||||||||||||||||||||||||
| Changes in Components of Working Capital Associated with Investing Activities | (68) | (143) | (90) | (74) | (375) | (35) | (250) | (28) | 18 | (295) | |||||||||||||||||||||||||
| Net Cash Used in Investing Activities | (956) | (1,487) | (1,216) | (1,397) | (5,056) | (1,567) | (1,742) | (1,532) | (1,499) | (6,340) | |||||||||||||||||||||||||
| Financing Cash Flows | |||||||||||||||||||||||||||||||||||
| Long-Term Debt Repayments | — | — | — | — | — | (1,250) | — | — | — | (1,250) | |||||||||||||||||||||||||
| Dividends Paid | (1,023) | (1,486) | (1,312) | (1,327) | (5,148) | (1,067) | (480) | (494) | (1,345) | (3,386) | |||||||||||||||||||||||||
| Treasury Stock Purchased | (43) | (15) | (37) | (23) | (118) | (317) | (302) | (109) | (310) | (1,038) | |||||||||||||||||||||||||
| Proceeds from Stock Options Exercised and Employee Stock Purchase Plan | 4 | 13 | — | 11 | 28 | — | 9 | 1 | 10 | 20 | |||||||||||||||||||||||||
| Debt Issuance Costs | — | — | — | — | — | — | (8) | — | — | (8) | |||||||||||||||||||||||||
| Repayment of Finance Lease Liabilities | (10) | (9) | (8) | (8) | (35) | (8) | (8) | (8) | (8) | (32) | |||||||||||||||||||||||||
| Net Cash Used in Financing Activities | (1,072) | (1,497) | (1,357) | (1,347) | (5,273) | (2,642) | (789) | (610) | (1,653) | (5,694) | |||||||||||||||||||||||||
| Effect of Exchange Rate Changes on Cash | — | — | (1) | — | (1) | — | — | — | — | — | |||||||||||||||||||||||||
| Increase (Decrease) in Cash and Cash Equivalents | (1,200) | (936) | 2,199 | 700 | 763 | (954) | (254) | 562 | (48) | (694) | |||||||||||||||||||||||||
| Cash and Cash Equivalents at Beginning of Period | 5,209 | 4,009 | 3,073 | 5,272 | 5,209 | 5,972 | 5,018 | 4,764 | 5,326 | 5,972 | |||||||||||||||||||||||||
| Cash and Cash Equivalents at End of Period | 4,009 | 3,073 | 5,272 | 5,972 | 5,972 | 5,018 | 4,764 | 5,326 | 5,278 | 5,278 | |||||||||||||||||||||||||
| Non-GAAP Financial Measures | | |||||||||||||
| Adjusted Net Income (Loss) | | ||||||||||||||||||||||
| In millions of USD, except share data (in millions) and per share data (Unaudited) | |||||||||||||||||||||||
| The following tables adjust reported Net Income (Loss) (GAAP) to reflect actual net cash received from (payments for) settlements of financial commodity derivative contracts by eliminating the unrealized mark-to-market (gains) losses from these transactions, to eliminate the net (gains) losses on asset dispositions, to add back impairment charges related to certain of EOG's assets (which are generally (i) attributable to declines in commodity prices, (ii) related to sales of certain oil and gas properties or (iii) the result of certain other events or decisions (e.g., a periodic review of EOG's oil and gas properties or other assets)), and to make certain other adjustments to exclude non-recurring and certain other items as further described below. EOG believes this presentation may be useful to investors who follow the practice of some industry analysts who adjust reported company earnings to match hedge realizations to production settlement months and make certain other adjustments to exclude non-recurring and certain other items. EOG management uses this information for purposes of comparing its financial performance with the financial performance of other companies in the industry. | |||||||||||||||||||||||
| 4Q 2023 | |||||||||||||||||||||||
| Before Tax | Income Tax Impact | After Tax | Diluted Earnings per Share | ||||||||||||||||||||
| Reported Net Income (GAAP) | 2,535 | (547) | 1,988 | 3.42 | |||||||||||||||||||
| Adjustments: | |||||||||||||||||||||||
| Gains on Mark-to-Market Financial Commodity Derivative Contracts, Net | (298) | 64 | (234) | (0.40) | |||||||||||||||||||
Net Cash Received from Settlements of Financial Commodity Derivative Contracts (1) | 18 | (4) | 14 | 0.02 | |||||||||||||||||||
| Less: Losses on Asset Dispositions, Net | — | — | — | — | |||||||||||||||||||
| Add: Certain Impairments | 19 | (4) | 15 | 0.03 | |||||||||||||||||||
| Adjustments to Net Income | (261) | 56 | (205) | (0.35) | |||||||||||||||||||
| Adjusted Net Income (Non-GAAP) | 2,274 | (491) | 1,783 | 3.07 | |||||||||||||||||||
| Average Number of Common Shares (Non-GAAP) | |||||||||||||||||||||||
| Basic | 579 | ||||||||||||||||||||||
| Diluted | 581 | ||||||||||||||||||||||
Adjusted Net Income (Loss) (Continued) | | ||||||||||||||||||||||
| In millions of USD, except share data (in millions) and per share data (Unaudited) | |||||||||||||||||||||||
| 3Q 2023 | |||||||||||||||||||||||
| Before Tax | Income Tax Impact | After Tax | Diluted Earnings per Share | ||||||||||||||||||||
| Reported Net Income (GAAP) | 2,573 | (543) | 2,030 | 3.48 | |||||||||||||||||||
| Adjustments: | |||||||||||||||||||||||
| Gains on Mark-to-Market Financial Commodity Derivative Contracts, Net | (43) | 9 | (34) | (0.06) | |||||||||||||||||||
Net Cash Received from Settlements of Financial Commodity Derivative Contracts (1) | 23 | (5) | 18 | 0.03 | |||||||||||||||||||
| Less: Gains on Asset Dispositions, Net | (35) | 7 | (28) | (0.05) | |||||||||||||||||||
| Add: Certain Impairments | 23 | (2) | 21 | 0.04 | |||||||||||||||||||
| Adjustments to Net Income | (32) | 9 | (23) | (0.04) | |||||||||||||||||||
| Adjusted Net Income (Non-GAAP) | 2,541 | (534) | 2,007 | 3.44 | |||||||||||||||||||
| Average Number of Common Shares (Non-GAAP) | |||||||||||||||||||||||
| Basic | 579 | ||||||||||||||||||||||
| Diluted | 583 | ||||||||||||||||||||||
Adjusted Net Income (Loss) (Continued) | | ||||||||||||||||||||||
| In millions of USD, except share data (in millions) and per share data (Unaudited) | |||||||||||||||||||||||
| 2Q 2023 | |||||||||||||||||||||||
| Before Tax | Income Tax Impact | After Tax | Diluted Earnings per Share | ||||||||||||||||||||
| Reported Net Income (GAAP) | 1,986 | (433) | 1,553 | 2.66 | |||||||||||||||||||
| Adjustments: | |||||||||||||||||||||||
| Gains on Mark-to-Market Financial Commodity Derivative Contracts, Net | (101) | 22 | (79) | (0.14) | |||||||||||||||||||
Net Cash Payments for Settlements of Financial Commodity Derivative Contracts (1) | (30) | 6 | (24) | (0.04) | |||||||||||||||||||
| Add: Losses on Asset Dispositions, Net | 9 | (2) | 7 | 0.01 | |||||||||||||||||||
| Adjustments to Net Income | (122) | 26 | (96) | (0.17) | |||||||||||||||||||
| Adjusted Net Income (Non-GAAP) | 1,864 | (407) | 1,457 | 2.49 | |||||||||||||||||||
| Average Number of Common Shares (Non-GAAP) | |||||||||||||||||||||||
| Basic | 580 | ||||||||||||||||||||||
| Diluted | 584 | ||||||||||||||||||||||
Adjusted Net Income (Loss) (Continued) | | ||||||||||||||||||||||
| In millions of USD, except share data (in millions) and per share data (Unaudited) | |||||||||||||||||||||||
| 1Q 2023 | |||||||||||||||||||||||
| Before Tax | Income Tax Impact | After Tax | Diluted Earnings per Share | ||||||||||||||||||||
| Reported Net Income (GAAP) | 2,595 | (572) | 2,023 | 3.45 | |||||||||||||||||||
| Adjustments: | |||||||||||||||||||||||
| Gains on Mark-to-Market Financial Commodity Derivative Contracts, Net | (376) | 81 | (295) | (0.51) | |||||||||||||||||||
Net Cash Payments for Settlements of Financial Commodity Derivative Contracts (1) | (123) | 27 | (96) | (0.16) | |||||||||||||||||||
| Less: Gains on Asset Dispositions, Net | (69) | 15 | (54) | (0.09) | |||||||||||||||||||
| Adjustments to Net Income | (568) | 123 | (445) | (0.76) | |||||||||||||||||||
| Adjusted Net Income (Non-GAAP) | 2,027 | (449) | 1,578 | 2.69 | |||||||||||||||||||
| Average Number of Common Shares (Non-GAAP) | |||||||||||||||||||||||
| Basic | 584 | ||||||||||||||||||||||
| Diluted | 587 | ||||||||||||||||||||||
Adjusted Net Income (Loss) (Continued) | | ||||||||||||||||||||||
| In millions of USD, except share data (in millions) and per share data (Unaudited) | |||||||||||||||||||||||
| 4Q 2022 | |||||||||||||||||||||||
| Before Tax | Income Tax Impact | After Tax | Diluted Earnings per Share | ||||||||||||||||||||
| Reported Net Income (GAAP) | 2,859 | (582) | 2,277 | 3.87 | |||||||||||||||||||
| Adjustments: | |||||||||||||||||||||||
| Gains on Mark-to-Market Financial Commodity Derivative Contracts, Net | (233) | 57 | (176) | (0.31) | |||||||||||||||||||
Net Cash Payments for Settlements of Financial Commodity Derivative Contracts (1) | (244) | 48 | (196) | (0.33) | |||||||||||||||||||
| Add: Losses on Asset Dispositions, Net | 27 | (6) | 21 | 0.04 | |||||||||||||||||||
| Add: Certain Impairments | 31 | (16) | 15 | 0.03 | |||||||||||||||||||
| Adjustments to Net Income | (419) | 83 | (336) | (0.57) | |||||||||||||||||||
| Adjusted Net Income (Non-GAAP) | 2,440 | (499) | 1,941 | 3.30 | |||||||||||||||||||
| Average Number of Common Shares (Non-GAAP) | |||||||||||||||||||||||
| Basic | 584 | ||||||||||||||||||||||
| Diluted | 588 | ||||||||||||||||||||||
Adjusted Net Income (Loss) (Continued) | | ||||||||||||||||||||||
| In millions of USD, except share data (in millions) and per share data (Unaudited) | |||||||||||||||||||||||
| FY 2023 | |||||||||||||||||||||||
| Before Tax | Income Tax Impact | After Tax | Diluted Earnings per Share | ||||||||||||||||||||
| Reported Net Income (GAAP) | 9,689 | (2,095) | 7,594 | 13.00 | |||||||||||||||||||
| Adjustments: | |||||||||||||||||||||||
| Gains on Mark-to-Market Financial Commodity Derivative Contracts, Net | (818) | 176 | (642) | (1.09) | |||||||||||||||||||
Net Cash Payments for Settlements of Financial Commodity Derivative Contracts (1) | (112) | 24 | (88) | (0.15) | |||||||||||||||||||
| Less: Gains on Asset Dispositions, Net | (95) | 20 | (75) | (0.13) | |||||||||||||||||||
| Add: Certain Impairments | 42 | (6) | 36 | 0.06 | |||||||||||||||||||
| Adjustments to Net Income | (983) | 214 | (769) | (1.31) | |||||||||||||||||||
| Adjusted Net Income (Non-GAAP) | 8,706 | (1,881) | 6,825 | 11.69 | |||||||||||||||||||
| Average Number of Common Shares (Non-GAAP) | |||||||||||||||||||||||
| Basic | 581 | ||||||||||||||||||||||
| Diluted | 584 | ||||||||||||||||||||||
Adjusted Net Income (Loss) (Continued) | | ||||||||||||||||||||||
| In millions of USD, except share data (in millions) and per share data (Unaudited) | |||||||||||||||||||||||
| FY 2022 | |||||||||||||||||||||||
| Before Tax | Income Tax Impact | After Tax | Diluted Earnings per Share | ||||||||||||||||||||
| Reported Net Income (GAAP) | 9,901 | (2,142) | 7,759 | 13.22 | |||||||||||||||||||
| Adjustments: | |||||||||||||||||||||||
| Losses on Mark-to-Market Financial Commodity Derivative Contracts, Net | 3,982 | (858) | 3,124 | 5.32 | |||||||||||||||||||
Net Cash Payments for Settlements of Financial Commodity Derivative Contracts (1) | (3,501) | 755 | (2,746) | (4.68) | |||||||||||||||||||
| Less: Gains on Asset Dispositions, Net | (74) | 17 | (57) | (0.10) | |||||||||||||||||||
| Add: Certain Impairments | 113 | (31) | 82 | 0.14 | |||||||||||||||||||
| Less: Severance Tax Refund | (115) | 25 | (90) | (0.15) | |||||||||||||||||||
| Add: Severance Tax Consulting Fees | 16 | (3) | 13 | 0.02 | |||||||||||||||||||
| Less: Interest on Severance Tax Refund | (7) | 2 | (5) | (0.01) | |||||||||||||||||||
| Adjustments to Net Income | 414 | (93) | 321 | 0.54 | |||||||||||||||||||
| Adjusted Net Income (Non-GAAP) | 10,315 | (2,235) | 8,080 | 13.76 | |||||||||||||||||||
| Average Number of Common Shares (Non-GAAP) | |||||||||||||||||||||||
| Basic | 583 | ||||||||||||||||||||||
| Diluted | 587 | ||||||||||||||||||||||
| Net Income per Share | | ||||||||||
| In millions of USD, except share data (in millions), per share data, production volume data and per Boe data (Unaudited) | |||||||||||
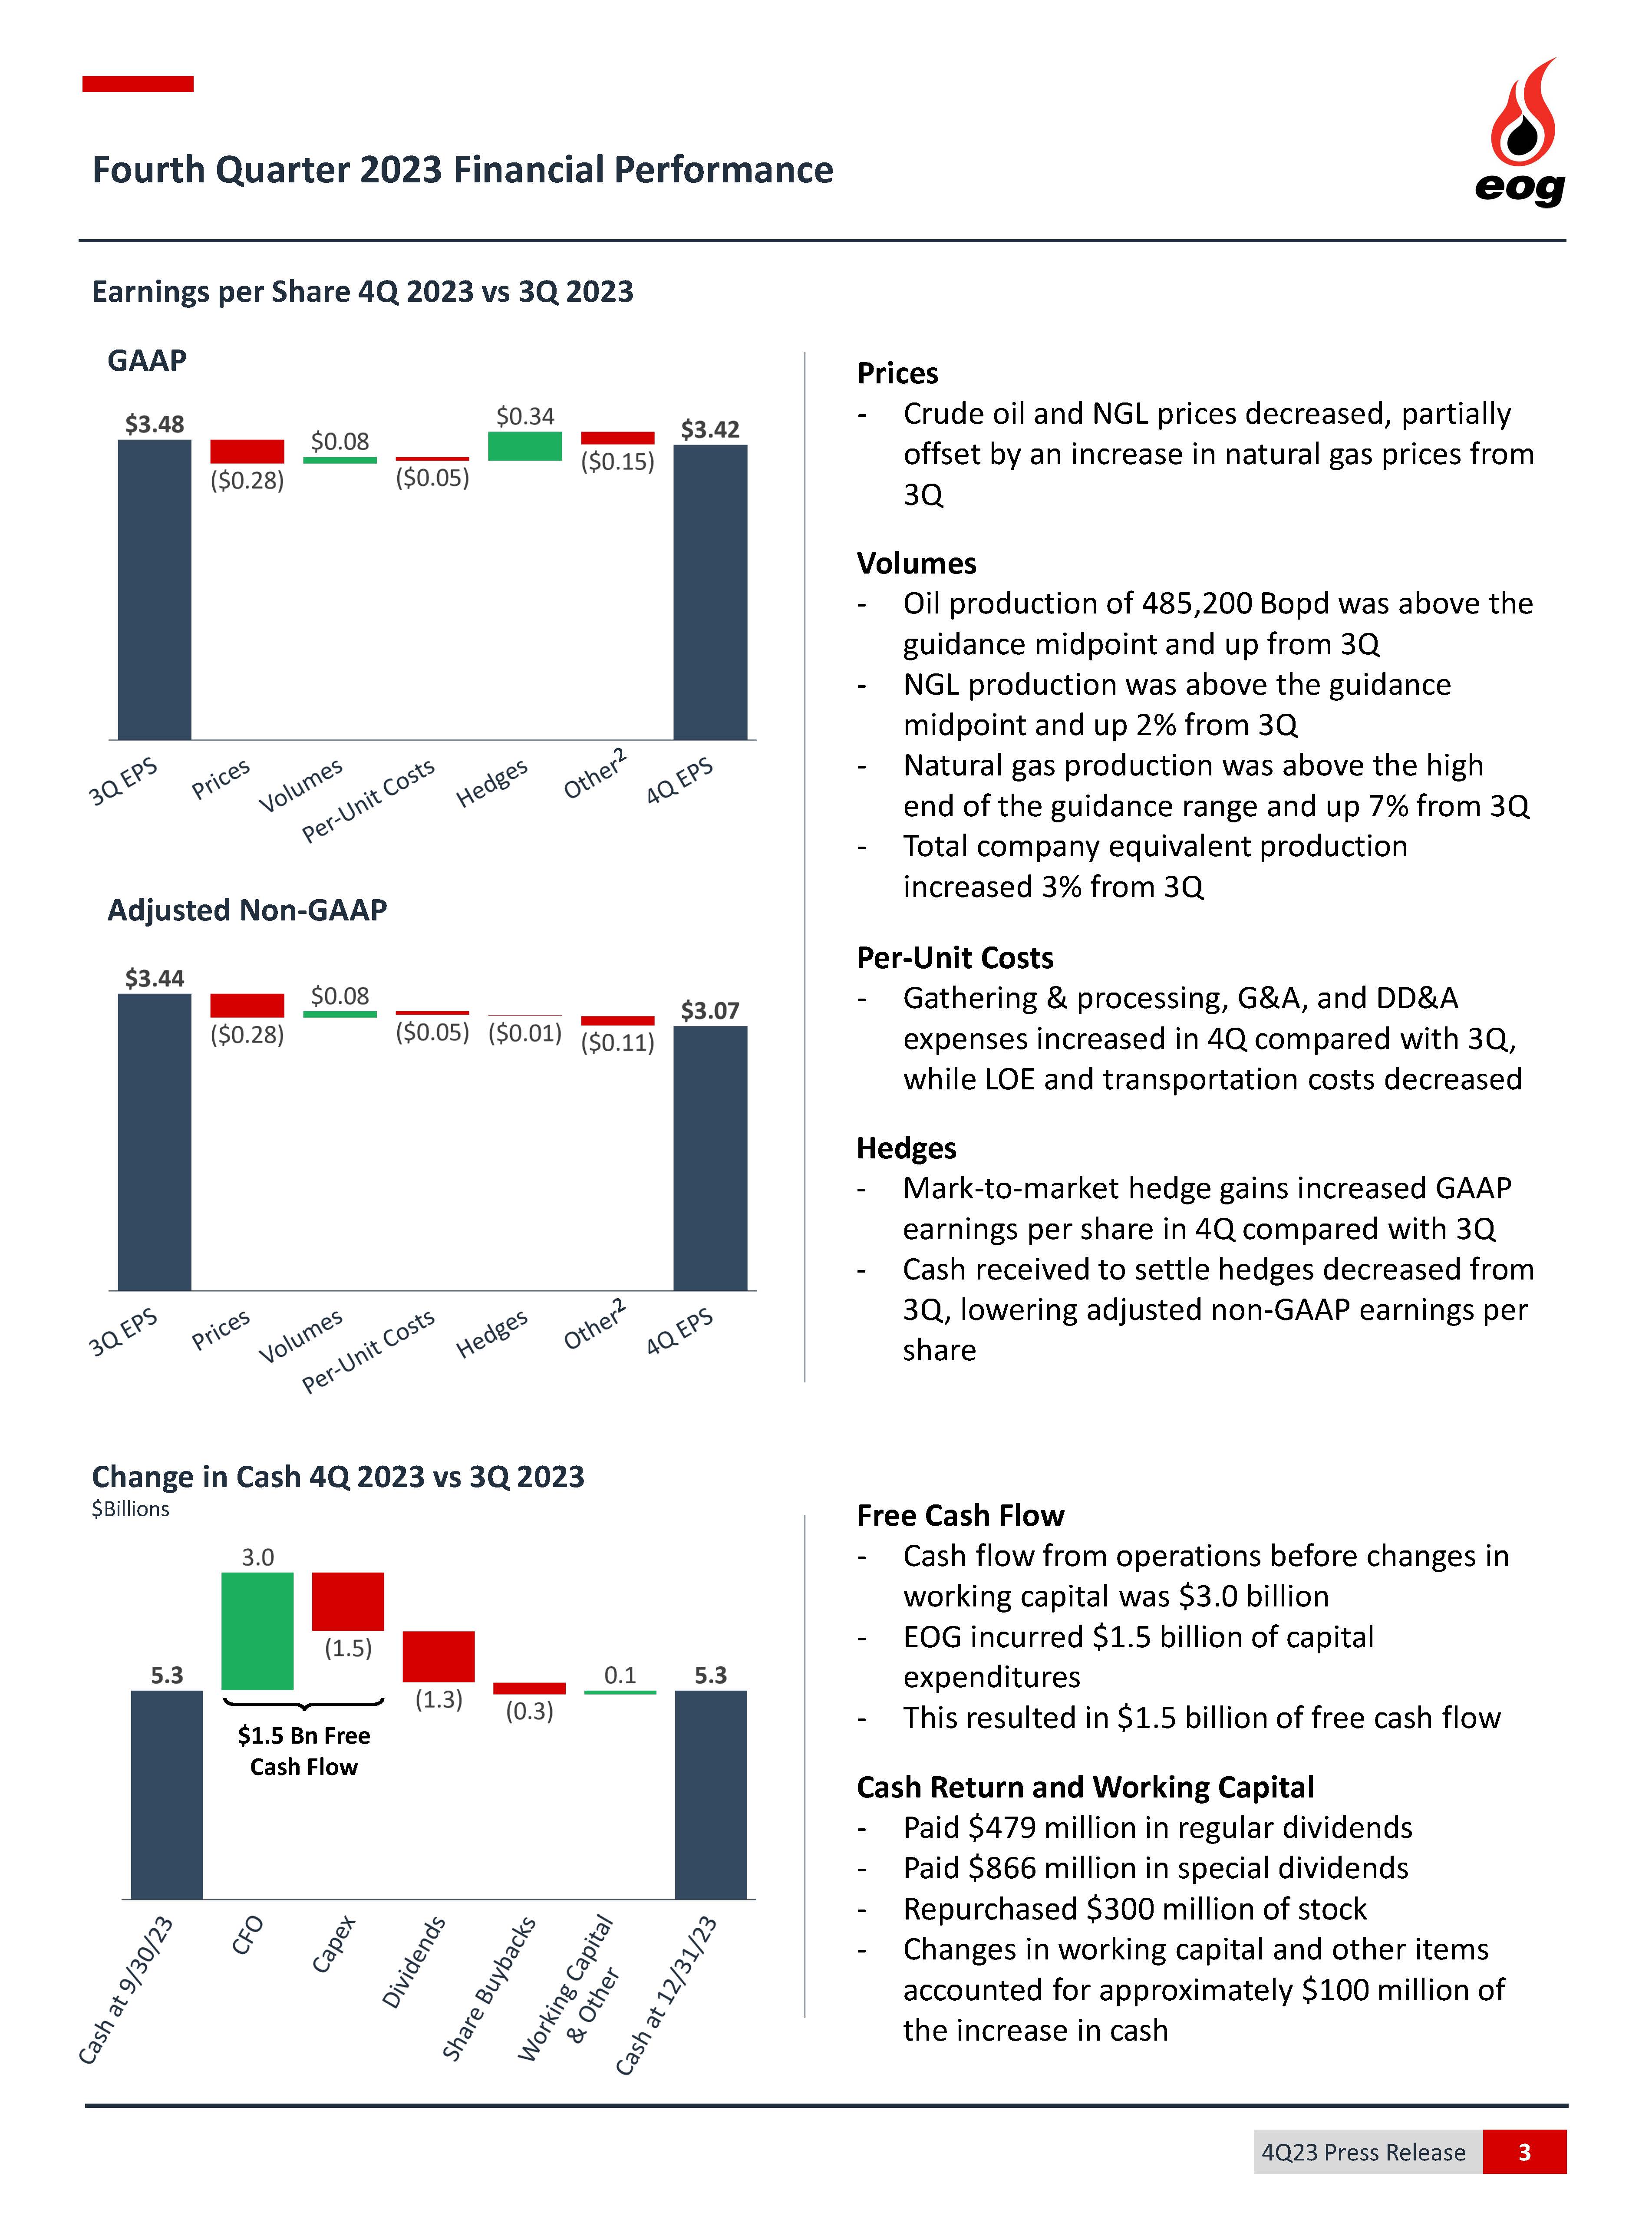
| 3Q 2023 Net Income per Share (GAAP) | 3.48 | ||||||||||
| Realized Price | |||||||||||
| 4Q 2023 Composite Average Wellhead Revenue per Boe | 48.27 | ||||||||||
| Less: 3Q 2023 Composite Average Wellhead Revenue per Boe | (50.46) | ||||||||||
| Subtotal | (2.19) | ||||||||||
| Multiplied by: 4Q 2023 Crude Oil Equivalent Volumes (MMBoe) | 94.4 | ||||||||||
| Total Change in Revenue | (207) | ||||||||||
| Less: Income Tax Benefit (Provision) Imputed (based on 22%) | 46 | ||||||||||
| Change in Net Income | (161) | ||||||||||
| Change in Diluted Earnings per Share | (0.28) | ||||||||||
| Wellhead Volumes | |||||||||||
| 4Q 2023 Crude Oil Equivalent Volumes (MMBoe) | 94.4 | ||||||||||
| Less: 3Q 2023 Crude Oil Equivalent Volumes (MMBoe) | (91.9) | ||||||||||
| Subtotal | 2.5 | ||||||||||
| Multiplied by: 4Q 2023 Composite Average Margin per Boe (GAAP) (Including Total Exploration Costs) (refer to "Revenues, Costs and Margins Per Barrel of Oil Equivalent" schedule) | 23.07 | ||||||||||
| Change in Margin | 58 | ||||||||||
| Less: Income Tax Benefit (Provision) Imputed (based on 22%) | (13) | ||||||||||
| Change in Net Income | 45 | ||||||||||
| Change in Diluted Earnings per Share | 0.08 | ||||||||||
| Certain Operating Costs per Boe | |||||||||||
| 3Q 2023 Total Cash Operating Costs (GAAP) and Total DD&A per Boe | 19.97 | ||||||||||
| Less: 4Q 2023 Total Cash Operating Costs (GAAP) and Total DD&A per Boe | (20.37) | ||||||||||
| Subtotal | (0.40) | ||||||||||
| Multiplied by: 4Q 2023 Crude Oil Equivalent Volumes (MMBoe) | 94.4 | ||||||||||
| Change in Before-Tax Net Income | (38) | ||||||||||
| Less: Income Tax Benefit (Provision) Imputed (based on 22%) | 8 | ||||||||||
| Change in Net Income | (30) | ||||||||||
| Change in Diluted Earnings per Share | (0.05) | ||||||||||
Net Income Per Share (Continued) | | ||||||||||
| In millions of USD, except share data (in millions), per share data, production volume data and per Boe data (Unaudited) | |||||||||||
| Gains (Losses) on Mark-to-Market Financial Commodity Derivative Contracts, Net | |||||||||||
| 4Q 2023 Net Gains (Losses) on Mark-to-Market Financial Commodity Derivative Contracts | 298 | ||||||||||
| Less: Income Tax Benefit (Provision) | (64) | ||||||||||
| After Tax - (a) | 234 | ||||||||||
| Less: 3Q 2023 Net Gains (Losses) on Mark-to-Market Financial Commodity Derivative Contracts | 43 | ||||||||||
| Less: Income Tax Benefit (Provision) | (9) | ||||||||||
| After Tax - (b) | 34 | ||||||||||
| Change in Net Income - (a) - (b) | 200 | ||||||||||
| Change in Diluted Earnings per Share | 0.34 | ||||||||||
Other (1) | (0.15) | ||||||||||
| 4Q 2023 Net Income per Share (GAAP) | 3.42 | ||||||||||
| 4Q 2023 Average Number of Common Shares (GAAP) - Diluted | 581 | ||||||||||
| Net Income per Share | | ||||||||||
| In millions of USD, except share data (in millions), per share data, production volume data and per Boe data (Unaudited) | |||||||||||
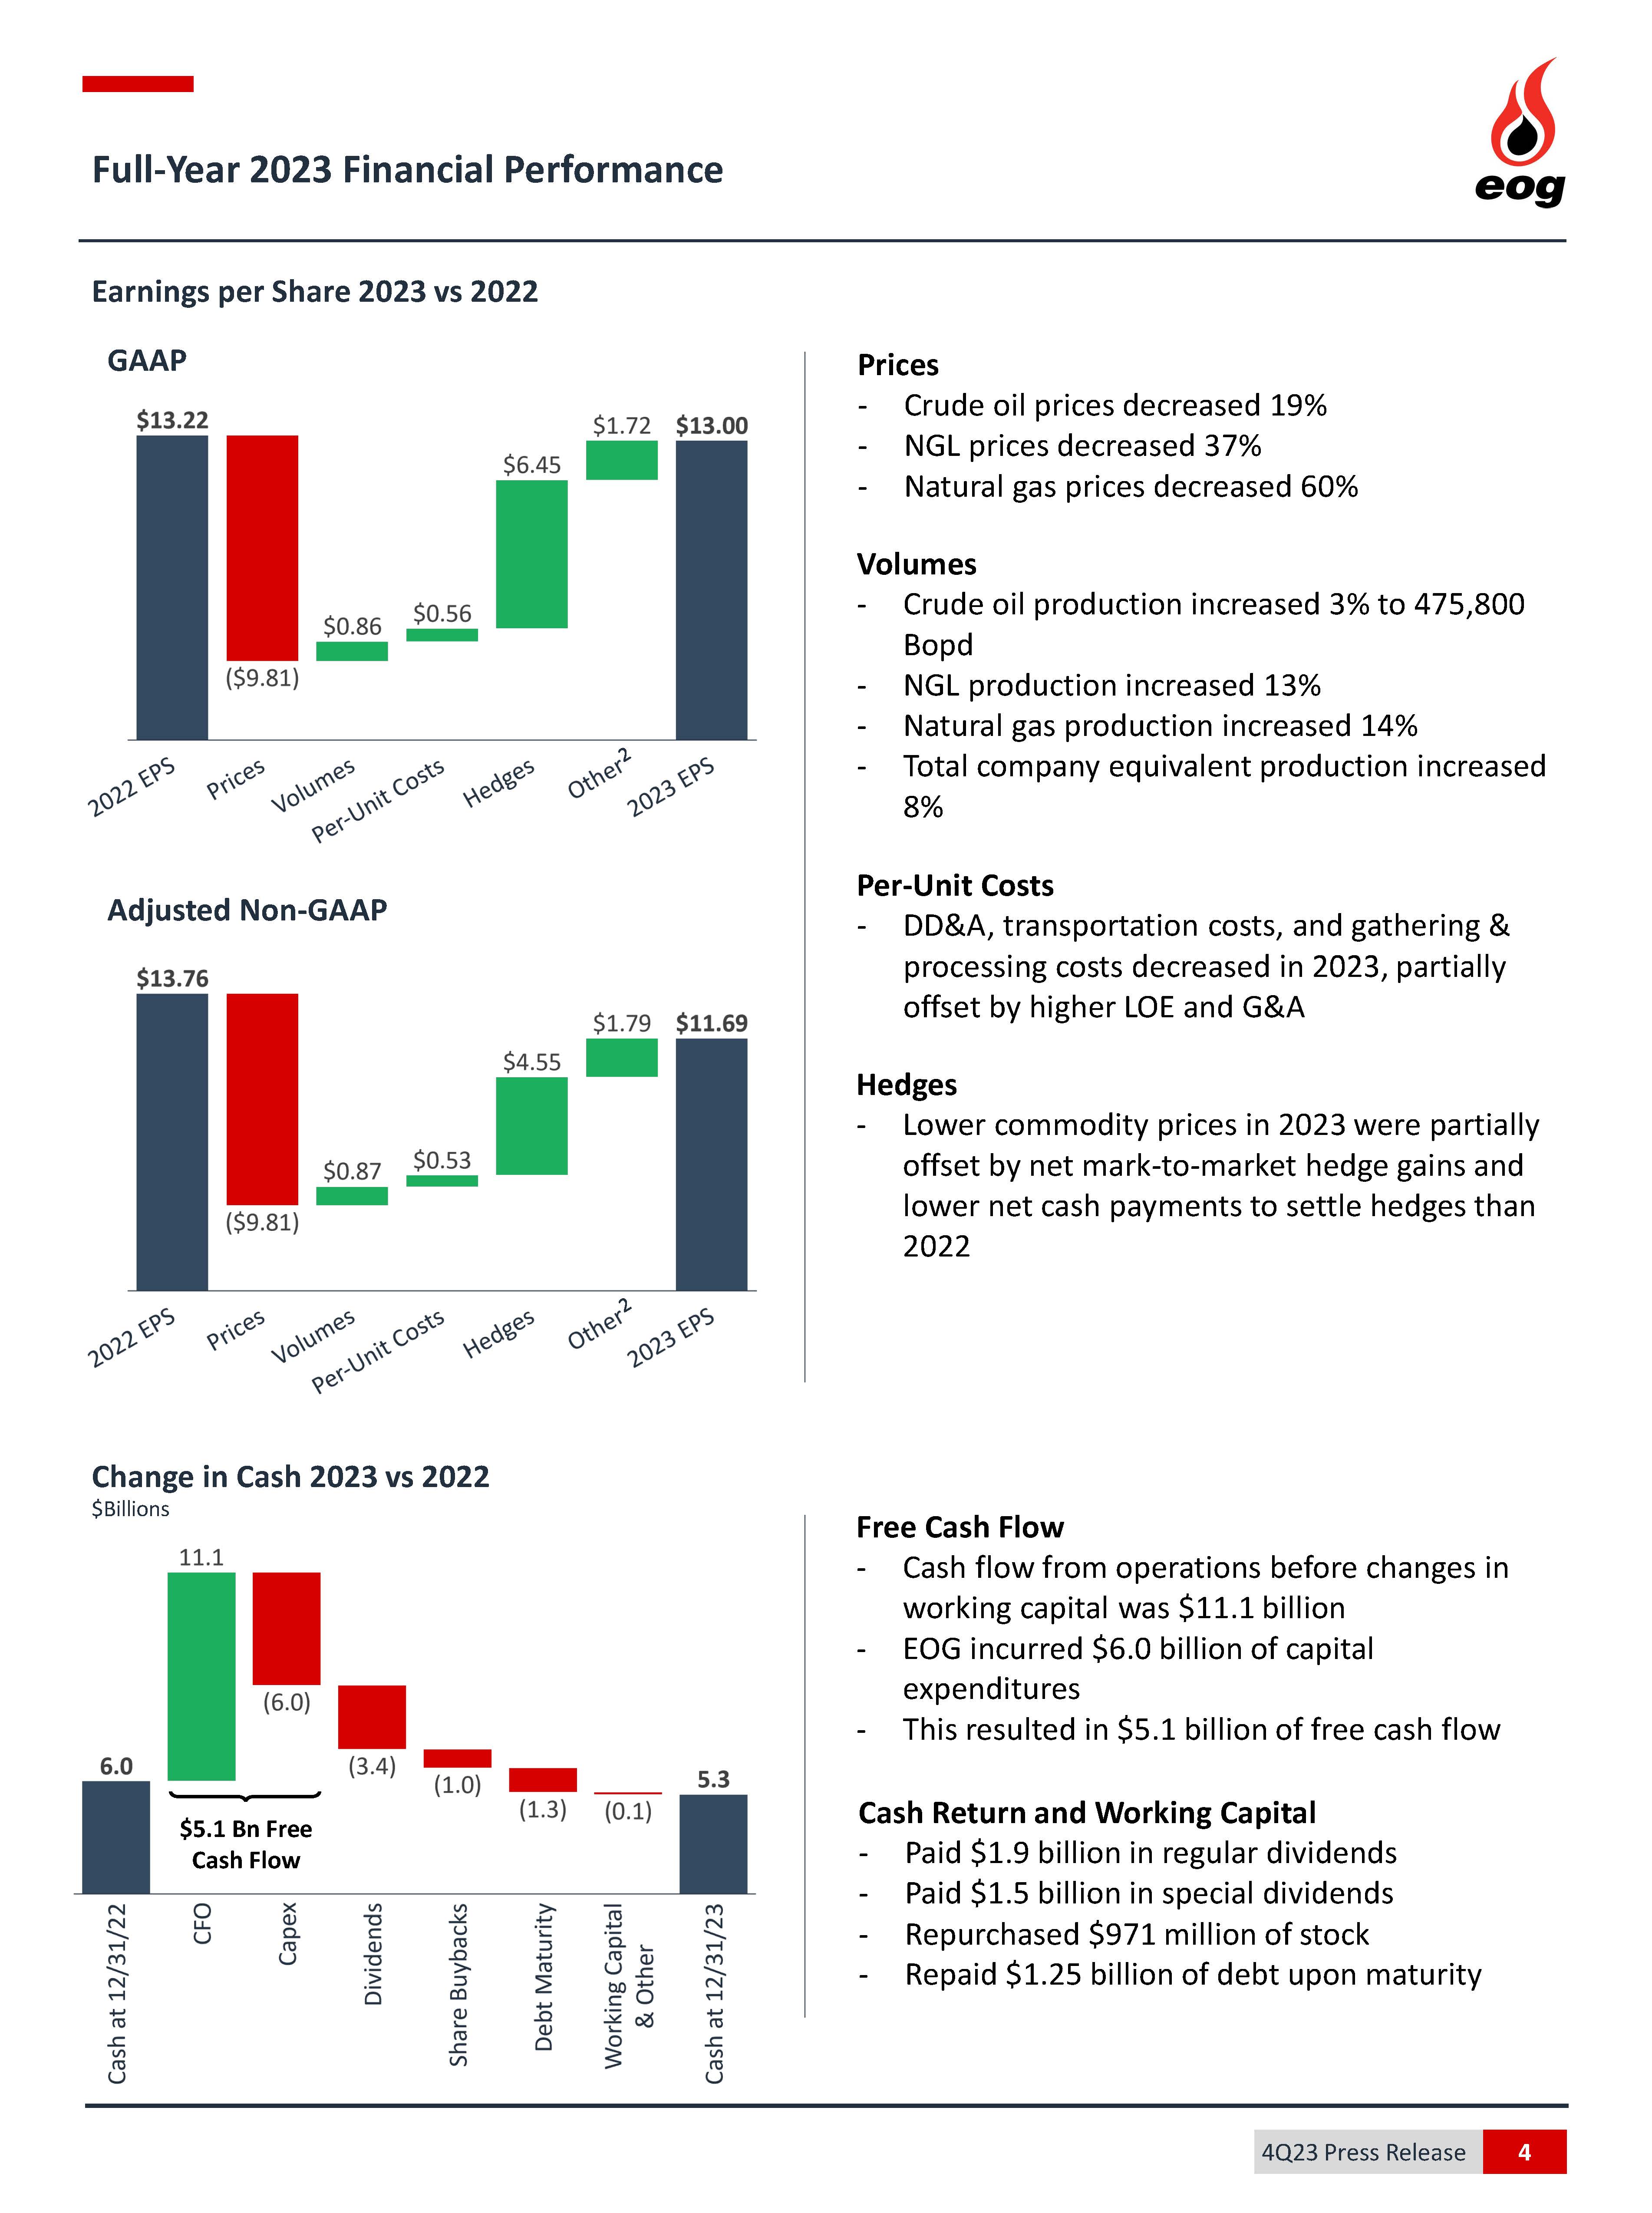
| FY 2022 Net Income per Share (GAAP) | 13.22 | ||||||||||
| Realized Price | |||||||||||
| FY 2023 Composite Average Wellhead Revenue per Boe | 48.34 | ||||||||||
| Less: FY 2022 Composite Average Wellhead Revenue per Boe | (68.77) | ||||||||||
| Subtotal | (20.43) | ||||||||||
| Multiplied by: FY 2023 Crude Oil Equivalent Volumes (MMBoe) | 359.4 | ||||||||||
| Total Change in Revenue | (7,343) | ||||||||||
| Less: Income Tax Benefit (Provision) Imputed (based on 22%) | 1,615 | ||||||||||
| Change in Net Income | (5,728) | ||||||||||
| Change in Diluted Earnings per Share | (9.81) | ||||||||||
| Wellhead Volumes | |||||||||||
| FY 2023 Crude Oil Equivalent Volumes (MMBoe) | 359.4 | ||||||||||
| Less: FY 2022 Crude Oil Equivalent Volumes (MMBoe) | (331.5) | ||||||||||
| Subtotal | 27.9 | ||||||||||
| Multiplied by: FY 2023 Composite Average Margin per Boe (GAAP) (Including Total Exploration Costs) (refer to "Revenues, Costs and Margins Per Barrel of Oil Equivalent" schedule) | 23.24 | ||||||||||
| Change in Margin | 648 | ||||||||||
| Less: Income Tax Benefit (Provision) Imputed (based on 22%) | (143) | ||||||||||
| Change in Net Income | 505 | ||||||||||
| Change in Diluted Earnings per Share | 0.86 | ||||||||||
| Certain Operating Costs per Boe | |||||||||||
| FY 2022 Total Cash Operating Costs (GAAP) and Total DD&A per Boe | 21.21 | ||||||||||
| Less: FY 2023 Total Cash Operating Costs (GAAP) and Total DD&A per Boe | (20.05) | ||||||||||
| Subtotal | 1.16 | ||||||||||
| Multiplied by: FY 2023 Crude Oil Equivalent Volumes (MMBoe) | 359.4 | ||||||||||
| Change in Before-Tax Net Income | 417 | ||||||||||
| Less: Income Tax Benefit (Provision) Imputed (based on 22%) | (92) | ||||||||||
| Change in Net Income | 325 | ||||||||||
| Change in Diluted Earnings per Share | 0.56 | ||||||||||
Net Income Per Share (Continued) | | ||||||||||
| In millions of USD, except share data (in millions), per share data, production volume data and per Boe data (Unaudited) | |||||||||||
| Gains (Losses) on Mark-to-Market Financial Commodity Derivative Contracts, Net | |||||||||||
| FY 2023 Net Gains (Losses) on Mark-to-Market Financial Commodity Derivative Contracts | 818 | ||||||||||
| Less: Income Tax Benefit (Provision) | (176) | ||||||||||
| After Tax - (a) | 642 | ||||||||||
| Less: FY 2022 Net Gains (Losses) on Mark-to-Market Commodity Derivative Contracts | (3,982) | ||||||||||
| Less: Income Tax Benefit (Provision) | 858 | ||||||||||
| After Tax - (b) | (3,124) | ||||||||||
| Change in Net Income - (a) - (b) | 3,766 | ||||||||||
| Change in Diluted Earnings per Share | 6.45 | ||||||||||
Other (1) | 1.72 | ||||||||||
| FY 2023 Net Income per Share (GAAP) | 13.00 | ||||||||||
| FY 2023 Average Number of Common Shares (GAAP) - Diluted | 584 | ||||||||||
| Adjusted Net Income Per Share | | ||||||||||
| In millions of USD, except share data (in millions), per share data, production volume data and per Boe data (Unaudited) | |||||||||||
| 3Q 2023 Adjusted Net Income per Share (Non-GAAP) | 3.44 | ||||||||||
| Realized Price | |||||||||||
| 4Q 2023 Composite Average Wellhead Revenue per Boe | 48.27 | ||||||||||
| Less: 3Q 2023 Composite Average Wellhead Revenue per Boe | (50.46) | ||||||||||
| Subtotal | (2.19) | ||||||||||
| Multiplied by: 4Q 2023 Crude Oil Equivalent Volumes (MMBoe) | 94.4 | ||||||||||
| Total Change in Revenue | (207) | ||||||||||
| Less: Income Tax Benefit (Provision) Imputed (based on 22%) | 46 | ||||||||||
| Change in Net Income | (161) | ||||||||||
| Change in Diluted Earnings per Share | (0.28) | ||||||||||
| Wellhead Volumes | |||||||||||
| 4Q 2023 Crude Oil Equivalent Volumes (MMBoe) | 94.4 | ||||||||||
| Less: 3Q 2023 Crude Oil Equivalent Volumes (MMBoe) | (91.9) | ||||||||||
| Subtotal | 2.5 | ||||||||||
| Multiplied by: 4Q 2023 Composite Average Margin per Boe (Non-GAAP) (Including Total Exploration Costs) (refer to "Revenues, Costs and Margins Per Barrel of Oil Equivalent" schedule) | 23.27 | ||||||||||
| Change in Margin | 58 | ||||||||||
| Less: Income Tax Benefit (Provision) Imputed (based on 22%) | (13) | ||||||||||
| Change in Net Income | 45 | ||||||||||
| Change in Diluted Earnings per Share | 0.08 | ||||||||||
| Certain Operating Costs per Boe | |||||||||||
| 3Q 2023 Total Cash Operating Costs (Non-GAAP) and Total DD&A per Boe | 19.97 | ||||||||||
| Less: 4Q 2023 Total Cash Operating Costs (Non-GAAP) and Total DD&A per Boe | (20.37) | ||||||||||
| Subtotal | (0.40) | ||||||||||
| Multiplied by: 4Q 2023 Crude Oil Equivalent Volumes (MMBoe) | 94.4 | ||||||||||
| Change in Before-Tax Net Income | (38) | ||||||||||
| Less: Income Tax Benefit (Provision) Imputed (based on 22%) | 8 | ||||||||||
| Change in Net Income | (30) | ||||||||||
| Change in Diluted Earnings per Share | (0.05) | ||||||||||
Adjusted Net Income Per Share (Continued) | | ||||||||||
| In millions of USD, except share data (in millions), per share data, production volume data and per Boe data (Unaudited) | |||||||||||
| Net Cash Received from (Payments for) Settlements of Financial Commodity Derivative Contracts | |||||||||||
| 4Q 2023 Net Cash Received from (Payments for) Settlement of Financial Commodity Derivative Contracts | 18 | ||||||||||
| Less: Income Tax Benefit (Provision) | (4) | ||||||||||
| After Tax - (a) | 14 | ||||||||||
| 3Q 2023 Net Cash Received from (Payments for) Settlement of Financial Commodity Derivative Contracts | 23 | ||||||||||
| Less: Income Tax Benefit (Provision) | (5) | ||||||||||
| After Tax - (b) | 18 | ||||||||||
| Change in Net Income - (a) - (b) | (4) | ||||||||||
| Change in Diluted Earnings per Share | (0.01) | ||||||||||
Other (1) | (0.11) | ||||||||||
| 4Q 2023 Adjusted Net Income per Share (Non-GAAP) | 3.07 | ||||||||||
| 4Q 2023 Average Number of Common Shares (Non-GAAP) - Diluted | 581 | ||||||||||
| Adjusted Net Income per Share | | ||||||||||
| In millions of USD, except share data (in millions), per share data, production volume data and per Boe data (Unaudited) | |||||||||||
| FY 2022 Adjusted Net Income per Share (Non-GAAP) | 13.76 | ||||||||||
| Realized Price | |||||||||||
| FY 2023 Composite Average Wellhead Revenue per Boe | 48.34 | ||||||||||
| Less: FY 2022 Composite Average Wellhead Revenue per Boe | (68.77) | ||||||||||
| Subtotal | (20.43) | ||||||||||
| Multiplied by: FY 2023 Crude Oil Equivalent Volumes (MMBoe) | 359.4 | ||||||||||
| Total Change in Revenue | (7,343) | ||||||||||
| Less: Income Tax Benefit (Provision) Imputed (based on 22%) | 1,615 | ||||||||||
| Change in Net Income | (5,728) | ||||||||||
| Change in Diluted Earnings per Share | (9.81) | ||||||||||
| Wellhead Volumes | |||||||||||
| FY 2023 Crude Oil Equivalent Volumes (MMBoe) | 359.4 | ||||||||||
| Less: FY 2022 Crude Oil Equivalent Volumes (MMBoe) | (331.5) | ||||||||||
| Subtotal | 27.9 | ||||||||||
| Multiplied by: FY 2023 Composite Average Margin per Boe (Non-GAAP) (Including Total Exploration Costs) (refer to "Revenues, Costs and Margins Per Barrel of Oil Equivalent" schedule) | 23.36 | ||||||||||
| Change in Margin | 652 | ||||||||||
| Less: Income Tax Benefit (Provision) Imputed (based on 22%) | (143) | ||||||||||
| Change in Net Income | 509 | ||||||||||
| Change in Diluted Earnings per Share | 0.87 | ||||||||||
| Certain Operating Costs per Boe | |||||||||||
| FY 2022 Total Cash Operating Costs (Non-GAAP) and Total DD&A per Boe | 21.16 | ||||||||||
| Less: FY 2023 Total Cash Operating Costs (Non-GAAP) and Total DD&A per Boe | (20.05) | ||||||||||
| Subtotal | 1.11 | ||||||||||
| Multiplied by: FY 2023 Crude Oil Equivalent Volumes (MMBoe) | 359.4 | ||||||||||
| Change in Before-Tax Net Income | 399 | ||||||||||
| Less: Income Tax Benefit (Provision) Imputed (based on 22%) | (88) | ||||||||||
| Change in Net Income | 311 | ||||||||||
| Change in Diluted Earnings per Share | 0.53 | ||||||||||
Adjusted Net Income Per Share (Continued) | | ||||||||||
| In millions of USD, except share data (in millions), per share data, production volume data and per Boe data (Unaudited) | |||||||||||
| Net Cash Received from (Payments for) Settlements of Financial Commodity Derivative Contracts | |||||||||||
| FY 2023 Net Cash Received from (Payments for) Settlement of Financial Commodity Derivative Contracts | (112) | ||||||||||
| Less: Income Tax Benefit (Provision) | 24 | ||||||||||
| After Tax - (a) | (88) | ||||||||||
| FY 2022 Net Cash Received from (Payments for) Settlement of Financial Commodity Derivative Contracts | (3,501) | ||||||||||
| Less: Income Tax Benefit (Provision) | 755 | ||||||||||
| After Tax - (b) | (2,746) | ||||||||||
| Change in Net Income - (a) - (b) | 2,658 | ||||||||||
| Change in Diluted Earnings per Share | 4.55 | ||||||||||
Other (1) | 1.79 | ||||||||||
| FY 2023 Adjusted Net Income per Share (Non-GAAP) | 11.69 | ||||||||||
| FY 2023 Average Number of Common Shares (Non-GAAP) - Diluted | 584 | ||||||||||
| Cash Flow from Operations and Free Cash Flow | | ||||||||||||||||||||||||||||||||||
| In millions of USD (Unaudited) | |||||||||||||||||||||||||||||||||||
The following tables reconcile Net Cash Provided by Operating Activities (GAAP) to Cash Flow from Operations Before Changes in Working Capital (Non-GAAP). EOG believes this presentation may be useful to investors who follow the practice of some industry analysts who adjust Net Cash Provided by Operating Activities for Changes in Components of Working Capital and Other Assets and Liabilities, Changes in Components of Working Capital Associated with Investing Activities and certain other adjustments to exclude non-recurring and certain other items as further described below. EOG defines Free Cash Flow (Non-GAAP) for a given period as Cash Flow from Operations Before Changes in Working Capital (Non-GAAP) (see below reconciliation) for such period less the total capital expenditures (Non-GAAP) during such period, as is illustrated below. EOG management uses this information for comparative purposes within the industry. | |||||||||||||||||||||||||||||||||||
| 2022 | 2023 | ||||||||||||||||||||||||||||||||||
| 1st Qtr | 2nd Qtr | 3rd Qtr | 4th Qtr | Year | 1st Qtr | 2nd Qtr | 3rd Qtr | 4th Qtr | Year | ||||||||||||||||||||||||||
| Net Cash Provided by Operating Activities (GAAP) | 828 | 2,048 | 4,773 | 3,444 | 11,093 | 3,255 | 2,277 | 2,704 | 3,104 | 11,340 | |||||||||||||||||||||||||
| Adjustments: | |||||||||||||||||||||||||||||||||||
| Changes in Components of Working Capital and Other Assets and Liabilities | |||||||||||||||||||||||||||||||||||
| Accounts Receivable | 878 | 522 | (392) | (661) | 347 | (338) | (137) | 714 | (201) | 38 | |||||||||||||||||||||||||
| Inventories | 14 | 157 | 140 | 223 | 534 | 77 | 226 | 28 | (100) | 231 | |||||||||||||||||||||||||
| Accounts Payable | (130) | (259) | 88 | 211 | (90) | 77 | 231 | (238) | 49 | 119 | |||||||||||||||||||||||||
| Accrued Taxes Payable | (613) | 536 | 53 | 137 | 113 | (232) | 212 | (180) | 139 | (61) | |||||||||||||||||||||||||
| Other Assets | 213 | (71) | 129 | 93 | 364 | (52) | (43) | 92 | (36) | (39) | |||||||||||||||||||||||||
| Other Liabilities | 2,250 | (433) | (1,269) | (282) | 266 | (193) | 47 | (54) | 16 | (184) | |||||||||||||||||||||||||
| Changes in Components of Working Capital Associated with Investing Activities | (68) | (143) | (90) | (74) | (375) | (35) | (250) | (28) | 18 | (295) | |||||||||||||||||||||||||
| Cash Flow from Operations Before Changes in Working Capital (Non-GAAP) | 3,372 | 2,357 | 3,432 | 3,091 | 12,252 | 2,559 | 2,563 | 3,038 | 2,989 | 11,149 | |||||||||||||||||||||||||
| Cash Flow from Operations Before Changes in Working Capital (Non-GAAP) | 3,372 | 2,357 | 3,432 | 3,091 | 12,252 | 2,559 | 2,563 | 3,038 | 2,989 | 11,149 | |||||||||||||||||||||||||
| Less: | |||||||||||||||||||||||||||||||||||
Total Capital Expenditures (Non-GAAP) (a) | (1,009) | (1,071) | (1,166) | (1,361) | (4,607) | (1,489) | (1,521) | (1,519) | (1,512) | (6,041) | |||||||||||||||||||||||||
| Free Cash Flow (Non-GAAP) | 2,363 | 1,286 | 2,266 | 1,730 | 7,645 | 1,070 | 1,042 | 1,519 | 1,477 | 5,108 | |||||||||||||||||||||||||
| (a) See below reconciliation of Total Expenditures (GAAP) to Total Capital Expenditures (Non-GAAP): | |||||||||||||||||||||||||||||||||||
| 2022 | 2023 | ||||||||||||||||||||||||||||||||||
| 1st Qtr | 2nd Qtr | 3rd Qtr | 4th Qtr | Year | 1st Qtr | 2nd Qtr | 3rd Qtr | 4th Qtr | Year | ||||||||||||||||||||||||||
| Total Expenditures (GAAP) | 1,144 | 1,521 | 1,410 | 1,535 | 5,610 | 1,717 | 1,664 | 1,803 | 1,634 | 6,818 | |||||||||||||||||||||||||
| Less: | |||||||||||||||||||||||||||||||||||
| Asset Retirement Costs | (27) | (43) | (139) | (89) | (298) | (10) | (26) | (191) | (30) | (257) | |||||||||||||||||||||||||
| Non-Cash Acquisition Costs of Unproved Properties | (58) | (21) | (28) | (20) | (127) | (31) | (28) | (1) | (39) | (99) | |||||||||||||||||||||||||
| Non-Cash Development Drilling | — | — | — | — | — | — | (35) | (50) | (5) | (90) | |||||||||||||||||||||||||
| Acquisition Costs of Proved Properties | (5) | (351) | (42) | (21) | (419) | (4) | (6) | 1 | (7) | (16) | |||||||||||||||||||||||||
| Acquisition Costs of Other Property, Plant and Equipment | — | — | — | — | — | (133) | (1) | — | — | (134) | |||||||||||||||||||||||||
| Exploration Costs | (45) | (35) | (35) | (44) | (159) | (50) | (47) | (43) | (41) | (181) | |||||||||||||||||||||||||
| Total Capital Expenditures (Non-GAAP) | 1,009 | 1,071 | 1,166 | 1,361 | 4,607 | 1,489 | 1,521 | 1,519 | 1,512 | 6,041 | |||||||||||||||||||||||||
| Net Debt-to-Total Capitalization Ratio | | ||||||||||||||||||||||||||||
| In millions of USD, except ratio data (Unaudited) | |||||||||||||||||||||||||||||
| The following tables reconcile Current and Long-Term Debt (GAAP) to Net Debt (Non-GAAP) and Total Capitalization (GAAP) to Total Capitalization (Non-GAAP), as used in the Net Debt-to-Total Capitalization ratio calculation. A portion of the cash is associated with international subsidiaries; tax considerations may impact debt paydown. EOG believes this presentation may be useful to investors who follow the practice of some industry analysts who utilize Net Debt and Total Capitalization (Non-GAAP) in their Net Debt-to-Total Capitalization ratio calculation. EOG management uses this information for comparative purposes within the industry. | |||||||||||||||||||||||||||||
| December 31, 2023 | September 30, 2023 | June 30, 2023 | March 31, 2023 | December 31, 2022 | |||||||||||||||||||||||||
| Total Stockholders' Equity - (a) | 28,090 | 27,758 | 26,257 | 25,447 | 24,779 | ||||||||||||||||||||||||
| Current and Long-Term Debt (GAAP) - (b) | 3,799 | 3,806 | 3,814 | 3,820 | 5,078 | ||||||||||||||||||||||||
| Less: Cash | (5,278) | (5,326) | (4,764) | (5,018) | (5,972) | ||||||||||||||||||||||||
| Net Debt (Non-GAAP) - (c) | (1,479) | (1,520) | (950) | (1,198) | (894) | ||||||||||||||||||||||||
| Total Capitalization (GAAP) - (a) + (b) | 31,889 | 31,564 | 30,071 | 29,267 | 29,857 | ||||||||||||||||||||||||
| Total Capitalization (Non-GAAP) - (a) + (c) | 26,611 | 26,238 | 25,307 | 24,249 | 23,885 | ||||||||||||||||||||||||
Debt-to-Total Capitalization (GAAP) - (b) / [(a) + (b)] | 11.9 | % | 12.1 | % | 12.7 | % | 13.1 | % | 17.0 | % | |||||||||||||||||||
| Net Debt-to-Total Capitalization (Non-GAAP) - (c) / [(a) + (c)] | -5.6 | % | -5.8 | % | -3.8 | % | -4.9 | % | -3.7 | % | |||||||||||||||||||
| Proved Reserves and Reserve Replacement Data | | ||||||||||||||||||||||
| (Unaudited) | |||||||||||||||||||||||
| 2023 Net Proved Reserves Reconciliation Summary | United States | Trinidad | Other International | Total | |||||||||||||||||||
| Crude Oil and Condensate (MMBbl) | |||||||||||||||||||||||
| Beginning Reserves | 1,659 | 2 | — | 1,661 | |||||||||||||||||||
| Revisions | 56 | — | — | 56 | |||||||||||||||||||
| Purchases in Place | 1 | — | — | 1 | |||||||||||||||||||
| Extensions, Discoveries and Other Additions | 219 | — | — | 219 | |||||||||||||||||||
| Sales in Place | (7) | — | — | (7) | |||||||||||||||||||
| Production | (174) | — | — | (174) | |||||||||||||||||||
| Ending Reserves | 1,754 | 2 | — | 1,756 | |||||||||||||||||||
| Natural Gas Liquids (MMBbl) | |||||||||||||||||||||||
| Beginning Reserves | 1,145 | — | — | 1,145 | |||||||||||||||||||
| Revisions | 26 | — | — | 26 | |||||||||||||||||||
| Purchases in Place | 1 | — | — | 1 | |||||||||||||||||||
| Extensions, Discoveries and Other Additions | 169 | — | — | 169 | |||||||||||||||||||
| Sales in Place | (5) | — | — | (5) | |||||||||||||||||||
| Production | (82) | — | — | (82) | |||||||||||||||||||
| Ending Reserves | 1,254 | — | — | 1,254 | |||||||||||||||||||
| Natural Gas (Bcf) | |||||||||||||||||||||||
| Beginning Reserves | 8,273 | 318 | — | 8,591 | |||||||||||||||||||
| Revisions | (327) | 12 | — | (315) | |||||||||||||||||||
| Purchases in Place | 3 | — | — | 3 | |||||||||||||||||||
| Extensions, Discoveries and Other Additions | 1,287 | 29 | — | 1,316 | |||||||||||||||||||
| Sales in Place | (28) | — | — | (28) | |||||||||||||||||||
| Production | (578) | (59) | — | (637) | |||||||||||||||||||
| Ending Reserves | 8,630 | 300 | — | 8,930 | |||||||||||||||||||
| Oil Equivalents (MMBoe) | |||||||||||||||||||||||
| Beginning Reserves | 4,183 | 55 | — | 4,238 | |||||||||||||||||||
| Revisions | 28 | 1 | — | 29 | |||||||||||||||||||
| Purchases in Place | 2 | — | — | 2 | |||||||||||||||||||
| Extensions, Discoveries and Other Additions | 602 | 5 | — | 607 | |||||||||||||||||||
| Sales in Place | (17) | — | — | (17) | |||||||||||||||||||
| Production | (351) | (10) | — | (361) | |||||||||||||||||||
| Ending Reserves | 4,447 | 51 | — | 4,498 | |||||||||||||||||||
| Net Proved Developed Reserves (MMBoe) | |||||||||||||||||||||||
| At December 31, 2022 | 2,162 | 23 | — | 2,185 | |||||||||||||||||||
| At December 31, 2023 | 2,322 | 27 | — | 2,349 | |||||||||||||||||||
| 2023 Exploration and Development Expenditures ($ Millions) | |||||||||||||||||||||||
| Acquisition Cost of Unproved Properties | 207 | — | — | 207 | |||||||||||||||||||
| Exploration Costs | 370 | 53 | 14 | 437 | |||||||||||||||||||
| Development Costs | 4,987 | 114 | — | 5,101 | |||||||||||||||||||
| Total Drilling | 5,564 | 167 | 14 | 5,745 | |||||||||||||||||||
| Acquisition Cost of Proved Properties | 16 | — | — | 16 | |||||||||||||||||||
| Asset Retirement Costs | 241 | 3 | 13 | 257 | |||||||||||||||||||
| Total Exploration and Development Expenditures | 5,821 | 170 | 27 | 6,018 | |||||||||||||||||||
| Gathering, Processing and Other | 799 | 1 | — | 800 | |||||||||||||||||||
| Total Expenditures | 6,620 | 171 | 27 | 6,818 | |||||||||||||||||||
| Proceeds from Sales in Place | (70) | (70) | — | (140) | |||||||||||||||||||
| Net Expenditures | 6,550 | 101 | 27 | 6,678 | |||||||||||||||||||
| Reserve Replacement Costs ($ / Boe) * | |||||||||||||||||||||||
| All-in Total, Net of Revisions | 8.26 | 27.17 | — | 8.44 | |||||||||||||||||||
| All-in Total, Excluding Revisions Due to Price | 7.03 | 27.17 | — | 7.20 | |||||||||||||||||||
| Reserve Replacement * | |||||||||||||||||||||||
| Drilling Only | 172 | % | 50 | % | 0 | % | 168 | % | |||||||||||||||
| All-in Total, Net of Revisions and Dispositions | 175 | % | 60 | % | 0 | % | 172 | % | |||||||||||||||
| All-in Total, Excluding Revisions Due to Price | 207 | % | 60 | % | 0 | % | 202 | % | |||||||||||||||
| All-in Total, Liquids | 180 | % | 0 | % | 0 | % | 180 | % | |||||||||||||||
| * See following reconciliation schedule for calculation methodology | |||||||||||||||||||||||
Reserve Replacement Cost Data | | ||||||||||||||||||||||
| (Unaudited; in millions, except ratio data) | |||||||||||||||||||||||
| For the Twelve Months Ended December 31, 2023 | United States | Trinidad | Other International | Total | |||||||||||||||||||
| Total Costs Incurred in Exploration and Development Activities (GAAP) | 5,821 | 170 | 27 | 6,018 | |||||||||||||||||||
| Less: Asset Retirement Costs | (241) | (3) | (13) | (257) | |||||||||||||||||||
| Non-Cash Acquisition Costs of Unproved Properties | (99) | — | — | (99) | |||||||||||||||||||
| Total Acquisition Costs of Proved Properties | (16) | — | — | (16) | |||||||||||||||||||
| Non-Cash Development Drilling | (90) | — | — | (90) | |||||||||||||||||||
| Exploration Expenses | (166) | (4) | (11) | (181) | |||||||||||||||||||
| Total Exploration and Development Expenditures for Drilling Only (Non-GAAP) - (a) | 5,209 | 163 | 3 | 5,375 | |||||||||||||||||||
| Total Costs Incurred in Exploration and Development Activities (GAAP) | 5,821 | 170 | 27 | 6,018 | |||||||||||||||||||
| Less: Asset Retirement Costs | (241) | (3) | (13) | (257) | |||||||||||||||||||
| Non-Cash Acquisition Costs of Unproved Properties | (99) | — | — | (99) | |||||||||||||||||||
| Non-Cash Acquisition Costs of Proved Properties | (6) | — | — | (6) | |||||||||||||||||||
| Non-Cash Development Drilling | (90) | — | — | (90) | |||||||||||||||||||
| Exploration Expenses | (166) | (4) | (11) | (181) | |||||||||||||||||||
| Total Exploration and Development Expenditures (Non-GAAP) - (b) | 5,219 | 163 | 3 | 5,385 | |||||||||||||||||||
| Total Expenditures (GAAP) | 6,620 | 171 | 27 | 6,818 | |||||||||||||||||||
| Less: Asset Retirement Costs | (241) | (3) | (13) | (257) | |||||||||||||||||||
| Non-Cash Acquisition Costs of Unproved Properties | (99) | — | — | (99) | |||||||||||||||||||
| Non-Cash Acquisition Costs of Proved Properties | (6) | — | — | (6) | |||||||||||||||||||
| Non-Cash Development Drilling | (90) | — | — | (90) | |||||||||||||||||||
| Exploration Expenses | (166) | (4) | (11) | (181) | |||||||||||||||||||
| Total Cash Expenditures (Non-GAAP) | 6,018 | 164 | 3 | 6,185 | |||||||||||||||||||
| Net Proved Reserve Additions From All Sources - Oil Equivalents (MMBoe) | |||||||||||||||||||||||
| Revisions Due to Price - (c) | (110) | — | — | (110) | |||||||||||||||||||
| Revisions Other Than Price | 138 | 1 | — | 139 | |||||||||||||||||||
| Purchases in Place | 2 | — | — | 2 | |||||||||||||||||||
| Extensions, Discoveries and Other Additions - (d) | 602 | 5 | — | 607 | |||||||||||||||||||
| Total Proved Reserve Additions - (e) | 632 | 6 | — | 638 | |||||||||||||||||||
| Sales in Place | (17) | — | — | (17) | |||||||||||||||||||
| Net Proved Reserve Additions From All Sources - (f) | 615 | 6 | — | 621 | |||||||||||||||||||
| Production - (g) | 351 | 10 | — | 361 | |||||||||||||||||||
| Reserve Replacement Costs ($ / Boe) | |||||||||||||||||||||||
| Total Drilling, Before Revisions - (a / d) | 8.65 | 32.60 | — | 8.86 | |||||||||||||||||||
| All-in Total, Net of Revisions - (b / e) | 8.26 | 27.17 | — | 8.44 | |||||||||||||||||||
| All-in Total, Excluding Revisions Due to Price - (b / (e - c)) | 7.03 | 27.17 | — | 7.20 | |||||||||||||||||||
| Reserve Replacement | |||||||||||||||||||||||
| Drilling Only - (d / g) | 172 | % | 50 | % | 0 | % | 168 | % | |||||||||||||||
| All-in Total, Net of Revisions and Dispositions - (f / g) | 175 | % | 60 | % | 0 | % | 172 | % | |||||||||||||||
| All-in Total, Excluding Revisions Due to Price - ((f - c) / g) | 207 | % | 60 | % | 0 | % | 202 | % | |||||||||||||||
Reserve Replacement Cost Data (Continued) | | ||||||||||||||||||||||
| (Unaudited; in millions, except ratio data) | |||||||||||||||||||||||
| For the Twelve Months Ended December 31, 2023 | United States | Trinidad | Other International | Total | |||||||||||||||||||
| Net Proved Reserve Additions From All Sources - Liquids (MMBbl) | |||||||||||||||||||||||
| Revisions | 82 | — | — | 82 | |||||||||||||||||||
| Purchases in Place | 2 | — | — | 2 | |||||||||||||||||||
| Extensions, Discoveries and Other Additions - (h) | 388 | — | — | 388 | |||||||||||||||||||
| Total Proved Reserve Additions | 472 | — | — | 472 | |||||||||||||||||||
| Sales in Place | (12) | — | — | (12) | |||||||||||||||||||
| Net Proved Reserve Additions From All Sources - (i) | 460 | — | — | 460 | |||||||||||||||||||
| Production - (j) | 256 | — | — | 256 | |||||||||||||||||||
| Reserve Replacement - Liquids | |||||||||||||||||||||||
| Drilling Only - (h / j) | 152 | % | 0 | % | 0 | % | 152 | % | |||||||||||||||
| All-in Total, Net of Revisions and Dispositions - (i / j) | 180 | % | 0 | % | 0 | % | 180 | % | |||||||||||||||
Reserve Replacement Cost Data (Continued) | | ||||
| (Unaudited; in millions, except ratio data) | |||||
| For the Twelve Months Ended December 31, 2023 | |||||
| Proved Developed Reserve Replacement Costs ($ / Boe) | Total | ||||
| Total Costs Incurred in Exploration and Development Activities (GAAP) - (k) | 6,018 | ||||
| Less: Asset Retirement Costs | (257) | ||||
| Acquisition Costs of Unproved Properties | (207) | ||||
| Acquisition Costs of Proved Properties | (16) | ||||
| Exploration Expenses | (181) | ||||
| Drillbit Exploration and Development Expenditures (Non-GAAP) - (l) | 5,357 | ||||
| Total Proved Reserves - Extensions, Discoveries and Other Additions (MMBoe) | 607 | ||||
| Add: Conversion of Proved Undeveloped Reserves to Proved Developed | 360 | ||||
| Less: Proved Undeveloped Extensions and Discoveries | (516) | ||||
| Proved Developed Reserves - Extensions and Discoveries (MMBoe) | 451 | ||||
| Total Proved Reserves - Revisions (MMBoe) | 29 | ||||
| Less: Proved Undeveloped Reserves - Revisions | 51 | ||||
| Proved Developed - Revisions Due to Price | 42 | ||||
| Proved Developed Reserves - Revisions Other Than Price (MMBoe) | 122 | ||||
| Proved Developed Reserves - Extensions and Discoveries Plus Revisions Other Than Price (MMBoe) - (m) | 573 | ||||
| Proved Developed Reserve Replacement Costs Excluding Revisions Due to Price ($ / Boe) (GAAP) - (k / m) | 10.50 | ||||
| Proved Developed Reserve Replacement Costs Excluding Revisions Due to Price ($ / Boe) (Non-GAAP) - (l / m) | 9.35 | ||||
| Reserve Replacement Cost Data | | ||||||||||||||||
| In millions of USD, except reserves and ratio data (Unaudited) | |||||||||||||||||
| The following table reconciles Total Costs Incurred in Exploration and Development Activities (GAAP) to Total Exploration and Development Expenditures for Drilling Only (Non-GAAP) and Total Exploration and Development Expenditures (Non-GAAP), as used in the calculation of Reserve Replacement Costs per Boe. There are numerous ways that industry participants present Reserve Replacement Costs, including “Drilling Only” and “All-In”, which reflect total exploration and development expenditures divided by total net proved reserve additions from extensions and discoveries only, or from all sources. Combined with Reserve Replacement, these statistics (and the non-GAAP measures used in calculating such statistics) provide management and investors with an indication of the results of the current year capital investment program. Reserve Replacement Cost statistics (and the non-GAAP measures used in calculating such statistics) are widely recognized and reported by industry participants and are used by EOG management and other third parties for comparative purposes within the industry. Please note that the actual cost of adding reserves will vary from the reported statistics due to timing differences in reserve bookings and capital expenditures. Accordingly, some analysts use three or five year averages of reported statistics, while others prefer to estimate future costs. EOG has not included future capital costs to develop proved undeveloped reserves in exploration and development expenditures. In addition, to further the comparability of the results of EOG’s current-year capital investment program with those of EOG’s peer companies and other companies in the industry, EOG now deducts Exploration Expenses, as illustrated below, in calculating Total Exploration and Development Expenditures for Drilling Only (Non-GAAP), Total Exploration and Development Expenditures (Non-GAAP), Total Cash Expenditures (Non-GAAP), Drillbit Exploration and Development Expenditures (Non-GAAP) and the related Reserve Replacement Costs metrics. Accordingly, Total Exploration and Development Expenditures for Drilling Only (Non-GAAP), Total Exploration and Development Expenditures (Non-GAAP), Total Cash Expenditures (Non-GAAP), Drillbit Exploration and Development Expenditures (Non-GAAP) and the related Reserve Replacement Costs metrics, in each case for fiscal year 2023 and 2022, have been calculated on such basis, and the calculations for each of the prior periods shown have been revised and conformed. | |||||||||||||||||
| 2023 | 2022 | 2021 | |||||||||||||||
| Total Costs Incurred in Exploration and Development Activities (GAAP) | 6,018 | 5,229 | 3,969 | ||||||||||||||
| Less: Asset Retirement Costs | (257) | (298) | (127) | ||||||||||||||
| Non-Cash Acquisition Costs of Unproved Properties | (99) | (127) | (45) | ||||||||||||||
| Total Acquisition Costs of Proved Properties | (16) | (419) | (100) | ||||||||||||||
| Non-Cash Development Drilling | (90) | — | — | ||||||||||||||
| Exploration Expenses | (181) | (159) | (154) | ||||||||||||||
| Total Exploration and Development Expenditures for Drilling Only (Non-GAAP) - (a) | 5,375 | 4,226 | 3,543 | ||||||||||||||
| Total Costs Incurred in Exploration and Development Activities (GAAP) - (b) | 6,018 | 5,229 | 3,969 | ||||||||||||||
| Less: Asset Retirement Costs | (257) | (298) | (127) | ||||||||||||||
| Non-Cash Acquisition Costs of Unproved Properties | (99) | (127) | (45) | ||||||||||||||
| Non-Cash Acquisition Costs of Proved Properties | (6) | (26) | (5) | ||||||||||||||
| Non-Cash Development Drilling | (90) | — | — | ||||||||||||||
| Exploration Expenses | (181) | (159) | (154) | ||||||||||||||
| Total Exploration and Development Expenditures (Non-GAAP) - (c) | 5,385 | 4,619 | 3,638 | ||||||||||||||
| Net Proved Reserve Additions From All Sources - Oil Equivalents (MMBoe) | |||||||||||||||||
| Revisions Due to Price - (d) | (110) | 11 | 194 | ||||||||||||||
| Revisions Other Than Price | 139 | 325 | (308) | ||||||||||||||
| Purchases in Place | 2 | 16 | 9 | ||||||||||||||
| Extensions, Discoveries and Other Additions - (e) | 607 | 560 | 952 | ||||||||||||||
| Total Proved Reserve Additions - (f) | 638 | 912 | 847 | ||||||||||||||
| Sales in Place | (17) | (88) | (11) | ||||||||||||||
| Net Proved Reserve Additions From All Sources | 621 | 824 | 836 | ||||||||||||||
| Production | 361 | 333 | 309 | ||||||||||||||
| Reserve Replacement Costs ($ / Boe) | |||||||||||||||||
| Total Drilling, Before Revisions - (a / e) | 8.86 | 7.55 | 3.72 | ||||||||||||||
| All-in Total, Net of Revisions - (c / f) | 8.44 | 5.06 | 4.30 | ||||||||||||||
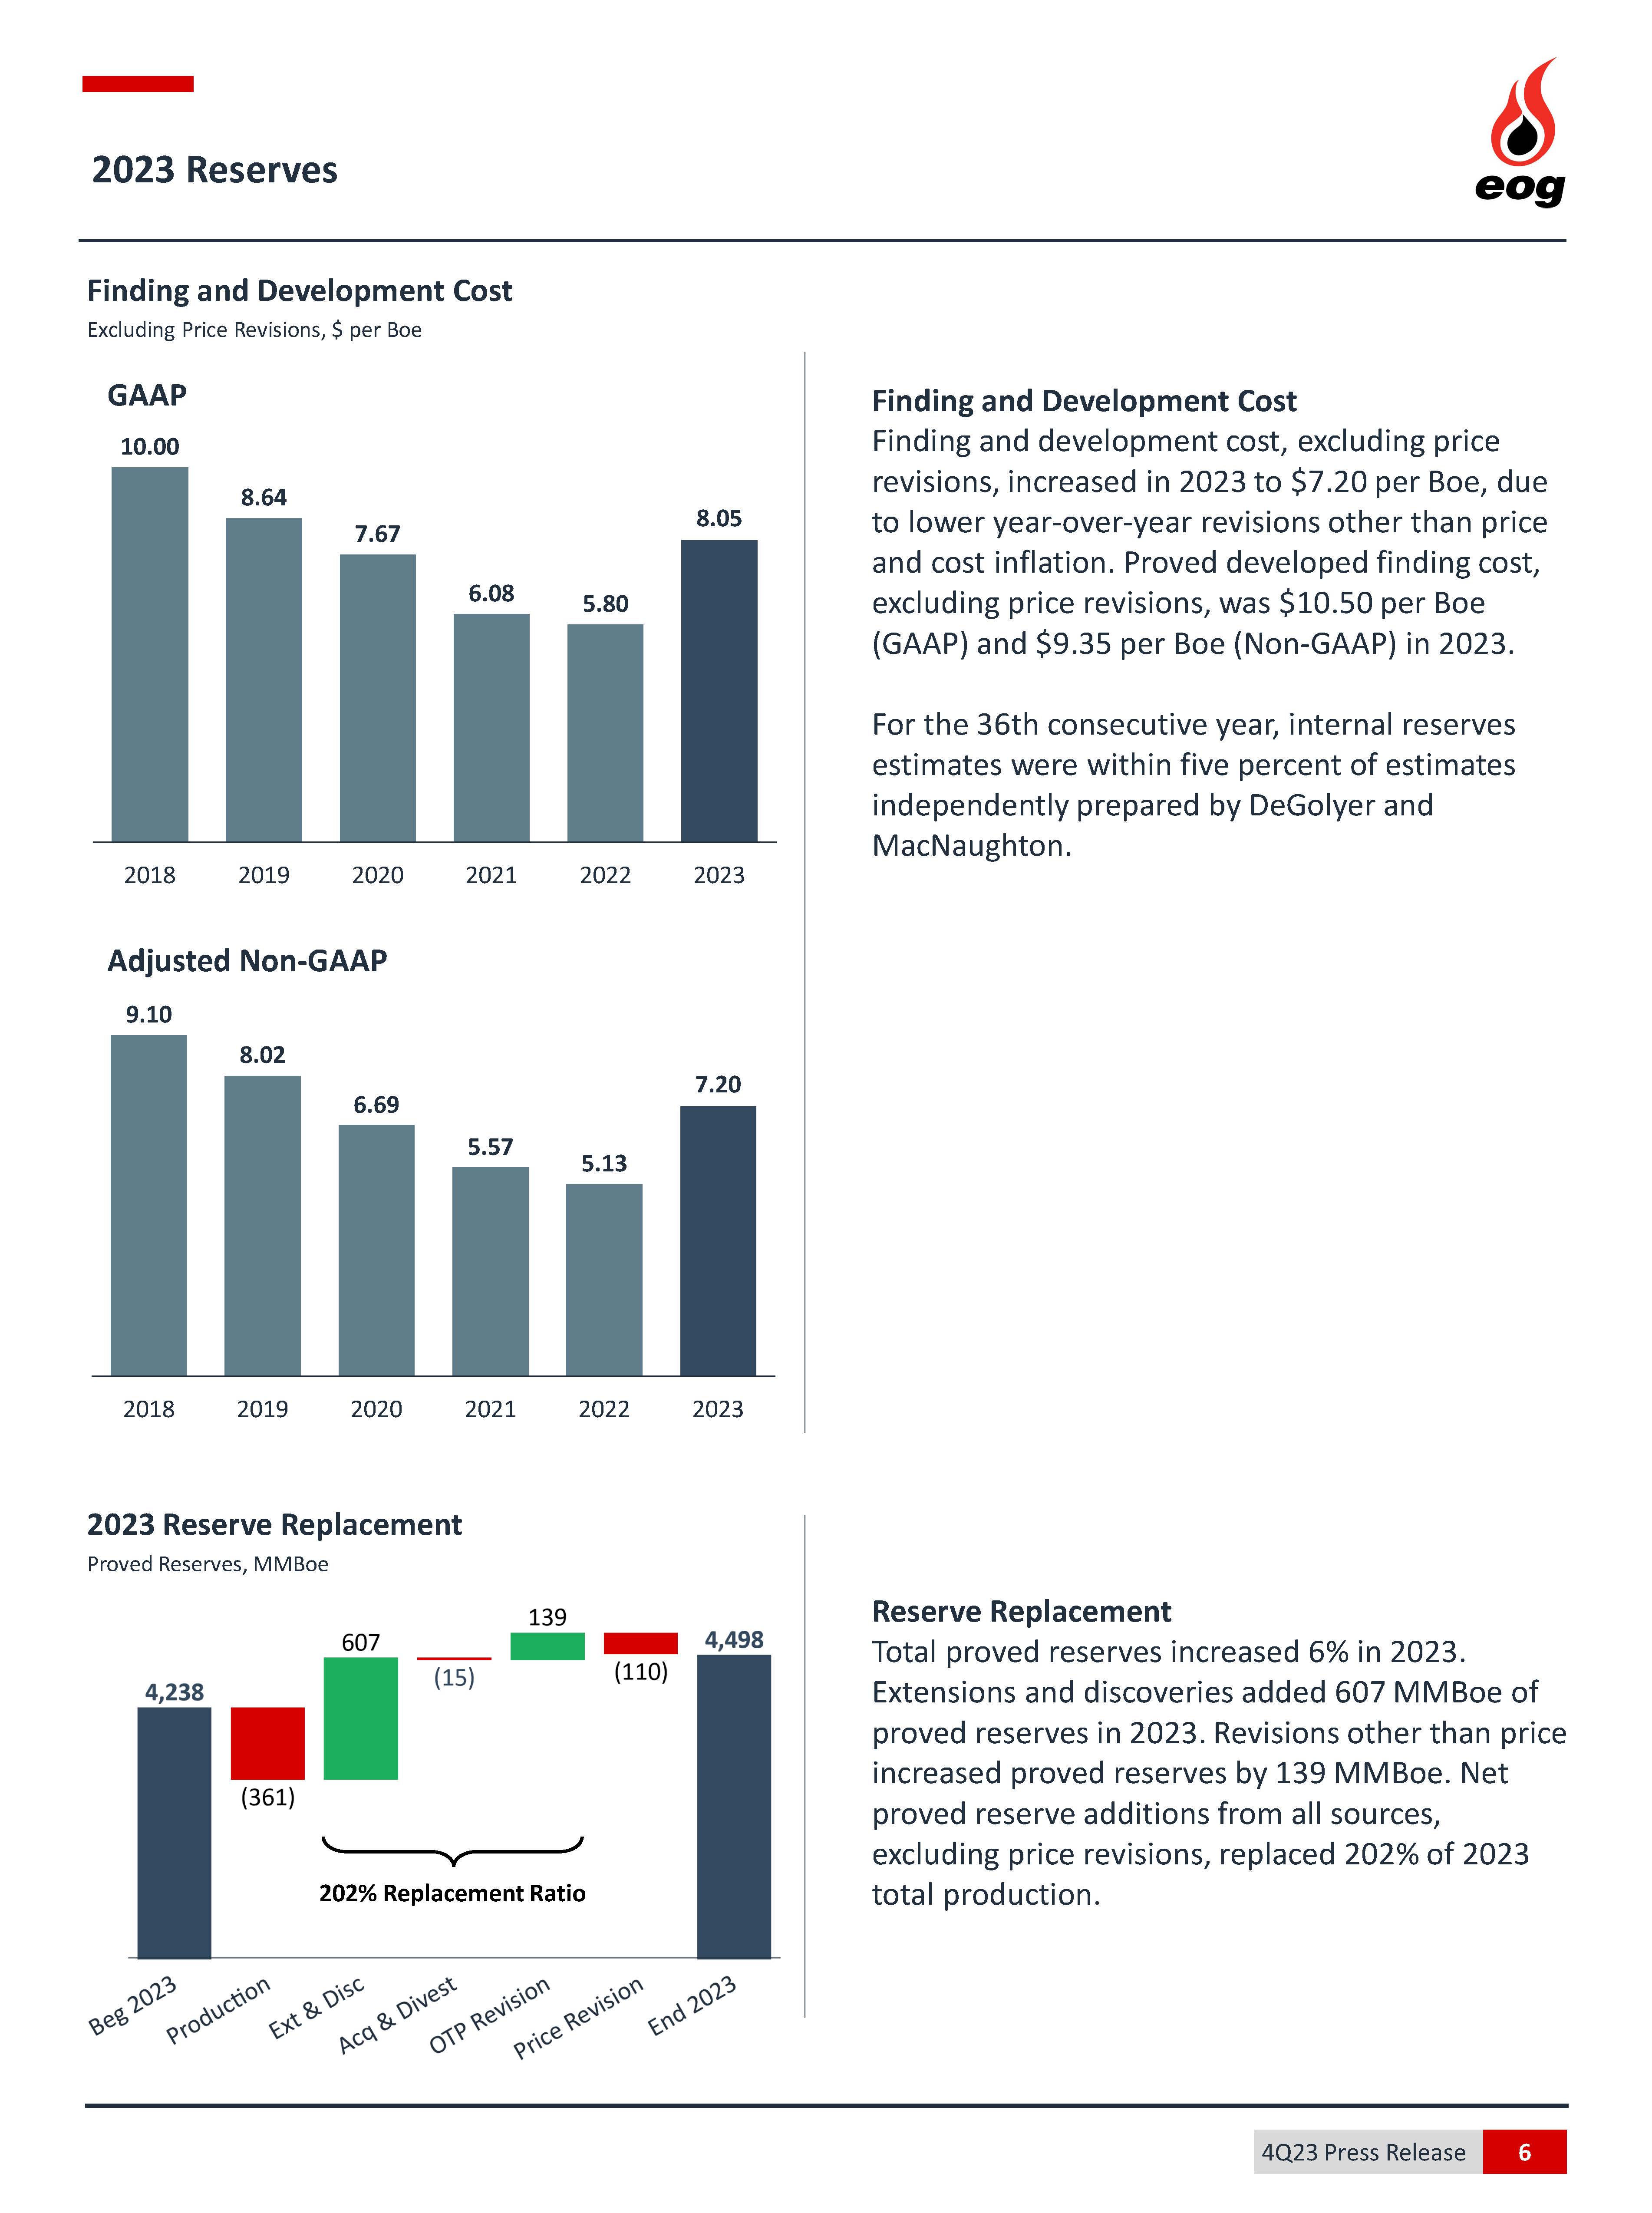
| All-in Total, Excluding Revisions Due to Price (GAAP) - (b / ( f - d)) | 8.05 | 5.80 | 6.08 | ||||||||||||||
| All-in Total, Excluding Revisions Due to Price (Non-GAAP) - (c / ( f - d)) | 7.20 | 5.13 | 5.57 | ||||||||||||||
Reserve Replacement Cost Data (Continued) | | ||||||||||||||||
| In millions of USD, except reserves and ratio data (Unaudited) | |||||||||||||||||
| 2020 | 2019 | 2018 | |||||||||||||||
Total Costs Incurred in Exploration and Development Activities (GAAP) | 3,718 | 6,628 | 6,420 | ||||||||||||||
| Less: Asset Retirement Costs | (117) | (186) | (70) | ||||||||||||||
Non-Cash Acquisition Costs of Unproved Properties | (197) | (98) | (291) | ||||||||||||||
| Total Acquisition Costs of Proved Properties | (135) | (380) | (124) | ||||||||||||||
| Exploration Expenses | (146) | (140) | (149) | ||||||||||||||
Total Exploration and Development Expenditures for Drilling Only (Non-GAAP) - (a) | 3,123 | 5,824 | 5,786 | ||||||||||||||
| Total Costs Incurred in Exploration and Development Activities (GAAP) - (b) | 3,718 | 6,628 | 6,420 | ||||||||||||||
| Less: Asset Retirement Costs | (117) | (186) | (70) | ||||||||||||||
Non-Cash Acquisition Costs of Unproved Properties | (197) | (98) | (291) | ||||||||||||||
Non-Cash Acquisition Costs of Proved Properties | (15) | (52) | (71) | ||||||||||||||
| Exploration Expenses | (146) | (140) | (149) | ||||||||||||||
| Total Exploration and Development Expenditures (Non-GAAP) - (c) | 3,243 | 6,152 | 5,839 | ||||||||||||||
Net Proved Reserve Additions From All Sources - Oil Equivalents (MMBoe) | |||||||||||||||||
| Revisions Due to Price - (d) | (278) | (60) | 35 | ||||||||||||||
| Revisions Other Than Price | (89) | — | (40) | ||||||||||||||
| Purchases in Place | 10 | 17 | 12 | ||||||||||||||
| Extensions, Discoveries and Other Additions - (e) | 564 | 750 | 670 | ||||||||||||||
| Total Proved Reserve Additions - (f) | 207 | 707 | 677 | ||||||||||||||
| Sales in Place | (31) | (5) | (11) | ||||||||||||||
| Net Proved Reserve Additions From All Sources | 176 | 702 | 666 | ||||||||||||||
| Production | 285 | 301 | 265 | ||||||||||||||
| Reserve Replacement Costs ($ / Boe) | |||||||||||||||||
| Total Drilling, Before Revisions - (a / e) | 5.54 | 7.77 | 8.64 | ||||||||||||||
| All-in Total, Net of Revisions - (c / f) | 15.67 | 8.70 | 8.62 | ||||||||||||||
| All-in Total, Excluding Revisions Due to Price (GAAP) - (b / ( f - d)) | 7.67 | 8.64 | 10.00 | ||||||||||||||
| All-in Total, Excluding Revisions Due to Price (Non-GAAP) - (c / ( f - d)) | 6.69 | 8.02 | 9.10 | ||||||||||||||
| Definitions | |||||
| $/Boe | U.S. Dollars per barrel of oil equivalent | ||||
| MMBoe | Million barrels of oil equivalent | ||||
DEI Document and Entity Information |
Feb. 22, 2024 |
|---|---|
| Cover [Abstract] | |
| City Area Code | 713 |
| Local Phone Number | 651-7000 |
| Written Communications | false |
| Soliciting Material | false |
| Pre-commencement Tender Offer | false |
| Pre-commencement Issuer Tender Offer | false |
| Entity Emerging Growth Company | false |
| Entity Central Index Key | 0000821189 |
| Title of 12(b) Security | Common Stock, par value $0.01 per share |
| Entity Incorporation, State or Country Code | DE |
| Document Type | 8-K |
| Document Period End Date | Feb. 22, 2024 |
| Entity File Number | 1-9743 |
| Entity Tax Identification Number | 47-0684736 |
| Trading Symbol | EOG |
| Security Exchange Name | NYSE |
| Amendment Flag | false |
| Entity Registrant Name | EOG RESOURCES, INC. |
| Entity Address, Address Line One | 1111 Bagby |
| Entity Address, Address Line Two | Sky Lobby 2 |
| Entity Address, City or Town | Houston |
| Entity Address, State or Province | TX |
| Entity Address, Postal Zip Code | 77002 |
1 Year EOG Resources Chart |
1 Month EOG Resources Chart |

It looks like you are not logged in. Click the button below to log in and keep track of your recent history.
Support: +44 (0) 203 8794 460 | support@advfn.com
By accessing the services available at ADVFN you are agreeing to be bound by ADVFN's Terms & Conditions
 Hot Features