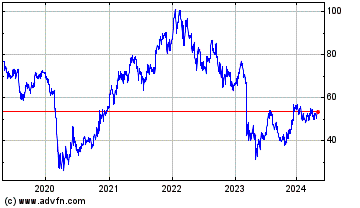
Comerica (NYSE:CMA)
Historical Stock Chart
From Nov 2019 to Nov 2024
ANALYSIS OF NET INTEREST INCOME (FTE) (unaudited)
Comerica Incorporated and Subsidiaries
Three Months Ended
------------------
December 31, 2009 September 30, 2009 December 31, 2008
----------------- ------------------ -----------------
Average Average Average Average Average Average
(dollar amounts in
millions) Balance Interest Rate Balance Interest Rate Balance Interest Rate
------------------ ------- -------- ---- ------- -------- ---- ------- -------- ----
Commercial loans (a) (b) $21,971 $212 3.84 % $23,401 $223 3.79 % $28,507 $334 4.65 %
Real estate construction
loans 3,703 27 2.90 4,033 29 2.83 4,536 46 4.08
Commercial mortgage
loans 10,393 110 4.19 10,359 110 4.21 10,613 138 5.17
Residential mortgage
loans 1,664 21 5.01 1,720 24 5.66 1,851 27 5.80
Consumer loans 2,517 23 3.59 2,550 24 3.68 2,639 30 4.49
Lease financing 1,181 11 3.80 1,218 12 3.96 1,359 12 3.63
International loans 1,324 12 3.73 1,501 14 3.65 1,833 22 4.78
Business loan swap
income - 9 - - 9 - - 5 -
--- --- --- --- --- --- --- --- ---
Total loans (b) 42,753 425 3.95 44,782 445 3.94 51,338 614 4.76
Auction-rate securities
available-for-sale 923 3 1.37 962 3 1.29 769 6 2.95
Other investment
securities available-
for-sale 7,664 51 2.67 8,108 62 3.10 7,965 96 4.86
----- --- ---- ----- --- ---- ----- --- ----
Total investment
securities available-
for-sale 8,587 54 2.53 9,070 65 2.91 8,734 102 4.69
Federal funds sold and securities
purchased
under agreements to
resell 1 - 0.29 2 - 0.29 75 - 0.83
Interest-bearing
deposits with banks (c) 2,480 1 0.25 3,538 2 0.25 811 1 0.50
Other short-term
investments 132 1 1.55 121 1 1.80 176 2 3.59
--- --- ---- --- --- ---- --- --- ----
Total earning assets 53,953 481 3.55 57,513 513 3.55 61,134 719 4.68
Cash and due from banks 831 873 1,056
Allowance for loan
losses (1,048) (992) (780)
Accrued income and other
assets 4,660 4,554 4,571
----- ----- -----
Total assets $58,396 $61,948 $65,981
------- ------- -------
Money market and NOW
deposits (a) $14,113 14 0.39 $13,090 15 0.46 $12,670 37 1.16
Savings deposits 1,376 - 0.08 1,347 - 0.09 1,264 1 0.29
Customer certificates of
deposit 6,823 25 1.42 8,145 46 2.23 8,589 63 2.91
----- --- ---- ----- --- ---- ----- --- ----
Total interest-bearing
core deposits 22,312 39 0.69 22,582 61 1.07 22,523 101 1.78
Other time deposits 1,493 12 3.22 3,573 28 3.05 6,702 56 3.35
Foreign office time
deposits 550 - 0.22 660 - 0.24 516 1 0.81
--- --- ---- --- --- ---- --- --- ----
Total interest-bearing
deposits 24,355 51 0.83 26,815 89 1.32 29,741 158 2.12
Short-term borrowings 222 - 0.09 434 - 0.13 2,808 9 1.27
Medium- and long-term
debt 11,140 32 1.12 13,311 37 1.10 15,016 118 3.14
------ --- ---- ------ --- ---- ------ --- ----
Total interest-bearing
sources 35,717 83 0.92 40,560 126 1.23 47,565 285 2.39
--- ---- --- ---- --- ----
Noninterest-bearing
deposits (a) 14,430 13,225 10,575
Accrued expenses and
other liabilities 1,225 1,098 1,540
Total shareholders'
equity 7,024 7,065 6,301
----- ----- -----
Total liabilities and
shareholders' equity $58,396 $61,948 $65,981
------- ------- -------
Net interest income/rate spread (FTE) $398 2.63 $387 2.32 $434 2.29
---- ---- ----
FTE adjustment $2 $2 $3
--- --- ---
Impact of net noninterest-bearing
sources of funds 0.31 0.36 0.53
---------------- ---- ---- ----
Net interest margin (as a percentage
of average earning assets) (FTE) (b)
(c) 2.94 % 2.68 % 2.82 %
------------------------------------ ---- ---- ----
N/M - Not meaningful
(a) FSD balances included above:
Loans (primarily low-
rate) $205 $- 0.98 % $209 $1 1.94 % $323 $1 1.60 %
Interest-bearing
deposits 342 - 0.30 384 - 0.47 834 3 1.55
Noninterest-bearing
deposits 1,285 1,258 1,320
(b) Impact of FSD loans (primarily
low-rate) on the following:
Commercial loans (0.03) % (0.02) % (0.03) %
Total loans (0.01) (0.01) (0.02)
Net interest margin (FTE) (assuming
loans
were funded by noninterest-bearing
deposits) (0.01) - -
(c) Excess liquidity, represented by average balances deposited with the Federal Reserve Bank, reduced the net interest margin by 13 basis
points and 16 basis points in the fourth and third quarters of 2009, respectively,
and by 3 basis points in the fourth quarter of 2008. Excluding excess liquidity, the net interest margin would have been 3.07%, 2.84% and
2.85% in each respective period.
CONSOLIDATED STATISTICAL DATA (unaudited)
Comerica Incorporated and Subsidiaries
December 31, September 30, June 30, March 31, December 31,
(in millions, except
per share data) 2009 2009 2009 2009 2008
-------------------- ---- ---- ---- ---- ----
Commercial loans:
Floor plan $1,367 $857 $1,492 $1,763 $2,341
Other 20,323 21,689 23,430 24,668 25,658
----- ------ ------ ------ ------ ------
Total commercial loans 21,690 22,546 24,922 26,431 27,999
Real estate construction loans:
Commercial Real Estate
business line (a) 2,988 3,328 3,500 3,711 3,831
Other business lines
(b) 473 542 652 668 646
-------------------- --- --- --- --- ---
Total real estate
construction loans 3,461 3,870 4,152 4,379 4,477
Commercial mortgage loans:
Commercial Real Estate
business line (a) 1,824 1,678 1,728 1,659 1,619
Other business lines
(b) 8,633 8,702 8,672 8,855 8,870
-------------------- ----- ----- ----- ----- -----
Total commercial mortgage
loans 10,457 10,380 10,400 10,514 10,489
Residential mortgage
loans 1,651 1,679 1,759 1,836 1,852
Consumer loans:
Home equity 1,803 1,804 1,801 1,791 1,781
Other consumer 708 740 761 786 811
-------------- --- --- --- --- ---
Total consumer loans 2,511 2,544 2,562 2,577 2,592
Lease financing 1,139 1,197 1,234 1,232 1,343
International loans 1,252 1,355 1,523 1,655 1,753
------------------- ----- ----- ----- ----- -----
Total loans $42,161 $43,571 $46,552 $48,624 $50,505
----------- ------- ------- ------- ------- -------
Goodwill $150 $150 $150 $150 $150
Loan servicing rights 7 8 9 10 11
Tier 1 common capital
ratio (c) (d) 8.18 % 8.04 % 7.66 % 7.32 % 7.08 %
Tier 1 risk-based
capital ratio (d) 12.46 12.21 11.58 11.06 10.66
Total risk-based
capital ratio (d) 16.93 16.79 15.97 15.36 14.72
Leverage ratio (d) 13.22 12.46 12.11 11.65 11.77
Tangible common equity
ratio (c) 7.99 7.96 7.55 7.27 7.21
Book value per common
share $31.82 $31.90 $32.70 $33.32 $33.31
Market value per share for the
quarter:
High 32.30 31.83 26.47 21.20 37.01
Low 26.49 19.94 16.03 11.72 15.05
Close 29.57 29.67 21.15 18.31 19.85
Quarterly ratios:
Return on average
common shareholders'
equity (5.10) % (1.27) % (1.25) % (1.90) % 0.19 %
Return on average
assets (0.19) 0.12 0.11 0.06 0.12
Efficiency ratio 70.52 67.14 72.75 66.61 68.19
Number of banking
centers 447 444 441 440 439
Number of employees -
full time equivalent 9,330 9,384 9,497 9,696 10,186
(a) Primarily loans to real estate investors and developers.
(b) Primarily loans secured by owner-occupied real estate.
(c) See Reconciliation of Non-GAAP Financial Measures.
(d) December 31, 2009 ratios are estimated.
PARENT COMPANY ONLY BALANCE SHEETS (unaudited)
Comerica Incorporated
December September
31, 30, December 31,
(in millions, except share data) 2009 2009 2008
-------------------------------- ---- ---- ----
ASSETS
Cash and due from subsidiary
bank $5 $7 $11
Short-term investments with
subsidiary bank 2,150 2,169 2,329
Other short-term investments 86 84 80
Investment in subsidiaries,
principally banks 5,710 5,711 5,690
Premises and equipment 4 4 5
Other assets 186 197 210
------------ --- --- ---
Total assets $8,141 $8,172 $8,325
------------ ------ ------ ------
LIABILITIES AND SHAREHOLDERS'
EQUITY
Medium- and long-term debt $986 $992 $1,002
Other liabilities 126 145 171
----------------- --- --- ---
Total liabilities 1,112 1,137 1,173
Fixed rate cumulative perpetual
preferred stock, series F,
no par value, $1,000 liquidation
preference per share:
Authorized -2,250,000 shares
Issued -2,250,000 shares at
12/31/09, 09/30/09 and 12/31/08 2,151 2,145 2,129
Common stock - $5 par value:
Authorized -325,000,000 shares
Issued -178,735,252 shares at
12/31/09, 09/30/09 and 12/31/08 894 894 894
Capital surplus 740 738 722
Accumulated other comprehensive
loss (336) (361) (309)
Retained earnings 5,161 5,205 5,345
Less cost of common stock in
treasury -27,555,623 shares at
12/31/09, 27,620,576 shares
at 09/30/09 and 28,244,967
shares at 12/31/08 (1,581) (1,586) (1,629)
-------------------------- ------ ------ ------
Total shareholders' equity 7,029 7,035 7,152
-------------------------- ----- ----- -----
Total liabilities and
shareholders' equity $8,141 $8,172 $8,325
--------------------- ------ ------ ------
CONSOLIDATED STATEMENTS OF CHANGES IN SHAREHOLDERS' EQUITY (unaudited)
Comerica Incorporated and Subsidiaries
Accumulated
Nonredeemable Common Stock Other Total
------------
Preferred Shares Capital Comprehensive Retained Treasury Shareholders'
(in millions, except per
share data) Stock Outstanding Amount Surplus Loss Earnings Stock Equity
------------------------ ----- ----------- ------ ------- ---- -------- ----- ------
BALANCE AT JANUARY 1, 2008 $- 150.0 $894 $564 $(177) $5,497 $(1,661) $5,117
Net income - - - - - 213 - 213
Other comprehensive loss, net
of tax - - - - (132) - - (132)
----
Total comprehensive income 81
Cash dividends declared on
common stock ($2.31 per
share) - - - - - (348) - (348)
Purchase of common stock - - - - - - (1) (1)
Issuance of preferred stock
and related warrant 2,126 - - 124 - - - 2,250
Accretion of discount on
preferred stock 3 - - - - (3) - -
Net issuance of common stock
under employee stock plans - 0.5 - (19) - (14) 33 -
Share-based compensation - - - 53 - - - 53
------------------------ --- --- --- --- --- --- --- ---
BALANCE AT DECEMBER 31, 2008 $2,129 150.5 $894 $722 $(309) $5,345 $(1,629) $7,152
Net income - - - - - 17 - 17
Other comprehensive loss, net
of tax - - - - (27) - - (27)
---
Total comprehensive loss (10)
Cash dividends declared on
preferred stock - - - - - (113) - (113)
Cash dividends declared on
common stock ($0.20 per
share) - - - - - (30) - (30)
Purchase of common stock - (0.1) - - - - (1) (1)
Accretion of discount on
preferred stock 22 - - - - (22) - -
Net issuance of common stock
under employee stock plans - 0.8 - (15) - (36) 48 (3)
Share-based compensation - - - 32 - - - 32
Other - - - 1 - - 1 2
----- --- --- --- --- --- --- --- ---
BALANCE AT DECEMBER 31, 2009 $2,151 151.2 $894 $740 $(336) $5,161 $(1,581) $7,029
---------------------------- ------ ----- ---- ---- ----- ------ ------- ------
BUSINESS SEGMENT FINANCIAL RESULTS (unaudited)
Comerica Incorporated and Subsidiaries
Wealth &
(dollar amounts
in millions) Business Retail Institutional
Three Months
Ended December
31, 2009 Bank Bank Management Finance Other Total
--------------- ---- ---- ---------- ------- ----- -----
Earnings
summary:
Net interest
income
(expense)
(FTE) $343 $129 $42 $(125) $9 $398
Provision for
loan losses 180 36 19 - 22 257
Noninterest
income 77 48 60 26 3 214
Noninterest
expenses 164 161 76 2 21 424
Provision
(benefit) for
income taxes
(FTE) 11 (8) 2 (39) (6) (40)
Income from
discontinued
operations,
net of tax - - - - - -
--- --- --- --- --- ---
Net income
(loss) $65 $(12) $5 $(62) $(25) $(29)
--- ---- --- ---- ---- ----
Net credit-
related
charge-offs $183 $30 $12 $- $- $225
Selected
average
balances:
Assets $32,655 $6,257 $4,841 $10,683 $3,960 $58,396
Loans 32,289 5,733 4,746 - (15) 42,753
Deposits 16,944 17,020 2,849 1,892 80 38,785
Liabilities 16,903 16,978 2,837 13,722 932 51,372
Attributed
equity 3,376 606 373 899 1,770 7,024
Statistical
data:
Return on
average assets
(a) 0.80 % (0.27) % 0.38 % N/M N/M (0.19) %
Return on
average
attributed
equity 7.70 (7.76) 4.91 N/M N/M (5.10)
Net interest
margin (b) 4.21 3.02 3.50 N/M N/M 2.94
Efficiency
ratio 38.98 90.98 75.98 N/M N/M 70.52
---------- ----- ----- ----- --- --- -----
Wealth &
Business Retail Institutional
Three Months Ended September 30, 2009 Bank Bank Management Finance Other Total
------------------------------------- ---- ---- ---------- ------- ----- -----
Earnings summary:
Net interest income (expense) (FTE) $346 $127 $42 $(136) $8 $387
Provision for loan losses 252 42 20 - (3) 311
Noninterest income 72 50 66 121 6 315
Noninterest expenses 160 154 73 3 9 399
Provision (benefit) for income taxes (FTE) (16) (8) 5 (11) 3 (27)
Income from discontinued operations,
net of tax - - - - - -
--- --- --- --- --- ---
Net income (loss) $22 $(11) $10 $(7) $5 $19
--- ---- --- --- --- ---
Net credit-related charge-offs $195 $34 $10 $- $- $239
Selected average balances:
Assets $34,822 $6,445 $4,856 $11,426 $4,399 $61,948
Loans 34,116 5,904 4,760 2 - 44,782
Deposits 15,735 17,563 2,735 3,969 38 40,040
Liabilities 16,002 17,532 2,725 18,361 263 54,883
Attributed equity 3,464 629 373 959 1,640 7,065
Statistical data:
Return on average assets (a) 0.24 % (0.24) % 0.80 % N/M N/M 0.12 %
Return on average attributed equity 2.45 (6.92) 10.40 N/M N/M (1.27)
Net interest margin (b) 4.01 2.87 3.48 N/M N/M 2.68
Efficiency ratio 38.35 86.86 70.84 N/M N/M 67.14
---------------- ----- ----- ----- --- --- -----
Wealth &
Business Retail Institutional
Three Months
Ended December
30, 2008 Bank Bank Management Finance Other Total
--------------- ---- ---- ---------- ------- ----- -----
Earnings summary:
Net interest
income
(expense)
(FTE) $329 $129 $38 $(66) $4 $434
Provision for
loan losses 138 44 13 - (3) 192
Noninterest
income 61 49 73 13 (22) 174
Noninterest
expenses 172 180 80 3 (24) 411
Provision
(benefit) for
income taxes
(FTE) 27 (12) 5 (19) (15) (14)
Income from discontinued
operations,
net of tax - - - - 1 1
--- --- --- --- --- ---
Net income
(loss) $53 $(34) $13 $(37) $25 $20
--- ---- --- ---- --- ---
Net credit-
related
charge-offs $101 $23 $9 $- $- $133
Selected average balances:
Assets $41,332 $7,007 $4,879 $10,959 $1,804 $65,981
Loans 40,245 6,379 4,724 (4) (6) 51,338
Deposits 13,789 17,065 2,255 6,892 315 40,316
Liabilities 14,367 17,053 2,300 25,220 740 59,680
Attributed
equity 3,337 665 341 979 979 6,301
Statistical data:
Return on
average assets
(a) 0.51 % (0.76) % 1.05 % N/M N/M 0.12 %
Return on
average
attributed
equity 6.33 (20.18) 15.03 N/M N/M 0.19
Net interest
margin (b) 3.24 3.01 3.14 N/M N/M 2.82
Efficiency
ratio 44.15 100.79 75.73 N/M N/M 68.19
---------- ----- ------ ----- --- --- -----
(a) Return on average assets is calculated based on the greater of average assets or average liabilities and
attributed equity.
(b) Net interest margin is calculated based on the greater of average earning assets or average deposits and
purchased funds.
FTE - Fully Taxable Equivalent
N/M - Not Meaningful
--------------------
MARKET SEGMENT FINANCIAL RESULTS (unaudited)
Comerica Incorporated and Subsidiaries
Finance
(dollar amounts
in millions) Other & Other
Three Months
Ended December
31, 2009 Midwest Western Texas Florida Markets International Businesses Total
--------------- ------- ------- ----- ------- ------- ------------- ---------- -----
Earnings summary:
Net interest
income (expense)
(FTE) $205 $163 $78 $10 $40 $18 $(116) $398
Provision for
loan losses 102 79 20 - 15 19 22 257
Noninterest
income 106 33 23 3 11 9 29 214
Noninterest
expenses 192 110 61 9 21 8 23 424
Provision
(benefit) for
income taxes
(FTE) 4 - 7 1 (7) - (45) (40)
Income from
discontinued
operations,
net of tax - - - - - - - -
--- --- --- --- --- --- --- ---
Net income (loss) $13 $7 $13 $3 $22 $- $(87) $(29)
--- --- --- --- --- --- ---- ----
Net credit-
related charge-
offs $97 $85 $13 $4 $13 $13 $- $225
Selected average
balances:
Assets $16,090 $13,484 $7,118 $1,608 $3,765 $1,688 $14,643 $58,396
Loans 15,811 13,289 6,934 1,613 3,458 1,663 (15) 42,753
Deposits 17,201 11,899 4,737 333 1,704 939 1,972 38,785
Liabilities 17,186 11,817 4,723 318 1,746 928 14,654 51,372
Attributed equity 1,529 1,386 691 176 401 172 2,669 7,024
Statistical data:
Return on average
assets (a) 0.28 % 0.21 % 0.75 % 0.63 % 2.32 % 0.06 % N/M (0.19) %
Return on average
attributed
equity 3.38 2.00 7.74 5.72 21.78 0.58 N/M (5.10)
Net interest
margin (b) 4.73 4.85 4.46 2.57 4.57 4.22 N/M 2.94
Efficiency ratio 61.97 56.08 60.26 69.94 42.41 28.74 N/M 70.52
---------------- ----- ----- ----- ----- ----- ----- -- -----
Finance
Other & Other
Three Months
Ended September
30, 2009 Midwest Western Texas Florida Markets International Businesses Total
---------------- ------- ------- ----- ------- ------- ------------- ---------- -----
Earnings summary:
Net interest
income (expense)
(FTE) $209 $159 $77 $11 $39 $20 $(128) $387
Provision for
loan losses 144 101 29 24 10 6 (3) 311
Noninterest
income 107 33 22 3 14 9 127 315
Noninterest
expenses 188 106 58 10 17 8 12 399
Provision
(benefit) for
income taxes
(FTE) (10) (8) 5 (8) (3) 5 (8) (27)
Income from
discontinued
operations,
net of tax - - - - - - - -
--- --- --- --- --- --- --- ---
Net income (loss) $(6) $(7) $7 $(12) $29 $10 $(2) $19
--- --- --- ---- --- --- --- ---
Net credit-
related charge-
offs $102 $95 $22 $9 $10 $1 $- $239
Selected average
balances:
Assets $16,987 $14,114 $7,444 $1,673 $3,997 $1,908 $15,825 $61,948
Loans 16,387 13,923 7,221 1,674 3,683 1,892 2 44,782
Deposits 17,395 11,146 4,609 327 1,696 860 4,007 40,040
Liabilities 17,667 11,060 4,618 317 1,748 849 18,624 54,883
Attributed equity 1,577 1,393 722 180 418 176 2,599 7,065
Statistical data:
Return on average
assets (a) (0.14) % (0.20) % 0.39 % (2.81) % 2.92 % 1.94 % N/M 0.12 %
Return on average
attributed
equity (1.74) (1.99) 4.01 (26.20) 27.91 21.01 N/M (1.27)
Net interest
margin (b) 4.72 4.53 4.22 2.70 4.24 4.08 N/M 2.68
Efficiency ratio 59.58 54.96 59.18 70.34 34.57 28.39 N/M 67.14
---------------- ----- ----- ----- ----- ----- ----- -- -----
Finance
Other & Other
Three Months
Ended December
30, 2008 Midwest Western Texas Florida Markets International Businesses Total
--------------- ------- ------- ----- ------- ------- ------------- ---------- -----
Earnings summary:
Net interest
income (expense)
(FTE) $202 $157 $72 $11 $38 $16 $(62) $434
Provision for
loan losses 59 70 19 14 27 6 (3) 192
Noninterest
income 109 34 20 4 9 7 (9) 174
Noninterest
expenses 218 114 63 11 16 10 (21) 411
Provision
(benefit) for
income taxes
(FTE) 20 5 6 (3) (11) 3 (34) (14)
Income from discontinued
operations,
net of tax - - - - - - 1 1
--- --- --- --- --- --- --- ---
Net income (loss) $14 $2 $4 $(7) $15 $4 $(12) $20
--- --- --- --- --- --- ---- ---
Net credit-
related charge-
offs $38 $65 $8 $6 $16 $- $- $133
Selected average balances:
Assets $19,942 $16,243 $8,215 $1,938 $4,612 $2,268 $12,763 $65,981
Loans 18,966 16,032 7,974 1,942 4,248 2,186 (10) 51,338
Deposits 16,204 10,762 4,070 222 1,206 645 7,207 40,316
Liabilities 16,733 10,716 4,090 216 1,330 635 25,960 59,680
Attributed equity 1,613 1,381 650 146 405 148 1,958 6,301
Statistical data:
Return on average
assets (a) 0.28 % 0.05 % 0.20 % (1.46) % 1.30 % 0.69 % N/M 0.12 %
Return on average
attributed
equity 3.47 0.63 2.49 (19.46) 14.86 10.62 N/M 0.19
Net interest
margin (b) 4.21 3.88 3.57 2.26 3.55 2.83 N/M 2.82
Efficiency ratio 70.37 59.54 68.41 72.81 37.57 43.36 N/M 68.19
---------------- ----- ----- ----- ----- ----- ----- -- -----
(a) Return on average assets is calculated based on the greater of average assets or average liabilities and attributed
equity.
(b) Net interest margin is calculated based on the greater of average earning assets or average deposits and purchased
funds.
FTE - Fully Taxable Equivalent
N/M - Not Meaningful
--------------------
RECONCILIATION OF NON-GAAP FINANCIAL MEASURES (unaudited)
Comerica Incorporated and Subsidiaries
December September December
31, 30, June 30, March 31, 31,
(dollar amounts in
millions) 2009 2009 2009 2009 2008
------------------ ---- ---- ---- ---- ----
Tier 1 capital (a)
(b) $7,704 $7,735 $7,774 $7,760 $7,805
Less:
Fixed rate
cumulative
perpetual
preferred stock 2,151 2,145 2,140 2,134 2,129
Trust preferred
securities 495 495 495 495 495
--------------- --- --- --- --- ---
Tier 1 common
capital (b) $5,058 $5,095 $5,139 $5,131 $5,181
------------- ------ ------ ------ ------ ------
Risk-weighted
assets (a) (b) $61,842 $63,355 $67,124 $70,135 $73,207
Tier 1 common
capital ratio (b) 8.18 % 8.04 % 7.66 % 7.32 % 7.08 %
------------------ ---- ---- ---- ---- ----
Total
shareholders'
equity $7,029 $7,035 $7,093 $7,183 $7,152
Less:
Fixed rate
cumulative
perpetual
preferred stock 2,151 2,145 2,140 2,134 2,129
Goodwill 150 150 150 150 150
Other intangible
assets 8 8 10 11 12
---------------- --- --- --- --- ---
Tangible common
equity $4,720 $4,732 $4,793 $4,888 $4,861
--------------- ------ ------ ------ ------ ------
Total assets $59,263 $59,590 $63,630 $67,370 $67,548
Less:
Goodwill 150 150 150 150 150
Other intangible
assets 8 8 10 11 12
---------------- --- --- --- --- ---
Tangible assets $59,105 $59,432 $63,470 $67,209 $67,386
--------------- ------- ------- ------- ------- -------
Tangible common
equity ratio 7.99 % 7.96 % 7.55 % 7.27 % 7.21 %
--------------- ---- ---- ---- ---- ----
(a) Tier 1 capital and risk-weighted assets as defined by regulation.
(b) December 31, 2009 Tier 1 capital and risk-weighted assets are estimated.
----------------------------------------------------------------------------
http://www.newscom.com/cgi-bin/prnh/20010807/CMALOGO
http://photoarchive.ap.org/
DATASOURCE: Comerica Incorporated
CONTACT: Media, Wayne J. Mielke, +1-214-462-4463, or Investor, Darlene
P. Persons, +1-214-462-6831, or Walter Galloway, +1-214-462-6834, all of
Comerica Incorporated
Web Site: http://www.comerica.com/
http://www.comerica.com/