ADVFN Logo ADVFN

We could not find any results for:
Make sure your spelling is correct or try broadening your search.

Trending Now

Toplists

It looks like you aren't logged in.
Click the button below to log in and view your recent history.

Hot Features

Registration Strip Icon for discussion Register to chat with like-minded investors on our interactive forums.

CMA Comerica Inc

53.71
0.51 (0.96%)
31 Jul 2024 - Closed
Delayed by 15 minutes
Share Name Share Symbol Market Type
Comerica Inc NYSE:CMA NYSE Common Stock
  Price Change % Change Share Price High Price Low Price Open Price Shares Traded Last Trade
  0.51 0.96% 53.71 53.99 53.29 53.63 1,830,695 01:00:00

California Economy Holds Recent Gains in October Reports the Comerica Bank California Economic Activity Index

08/12/2009 5:29pm

PR Newswire (US)


Comerica (NYSE:CMA)
Historical Stock Chart


From Jul 2019 to Jul 2024
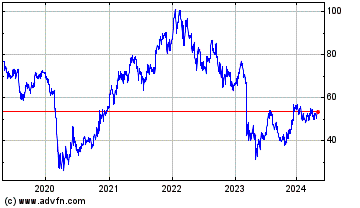
Click Here for more Comerica Charts.
DALLAS, Dec. 8 /PRNewswire-FirstCall/ -- After recording six consecutive monthly increases, Comerica Bank's California Economic Activity Index was unchanged in October, at a level of 102. The Index in October remains up 11 points, or 12 percent, cumulatively from its March cyclical low of 91. (Logo: http://www.newscom.com/cgi-bin/prnh/20010807/CMALOGO) "The employment component of our Index has now contributed negatively for 18 consecutive months," said Dana Johnson, Chief Economist at Comerica Bank. "However, California likely will see job increases in early 2010, given the growing array of labor market indicators that have been improving in recent months. Once that emerges, all nine components of our index will be contributing positively, and a self-sustaining expansion will be firmly in place." The California Economic Activity Index equally weights nine, seasonally-adjusted coincident indicators of real economic activity. These indicators reflect activity in the manufacturing, tourism, travel and trade sectors, as well as job growth and consumer outlays. The Index levels represent a 3-month moving average, used to smooth monthly volatility. The Index is benchmarked so that 2008 equals 100. A complete historical series dating to 1997 is available upon request. Comerica Incorporated is a financial services company headquartered in Dallas, Texas, and strategically aligned by three business segments: The Business Bank, The Retail Bank, and Wealth & Institutional Management. Comerica focuses on relationships, and helping people and businesses be successful. In addition to Texas, Comerica Bank locations can be found in Arizona, California, Florida and Michigan, with select businesses operating in several other states, as well as in Canada and Mexico. Comerica reported total assets of $59.6 billion as of September 30, 2009. To receive this index directly to your email inbox, go to http://www.comerica.com/econsubscribe to subscribe. http://www.newscom.com/cgi-bin/prnh/20010807/CMALOGO http://photoarchive.ap.org/ DATASOURCE: Comerica Incorporated CONTACT: Media, Dana Johnson, Senior Vice President and Chief Economist, +1-214-462-6839, , or Data Contact, Meaghan Derrick, Research Assistant, +1-214-462-6815, , both of Comerica Incorporated Web Site: http://www.comerica.com/

Copyright

1 Year Comerica Chart

1 Year Comerica Chart

1 Month Comerica Chart

1 Month Comerica Chart

Your Recent History

Delayed Upgrade Clock