
We could not find any results for:
Make sure your spelling is correct or try broadening your search.
| Share Name | Share Symbol | Market | Type |
|---|---|---|---|
| Bank of America Corporation | NYSE:BAC | NYSE | Common Stock |
| Price Change | % Change | Share Price | High Price | Low Price | Open Price | Shares Traded | Last Trade | |
|---|---|---|---|---|---|---|---|---|
| 0.45 | 1.22% | 37.33 | 37.53 | 37.08 | 37.25 | 34,082,664 | 01:00:00 |
From May 2019 to May 2024
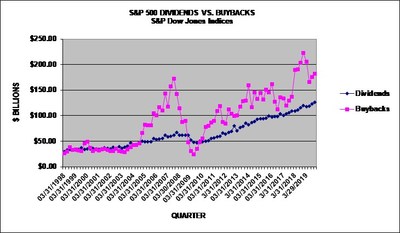
NEW YORK, March 24, 2020 /PRNewswire/ -- S&P Dow Jones Indices ("S&P DJI") announced today that preliminary Q4 2019 S&P 500® stock buybacks, or share repurchases, were $181.6 billion – a 3.2% increase over Q3 2019's $175.9 billion, but down 18.6% from Q4 2018's $223.0 billion record.
Historical data on S&P 500 buybacks are available at www.spdji.com/indices/equity/sp-500.
Key Takeaways:
"After lowering expenditures in the first half of 2019 from their tax-inspired record-setting buying spree of 2018, companies increased their share repurchases in Q3 by 6.3% and in Q4 by 3.2%," said Howard Silverblatt, Senior Index Analyst at S&P Dow Jones Indices. "While the levels are still shy of the 2018 record, they are significantly higher than the pre-2018 levels, and continued to surpass the hoped for $170 billion mark, which was seen as the level needed to support stocks and continue reduced share count EPS growth."
2020 Outlook:
"COVID-19 has significantly changed the 2020 landscape, as dividends are under pressure and buybacks appear to be gasping for air," said Silverblatt, who pointed out that buybacks must now compete with other corporate priorities as uncertainty over liquidity is at its highest since the 2008 financial crisis. For 2020:
Q4 2019 GICS® Sector Analysis:
Information Technology buybacks reversed its prior two quarters of expenditure declines, spending $52.4 billion for the quarter, up 6.5% from the prior quarters $47.8 billion, but down 14.5% from the Q4 2018 $61.3 billion level. On a percentage basis, the sector represented 28.9% of all buybacks, up from the prior quarters 28.0%. For the year, the group spent $224.8 billion, representing 30.9% of the buybacks, down 19.3% from the 2018 $278.5 billion expenditure, which represented 34.5% of the buybacks.
Financials remained right behind Information Technology as they increased expenditures 5.1% to $50.2 billion, up from last quarter's $47.8 billion, representing 27.6% of all buybacks, up from 27.2% in Q3 2019. For the year, the group spent $178.7 billion, representing 24.5% of all buybacks, up 19.1% from their 2018 expenditure of $150.1 billion, which represented 18.6% of the buybacks.
Health Care buybacks increased 25.2% to $20.0 billion from last quarter's 16.0 billion, as the full year declined 22.8% to $83.9 billion from $108.7 billion in 2018.
Issues:
The five issues with the highest total buybacks for Q4 2019 are:
For more information about S&P Dow Jones Indices, please visit www.spdji.com.
S&P Dow Jones Indices | ||||||||
S&P 500, $ U.S. BILLIONS | (preliminary and estimates in bold) | |||||||
PERIOD | MARKET | OPERATING | AS REPORTED | DIVIDEND & | ||||
VALUE | EARNINGS | EARNINGS | DIVIDENDS | BUYBACKS | DIVIDEND | BUYBACK | BUYBACK | |
$ BILLIONS | $ BILLIONS | $ BILLIONS | $ BILLIONS | $ BILLIONS | YIELD | YIELD | YIELD | |
2019 | $26,759.69 | $1,304.59 | $1,158.72 | $485.48 | $728.74 | 1.81% | 2.72% | 4.54% |
2018 | $21,026.90 | $1,281.66 | $1,119.43 | $456.31 | $806.41 | 2.17% | 3.84% | 6.01% |
2017 | $22,821.24 | $1,066.00 | $940.86 | $419.77 | $519.40 | 1.84% | 2.28% | 4.12% |
2016 | $19,267.93 | $919.85 | $818.55 | $397.21 | $536.38 | 2.06% | 2.78% | 4.85% |
2015 | $17,899.56 | $885.38 | $762.74 | $382.32 | $572.16 | 2.14% | 3.20% | 5.33% |
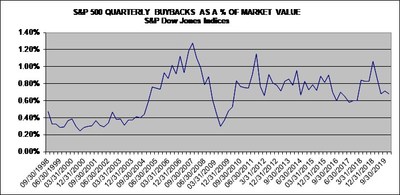
12/31/2019 | $26,760 | $324.35 | $294.78 | $126.35 | $181.58 | 1.81% | 2.72% | 4.54% |
9/30/2019 | $24,707 | $330.42 | $282.12 | $123.12 | $175.89 | 1.94% | 3.12% | 5.06% |
6/28/2019 | $24,423 | $333.26 | $290.00 | $118.68 | $165.46 | 1.93% | 3.27% | 5.20% |
3/29/2019 | $23,619 | $316.56 | $291.82 | $117.33 | $205.81 | 1.97% | 3.49% | 5.45% |
12/31/2018 | $21,027 | $293.82 | $242.91 | $119.81 | $222.98 | 2.17% | 3.84% | 6.01% |
9/30/2018 | $24,579 | $349.04 | $306.70 | $115.72 | $203.76 | 1.81% | 2.93% | 4.75% |
6/30/2018 | $23,036 | $327.53 | $288.55 | $111.60 | $190.62 | 1.89% | 2.80% | 4.69% |
3/29/2018 | $22,496 | $311.26 | $281.28 | $109.18 | $189.05 | 1.90% | 2.56% | 4.46% |
12/29/2017 | $22,821 | $288.93 | $230.12 | $109.46 | $136.97 | 1.84% | 2.28% | 4.12% |
9/29/2017 | $21,579 | $268.35 | $243.68 | $105.45 | $129.17 | 1.92% | 2.40% | 4.32% |
6/30/2017 | $20,762 | $261.39 | $231.40 | $104.01 | $120.11 | 1.96% | 2.41% | 4.37% |
3/31/2017 | $20,276 | $247.32 | $235.65 | $100.86 | $133.15 | 1.98% | 2.51% | 4.49% |
12/31/2016 | $19,268 | $240.11 | $207.93 | $103.82 | $135.29 | 2.06% | 2.78% | 4.85% |
9/30/2016 | $18,742 | $247.98 | $219.46 | $98.43 | $112.20 | 2.10% | 2.92% | 5.01% |
6/30/2016 | $18,193 | $222.77 | $201.79 | $98.30 | $127.50 | 2.14% | 3.22% | 5.36% |
3/31/2016 | $17,958 | $208.99 | $189.37 | $96.67 | $161.39 | 2.15% | 3.28% | 5.43% |
S&P Dow Jones Indices | |||||||||
S&P 500 SECTOR BUYBACKS | |||||||||
SECTOR $ MILLIONS | Q4,'19 | Q3,'19 | Q4,'18 | 12MoDec,'19 | 12MoDec,'18 | 5-YEARS | 10-YEARS | Q4,'18 | Q2,'09 |
(high) | (recent low) | ||||||||
Consumer Discretionary | $16,620 | $18,372 | $25,652 | $68,476 | $86,674 | $420,287 | $754,092 | $25,652 | $2,350 |
Consumer Staples | $9,429 | $7,509 | $9,588 | $33,838 | $33,449 | $206,448 | $440,320 | $9,588 | $4,013 |
Energy | $5,025 | $4,880 | $8,698 | $18,750 | $30,427 | $82,926 | $266,702 | $8,698 | $5,343 |
Financials | $50,232 | $47,789 | $45,641 | $178,685 | $150,054 | $652,120 | $906,749 | $45,641 | $1,170 |
Healthcare | $20,041 | $16,007 | $31,336 | $83,864 | $108,692 | $415,445 | $711,672 | $31,336 | $4,699 |
Industrials | $10,218 | $14,181 | $23,026 | $60,792 | $78,239 | $348,870 | $563,488 | $23,026 | $1,681 |
Information Technology | $52,432 | $49,241 | $61,298 | $224,847 | $278,526 | $892,006 | $1,410,197 | $61,298 | $4,757 |
Materials | $3,117 | $5,400 | $5,857 | $15,709 | $14,391 | $59,874 | $116,194 | $5,857 | $159 |
Real Estate | $573 | $694 | $1,480 | $2,230 | $3,768 | $10,601 | $10,601 | $1,480 | |
Communication Services | $13,687 | $11,028 | $9,556 | $38,192 | $20,237 | $65,665 | $96,656 | $9,556 | $13 |
Utilities | $211 | $784 | $850 | $3,355 | $1,952 | $8,843 | $18,082 | $850 | $10 |
TOTAL | $181,583 | $175,886 | $222,980 | $728,738 | $806,408 | $3,163,084 | $5,294,754 | $222,980 | $24,195 |
SECTOR BUYBACK MAKEUP % | Q4,'19 | Q3,'19 | Q4,'18 | 12MoDec,'19 | 12MoDec,'18 | 5-YEARS | 10-YEARS | Q4,'18 | Q2,'09 |
Consumer Discretionary | 9.15% | 10.45% | 11.50% | 9.40% | 10.75% | 13.29% | 14.24% | 11.50% | 9.71% |
Consumer Staples | 5.19% | 4.27% | 4.30% | 4.64% | 4.15% | 6.53% | 8.32% | 4.30% | 16.59% |
Energy | 2.77% | 2.77% | 3.90% | 2.57% | 3.77% | 2.62% | 5.04% | 3.90% | 22.08% |
Financials | 27.66% | 27.17% | 20.47% | 24.52% | 18.61% | 20.62% | 17.13% | 20.47% | 4.84% |
Healthcare | 11.04% | 9.10% | 14.05% | 11.51% | 13.48% | 13.13% | 13.44% | 14.05% | 19.42% |
Industrials | 5.63% | 8.06% | 10.33% | 8.34% | 9.70% | 11.03% | 10.64% | 10.33% | 6.95% |
Information Technology | 28.88% | 28.00% | 27.49% | 30.85% | 34.54% | 28.20% | 26.63% | 27.49% | 19.66% |
Materials | 1.72% | 3.07% | 2.63% | 2.16% | 1.78% | 1.89% | 2.19% | 2.63% | 0.66% |
Real Estate | 0.32% | 0.39% | 0.66% | 0.31% | 0.47% | 0.34% | 0.20% | 0.66% | 0.00% |
Telecommunication Services | 7.54% | 6.27% | 4.29% | 5.24% | 2.51% | 2.08% | 1.83% | 4.29% | 0.05% |
Utilities | 0.12% | 0.45% | 0.38% | 0.46% | 0.24% | 0.28% | 0.34% | 0.38% | 0.04% |
TOTAL | 100.00% | 100.00% | 100.00% | 100.00% | 100.00% | 100.00% | 100.00% | 100.00% | 100.00% |
S&P Dow Jones Indices | ||||||||
S&P 500 20 LARGEST Q4 2019 BUYBACKS, $ MILLIONS | ||||||||
Company | Ticker | Sector | Q4 2019 | 12-Months | 12-Months | 5-Year | 10-Year | Indicated |
Buybacks | Dec,'19 | Dec,'18 | Buybacks | Buybacks | Dividend | |||
$ Million | $ Million | $ Million | $ Million | $ Million | $ Million | |||
Apple | AAPL | Information Technology | $22,085 | $81,685 | $74,246 | $264,340 | $342,031 | $14,559 |
Bank of America | BAC | Financials | $7,748 | $28,144 | $20,094 | $68,538 | $73,433 | $7,196 |
Wells Fargo | WFC | Financials | $7,386 | $24,835 | $20,964 | $73,407 | $94,602 | $9,481 |
Bristol-Myers Squibb | BMY | Health Care | $7,000 | $7,300 | $320 | $10,320 | $14,958 | $4,220 |
JPMorgan | JPM | Financials | $6,751 | $24,001 | $19,983 | $74,092 | $97,156 | $11,291 |
Alphabet | GOOGL | Communication Services | $6,098 | $18,396 | $9,075 | $37,790 | $38,708 | $0 |
Microsoft | MSFT | Information Technology | $5,206 | $19,504 | $16,300 | $77,549 | $117,704 | $15,563 |
Citigroup | C | Financials | $5,127 | $17,982 | $10,327 | $58,741 | $63,012 | $4,454 |
Oracle | ORCL | Information Technology | $5,036 | $26,857 | $29,306 | $77,431 | $109,871 | $4,775 |
Intel | INTC | Information Technology | $3,523 | $13,623 | $10,730 | $34,418 | $69,168 | $5,742 |
Procter & Gamble | PG | Consumer Staples | $3,504 | $9,504 | $4,754 | $25,719 | $56,097 | $7,432 |
Home Depot | HD | Consumer Discretionary | $3,056 | $6,965 | $9,963 | $38,808 | $64,416 | $6,545 |
Visa | V | Information Technology | $2,517 | $8,741 | $7,914 | $34,852 | $48,690 | $2,054 |
Charter Communications | CHTR | Communication Services | $2,305 | $6,873 | $4,399 | $24,587 | $25,371 | $0 |
U.S. Bancorp | USB | Financials | $2,293 | $4,525 | $2,822 | $14,724 | $21,576 | $2,883 |
Goldman Sachs Group | GS | Financials | $2,166 | $6,080 | $4,412 | $30,828 | $57,343 | $1,967 |
Biogen | BIIB | Health Care | $2,093 | $5,868 | $4,353 | $17,586 | $22,434 | $0 |
Berkshire Hathaway | BRK.B | Financials | $2,043 | $4,850 | $1,346 | $6,196 | $6,263 | $0 |
AT&T | T | Communication Services | $2,008 | $2,417 | $609 | $4,270 | $31,667 | $15,194 |
FB | Communication Services | $1,923 | $6,539 | $16,087 | $27,854 | $31,679 | $0 | |
Top 20 | $99,868 | $324,689 | $268,004 | $1,002,050 | $1,386,179 | $113,356 | ||
S&P 500 | $181,583 | $728,738 | $806,408 | $3,163,084 | $5,294,754 | $553,760 | ||
Top 20 % of S&P 500 | 55.00% | 44.55% | 33.23% | 31.68% | 26.18% | 20.47% | ||
Gross values are not adjusted for float | ||||||||
S&P Dow Jones Indices | ||||
S&P 500 20 Largest Quarterly Buybacks, $ Millions, as of Q4 2019; Apple added at #3 | ||||
$ MILLIONS | QUARTER | COMPANY | SECTOR | |
$23,811 | Q1 2019 | Apple | Information Technology | 1 |
$22,908 | Q1 2018 | Apple | Information Technology | 2 |
$22,085 | Q4 2019 | Apple | Information Technology | 3 |
$21,860 | Q2 2018 | Apple | Information Technology | 4 |
$21,162 | Q2 2006 | QUALCOMM | Information Technology | 5 |
$19,364 | Q3 2018 | Apple | Information Technology | 6 |
$18,154 | Q2 2019 | Apple | Information Technology | 7 |
$18,036 | Q1 2014 | Apple | Information Technology | 8 |
$17,635 | Q3 2019 | Apple | Information Technology | 9 |
$17,319 | Q3 2014 | Apple | Information Technology | 10 |
$16,413 | Q2 2013 | Apple | Information Technology | 11 |
$15,707 | Q3 2007 | International Business Machines | Information Technology | 12 |
$13,420 | Q3 2015 | Apple | Information Technology | 13 |
$12,852 | Q4 2013 | Johnson & Johnson | Healthcare | 14 |
$12,318 | Q4 2016 | Allergan plc (AGN) | Healthcare | 15 |
$12,183 | Q2 2012 | Johnson & Johnson | Healthcare | 16 |
$11,480 | Q4 2016 | Apple | Information Technology | 17 |
$11,133 | Q4 2017 | Apple | Information Technology | 18 |
$10,776 | Q2 2016 | Apple | Information Technology | 19 |
$10,724 | Q2 2015 | Apple | Information Technology | 20 |
S&P Dow Jones Indices | ||||
S&P 500 Q4 2019 Buyback Report | ||||
SECTOR | DIVIDEND | BUYBACK | COMBINED | |
YIELD | YIELD | YIELD | ||
Consumer Discretionary | 2.01% | 3.21% | 5.22% | |
Consumer Staples | 4.03% | 1.95% | 5.98% | |
Energy | 7.36% | 3.07% | 10.43% | |
Financials | 3.22% | 6.90% | 10.11% | |
HealthCare | 2.02% | 2.50% | 4.52% | |
Industrials | 2.68% | 3.26% | 5.95% | |
Information Technology | 1.53% | 3.95% | 5.49% | |
Materials | 3.02% | 2.97% | 5.99% | |
Real Estate | 3.60% | 0.31% | 3.91% | |
Communications Services | 1.77% | 1.88% | 3.65% | |
Utilities | 3.63% | 0.43% | 4.05% | |
S&P 500 | 2.51% | 3.30% | 5.81% | |
Uses full values (unadjusted for float) | ||||
Dividends based on indicated; buybacks based on the last 12-months ending Q4,'19 | ||||
Share Count Changes | ||
(Y/Y diluted shares used for EPS) | >=4% | <=-4% |
Q4 2019 | 7.68% | 20.81% |
Q3 2019 | 8.62% | 22.85% |
Q2 2019 | 7.98% | 24.15% |
Q1 2019 | 8.03% | 24.90% |
Q4 2018 | 8.45% | 18.71% |
Q3 2018 | 6.43% | 17.67% |
Q2 2018 | 6.20% | 15.60% |
Q1 2018 | 7.01% | 13.63% |
Q4 2017 | 6.83% | 15.06% |
Q3 2017 | 8.62% | 14.23% |
Q2 2017 | 10.00% | 14.00% |
Q1 2017 | 12.00% | 14.80% |
Q4 2016 | 10.48% | 19.35% |
ABOUT S&P DOW JONES INDICES
S&P Dow Jones Indices is the largest global resource for essential index-based concepts, data and research, and home to iconic financial market indicators, such as the S&P 500® and the Dow Jones Industrial Average®. More assets are invested in products based on our indices than products based on indices from any other provider in the world. Since Charles Dow invented the first index in 1884, S&P DJI has been innovating and developing indices across the spectrum of asset classes helping to define the way investors measure and trade the markets.
S&P Dow Jones Indices is a division of S&P Global (NYSE: SPGI), which provides essential intelligence for individuals, companies, and governments to make decisions with confidence. For more information, visit: www.spdji.com.
![]() View original content to download multimedia:http://www.prnewswire.com/news-releases/sp-500-buybacks-up-3-2-in-q4-2019-full-year-2019-down-9-6-from-record-2018--as-companies-brace-for-a-more-volatile-2020--301028874.html
View original content to download multimedia:http://www.prnewswire.com/news-releases/sp-500-buybacks-up-3-2-in-q4-2019-full-year-2019-down-9-6-from-record-2018--as-companies-brace-for-a-more-volatile-2020--301028874.html
SOURCE S&P Dow Jones Indices

Copyright 2020 PR Newswire
1 Year Bank of America Chart |
1 Month Bank of America Chart |

It looks like you are not logged in. Click the button below to log in and keep track of your recent history.
Support: +44 (0) 203 8794 460 | support@advfn.com
By accessing the services available at ADVFN you are agreeing to be bound by ADVFN's Terms & Conditions
 Hot Features