
We could not find any results for:
Make sure your spelling is correct or try broadening your search.
| Share Name | Share Symbol | Market | Type |
|---|---|---|---|
| Aegon Ltd | NYSE:AEG | NYSE | Common Stock |
| Price Change | % Change | Share Price | High Price | Low Price | Open Price | Shares Traded | Last Trade | |
|---|---|---|---|---|---|---|---|---|
| -0.10 | -1.60% | 6.15 | 6.22 | 6.13 | 6.22 | 955,193 | 18:31:49 |
UNITED STATES
SECURITIES AND EXCHANGE COMMISSION
WASHINGTON, D.C. 20549
Form 6-K
Report of Foreign Private Issuer
Pursuant to Rule 13a-16 or 15d-16 under
the Securities Exchange Act of 1934
For the six months ended June 30, 2023
Commission File Number 001-10882
Aegon N.V.
(Translation of registrant’s name into English)
Aegonplein 50
P.O. Box 85
2501 CB The Hague
The Netherlands
(Address of principal executive office)
Indicate by check mark whether the registrant files or will file annual reports under cover of
Form 20-F or Form 40-F.
☒ Form 20-F ☐ Form 40-F
This Form 6-K and the information contained herein (but excluding any guidance, targets or other forecasts including therein) is hereby incorporated by reference in the Company’s Registration Statement under the Securities Act of 1933, as amended, on Form F-4 (Registration No. 333- 273041).
The condensed consolidated interim financial information for the three-month and six-month periods ended, June 30, 2023, and included herein have been prepared under International Financial Reporting Standards (“IFRS”) as adopted by the European Union (hereafter ‘EU-IFRS’) and have not been prepared in accordance with IFRS as issued by the International Accounting Standards Board (“IFRS-IASB”). EU-IFRS differs from IFRS-IASB in respect of certain paragraphs in IAS 39 “Financial Instruments: Recognition and Measurement” regarding hedge accounting for portfolio hedges of interest rate risk. Under EU-IFRS, Aegon applies fair value hedge accounting for portfolio hedges of interest rate risk (fair value macro hedges) in accordance with the EU “carve out” version of IAS 39.
SIGNATURE
Pursuant to the requirements of the Securities Exchange Act of 1934, the registrant has duly caused this report to be signed on its behalf by the undersigned, thereunto duly authorized.
| AEGON N.V. | ||||||
| (Registrant) | ||||||
| Date: August 17, 2023 | By | /s/ J.H.P.M. van Rossum | ||||
| J.H.P.M. van Rossum | ||||||
| Executive Vice President and Head of Corporate Financial Center | ||||||
Condensed consolidated interim financial information
for the period ended June 30, 2023
August 17, 2023

Condensed consolidated interim financial information for the period ended June 30, 2023
| 3 | ||||
| 3 | ||||
| 4 | ||||
| 14 | ||||
| 17 | ||||
| 21 | ||||
| 23 | ||||
| 23 | ||||
| 24 | ||||
| 25 | ||||
| 26 | ||||
| 28 | ||||
| Notes to the condensed consolidated interim financial statements |
29 | |||
| 104 | ||||

|
Unaudited | Page 2 of 131 |
Condensed consolidated interim financial information for the period ended June 30, 2023
Aegon’s ambition is to build leading businesses that offer customers investment, protection and retirement solutions. Its portfolio of businesses includes fully owned subsidiaries in the US, UK and a global asset manager. In addition, Aegon has partnerships in Spain & Portugal, Brazil, and China, which create value by combining the strength of local partners with Aegon’s international expertise. In the Netherlands, Aegon generates value via a strategic shareholding in a market leading insurance and pensions company. The company is taking significant steps to improve its performance and create value for all of its stakeholders.
Aegon’s businesses in the US have been divided into Financial Assets and Strategic Assets. The aim is to reduce Aegon’s exposure to Financial Assets and improve the predictability of capital generation from these assets. Capital is to be reallocated to growth opportunities in Strategic Assets, growth markets and the global asset manager. Exposure to businesses outside of Aegon’s core focus has been largely eliminated over recent years with the announced divestment of the associate business in India in July 2023 being the most recent milestone.
Throughout its transformation, Aegon aims to maintain a solid capital position in its business units and at the Holding. Through proactive risk management actions, Aegon is improving its risk profile and reducing the volatility of its capital ratios. This is underscored by the capital strength conveyed in this report.
Transaction with a.s.r.
On July 4, 2023, Aegon announced the completion of the combination of its Dutch pension, life and non-life insurance, banking, and mortgage origination activities with a.s.r., and the beginning of its asset management partnership with a.s.r. As part of the transaction, Aegon received EUR 2.2 billion in cash proceeds and a 29.99% stake in a.s.r. The associated EUR 1.5 billion share buyback program has commenced and is expected to be completed on or before June 30, 2024. In light of the transaction, Aegon the Netherlands is no longer reported as a separate segment, and its first half 2023 result is included in Other income in the income statement.
2023 Capital Markets Day
On June 22, 2023, Aegon hosted a Capital Markets Day (CMD) to provide an update on its strategy and medium-term financial targets. This included plans to profitably grow its businesses and maximize the value from its Financial Assets, with a focus on Aegon’s largest business unit, Transamerica. Four key priorities to create value for shareholders were identified:
| 1. | Change the group profile: Following the completion of the transaction with a.s.r., Aegon intends to transfer its legal seat to Bermuda and the Bermuda Monetary Authority (BMA) will then assume the role of group supervisor. Aegon continues to sharpen its operating model to accelerate the strategy to create leading businesses. |
| 2. | Increase Transamerica’s value: Aegon’s ambition is to build America’s leading middle market life insurance and retirement company. Over the next three years, Transamerica is expected to improve the quantum and quality of its capital generation, while reducing its exposure to Financial Assets. |
| 3. | Drive improvement and value creation in the rest of the portfolio: Aegon continues to strengthen its UK and asset management businesses to facilitate them in building leading positions in their markets. Aegon is also investing to grow its highly successful joint ventures in Aegon International and Asset Management. |
| 4. | Manage capital actively: Aegon will continue to be a rational and disciplined allocator of capital, looking to utilize its significant financial flexibility at the Holding to create value for our shareholders. |
This next chapter in Aegon’s strategy is expected to lead to an increase of operating capital generation from its units to around EUR 1.2 billion, and of free cash flow to around EUR 800 million on an annual basis by 2025. The dividend per share is targeted to increase to EUR 0.40 over 2025, barring unforeseen circumstances and subject to the necessary approvals. Gross financial leverage is expected to reduce to EUR 5.0 billion.
|
|
Unaudited | Page 3 of 131 |
Condensed consolidated interim financial information for the period ended June 30, 2023
Business update Americas
| Aegon Americas | ||||||||||||||||
| Business update | ||||||||||||||||
| USD millions | Notes in Appendix B |
1H 2023 | 1H 2022 | % | ||||||||||||
| Strategic Assets KPIs |
||||||||||||||||
| World Financial Group (WFG) |
||||||||||||||||
| Number of licensed agents (end of period) |
69,846 | 58,263 | 20 | |||||||||||||
| Number of multi-ticket agents (end of period) |
34,265 | 30,589 | 12 | |||||||||||||
| Transamerica’s market share in WFG (US Life) |
64% | 60% | 7 | |||||||||||||
| Individual Life |
||||||||||||||||
| Earnings on in-force (Individual Life excl. WFG and Universal Life) |
324 | 240 | 35 | |||||||||||||
| New business strain |
164 | 147 | 12 | |||||||||||||
| Retirement Plans |
||||||||||||||||
| Earnings on in-force (Retirement Plans excl. SPGA annuities) |
45 | 37 | 22 | |||||||||||||
| Written sales mid-sized plans |
3,604 | 2,128 | 69 | |||||||||||||
| Net deposits/(outflows) mid-sized plans |
995 | 756 | 32 | |||||||||||||
| Individual Retirement Accounts AuA |
9,539 | 8,104 | 18 | |||||||||||||
| General Account Stable Value AuA |
10,732 | 10,102 | 6 | |||||||||||||
|
|
||||||||||||||||
| Financial Assets KPIs |
||||||||||||||||
| Operating Capital Generation1 |
159 | 84 | 90 | |||||||||||||
| Capital employed in Financial Assets (at 400% RBC ratio) |
4,082 | 4,389 | (7 | ) | ||||||||||||
| Variable Annuities dynamic hedge effectiveness ratio (%)2 |
98% | 98% | - | |||||||||||||
| NPV of LTC rate increases approved since end-2022 |
86 | n/a | n/a | |||||||||||||
|
|
||||||||||||||||
| New business KPIs |
||||||||||||||||
| Individual Solutions |
233 | 200 | 17 | |||||||||||||
| Workplace Solutions |
43 | 43 | 1 | |||||||||||||
| New life sales (recurring plus 1/10 single) |
2, 7 | 276 | 243 | 14 | ||||||||||||
| New premium production accident & health insurance |
61 | 84 | (27 | ) | ||||||||||||
| Individual Solutions |
(2,841 | ) | (4,682 | ) | 39 | |||||||||||
| Workplace Solutions |
(1,158 | ) | (27 | ) | n.m. | |||||||||||
| Net deposits/(outflows) |
7 | (3,999 | ) | (4,709 | ) | 15 | ||||||||||
1. Includes the capital generation of Universal Life for all periods. The classification of Universal Life has been changed to Financial Assets at the 2023 Capital Markets Day.
2. Dynamic Hedge effectiveness ratio (%) represents the hedge effectiveness on targeted risk, in particular impact from linear equity and interest rate movements.
Transamerica – Aegon’s business in the United States – has a long and proud history of making financial services available to the many, not just the few. The company aims to accelerate growth and build America’s leading middle market life insurance and retirement company.
|
|
Unaudited | Page 4 of 131 |
Condensed consolidated interim financial information for the period ended June 30, 2023
Business update Individual Solutions
In the US Individual Solutions business, Transamerica’s strategy has two focus areas. Transamerica will invest further in World Financial Group (WFG1), its life insurance distribution network. Its ambition is to increase the number of WFG agents to 110,000 by 2027, while at the same time improving agent productivity. Additionally, Transamerica will invest in its product manufacturing capabilities and operating model to position its individual life insurance business for further growth, with distribution through both WFG and third-parties.
World Financial Group
WFG expanded the size of the salesforce to 69,846 licensed agents by the end of the first half year of 2023, which is an increase of 20% compared with a year earlier. Driven by actions to improve agent productivity, the number of multiticket agents – agents selling more than one life policy per 12 months – has increased by 12% compared with a year earlier to 34,265 agents.
New life sales
By 2027, Transamerica targets around USD 750 million of annual new life sales. In the first half of 2023, the Individual Solutions business generated new life sales of USD 233 million, which is an increase of 17% compared with the first half of last year. This was driven by the record-high number of WFG agents. The improved service experience for WFG agents, combined with the continued competitiveness of Transamerica’s products, led to a market share in the WFG distribution channel in the US of 64% in the first half of 2023, compared with 60% in the same period of 2022.
The increase in new life sales was driven by the indexed universal life product line, which is the main product that is marketed through WFG. Pricing adjustments and increased sales in the brokerage channel supported the sales growth of term life, offsetting lower whole life final expense sales.
Individual Life – operating capital generation contributions
Transamerica aims to increase the earnings on in-force from Individual Life excluding the contributions from WFG and the legacy Universal Life portfolio to between USD 700 and USD 725 million for the full-year 2027. In the first half of 2023, earnings on in-force were USD 324 million, an increase of 35% compared with the first half of 2022, reflecting significant growth in this Strategic Asset.
Capital requirements and acquisition costs related to increased new life sales drove an increase in new business strain, which represents a drag on current period operating capital generation, but results in future earnings on in-force. New business strain for individual life increased from USD 147 million in the first half of 2022 to USD 164 million in the current reporting period.
Net deposits
Net outflows for Mutual Funds improved from USD 1.7 billion in the first half of 2022 to USD 246 million in the current reporting period. While gross deposits in Mutual Funds were 30% down compared with the first half of 2022 due to a general lack of market confidence, redemptions in the first half of this year were lower compared with a year earlier and therefore led to an improvement in net deposits.
Net outflows in Variable Annuities amounted to USD 2.2 billion in the first half-year compared with USD 2.7 billion in the first half of 2022, in line with expectations. This is mainly a consequence of lower account values compared with the prior year period as a result of market movements, and outflows related to the lump-sum buyout program in the first month of last year.
Net outflows in the run-off Fixed Annuities book amounted to USD 424 million in the first half of 2023 compared with USD 317 million of net outflows in the same period of last year. These were driven by higher surrender rates for traditional fixed annuity products.
| 1 | For information about WFG refer to Appendix B |
|
|
Unaudited | Page 5 of 131 |
Condensed consolidated interim financial information for the period ended June 30, 2023
Business update Workplace Solutions
In the US Workplace Solutions business, Transamerica aims to increase earnings on in-force from its retirement business to between USD 275 and USD 300 million in 2027. The business provides recordkeeping and investment services for US defined contribution and defined benefit plans, and advice to plan participants. With a focus on the mid-sized and pooled employer retirement plan market, Transamerica invests to leverage its capabilities as a recordkeeper with the ambition to materially increase penetration of the ancillary products and services it offers.
Retirement Plans – earnings on in-force
In the first half of 2023, the Retirement Plan business – excluding the single premium guaranteed annuities (SPGA) business – contributed USD 45 million of earnings on in-force. This was an increase of USD 8 million compared with the prior year period, mainly from the general account stable value product.
Written sales of mid-sized plans
Written sales of mid-sized plans were USD 3.6 billion in the first half of 2023, an increase of USD 1.5 billion compared with the first half of 2022. The main driver of the increase was a USD 1.7 billion pooled plan sale - that included 1,400 individual employer plans - in the first quarter of 2023.
Net deposits
Retirement Plans saw net outflows of USD 1.0 billion in the first half-year of 2023, while the same period last year saw net deposits of USD 70 million. Net deposits for mid-sized plans amounted to USD 995 million compared with USD 756 million of net deposits in the first half year of 2022, which reflects the strong written sales in prior periods, as well as lower withdrawals. In the first half of 2023, the Large-Market segment of Retirement Plans saw net outflows of USD 2.7 billion compared with net outflows of USD 1.2 billion in the prior year period. A portion of the Large-Market withdrawals were retained in individual retirement accounts (IRAs), which generated USD 694 million of net deposits supported by asset consolidation and customer retention efforts.
Account balances
Transamerica strives to grow and diversify revenue streams by expanding both the general account stable value product and IRAs. Assets under management in the general account stable value product have increased from USD 10.1 billion at the end of the first half of 2022 to USD 10.7 billion on June 30, 2023. The general account stable value product provides principal protection for customers and is attractive in the current rising interest rate environment. IRA account balances have increased to USD 9.5 billion at the end of the first half of 2023, driven by both net deposits and favorable markets over the past year. This compares with USD 8.1 billion of IRA assets at the end of the first half-year of 2022.
New life sales
New life sales in Workplace Solutions were USD 43 million and were stable compared with the prior year period.
New premium production accident & health
For accident & health insurance, new premium production was USD 61 million, a decrease of USD 23 million compared with the prior year’s first half. This was mainly driven by lower sales to existing employee groups.
|
|
Unaudited | Page 6 of 131 |
Condensed consolidated interim financial information for the period ended June 30, 2023
Business update Financial Assets – in-force management
Financial Assets are blocks of business that are capital intensive with relatively low returns on capital employed. New sales for these blocks are limited and focused on products with higher returns and moderate risk profiles. Transamerica is actively managing variable annuities with interest rate sensitive riders, fixed annuities, and long-term care as Financial Assets. Since the 2023 CMD, the legacy Universal Life portfolio and Single Premium Group Annuities (SPGA) have been added as a Financial Asset. Transamerica will take in-force management actions on Financial Assets which are expected to release USD 1.2 billion of capital before year-end 2027.
Universal Life
The legacy Universal Life portfolio includes a portfolio of Secondary Guarantee Universal Life (SGUL) policies. In July 2023, Transamerica agreed to reinsure USD 1.4 billion of statutory reserves of the SGUL portfolio to Wilton Re. The transaction will reduce exposure to mortality risk, and covers around 14,000 policies and 12% of the total reserves backing this product line. In total, the transaction generates around USD 225 million of capital, of which USD 50 million is from reduced required capital. Transamerica plans to use this capital to support its ongoing management action of buying back universal life policies from institutional owners. Together with the prior reinsurance transaction undertaken at the end of 2021, a total of 30% of the net amount at risk and 25% of the statutory reserves backing the SGUL portfolio have now been reinsured.
Variable Annuities
The variable annuity portfolio is a legacy block that will run off over time, and that has been de-risked by dynamically hedging all guaranteed benefits embedded in the contracts. In the first half of 2023, Transamerica achieved a hedge effectiveness of 98% for the hedge program, continuing its strong track record of hedging these guarantees against financial market risks.
Long-term care
Transamerica is actively managing its long-term care business, primarily through premium rate increase programs. The company continues to work with state regulators to get pending and future actuarially justified rate increases approved, and announced at the 2023 CMD a target to achieve an additional net present value of USD 700 million of premium rate increases. The total value of state approvals for premium rate increases achieved since the beginning of 2023 amounts to USD 86 million, which is 12% of the new target.
Operating capital generation from Financial Assets
Financial Assets had USD 4.1 billion of capital employed at June 30, 2023, and reported USD 159 million of operating capital generation in the first half of 2023. Compared with the first half of 2022, operating capital generation increased by USD 75 million, driven by improved mortality claims experience and management actions, partly offset by continued outflows and normalizing morbidity claims experience.
|
|
Unaudited | Page 7 of 131 |
Condensed consolidated interim financial information for the period ended June 30, 2023
Business update United Kingdom
| United Kingdom
Business update |
||||||||||||||||
| GBP millions | Notes in Appendix B |
1H 2023 | 1H 2022 | % | ||||||||||||
| Retail platform |
(1,137) | (66) | n.m. | |||||||||||||
| Workplace Solutions platform |
1,505 | 1,107 | 36 | |||||||||||||
| Total platform business |
368 | 1,041 | (65) | |||||||||||||
| Traditional products |
(524) | (500) | (5) | |||||||||||||
| Total platform and traditional business |
(155) | 541 | n.m. | |||||||||||||
|
Institutional |
3,025 | (1,548) | n.m. | |||||||||||||
| Total net deposits/(outflows) |
7 | 2,870 | (1,007) | n.m. | ||||||||||||
| New life sales (recurring plus 1/10 single) |
2,5,7 | 9 | 12 | (23) | ||||||||||||
| Strategic KPIs |
||||||||||||||||
| Annualized revenues gained/(lost) on net deposits |
(6.0) | (4.0) | -50 | |||||||||||||
| Platform expenses / AuA (bps) |
24 bps | 20 bps | ||||||||||||||
In the United Kingdom, Aegon’s strategy is to be the leading digital platform provider in the workplace and retail markets, and to drive forward it’s pension and investment propositions for the benefit of all of its customers, advisers and employers.
Strategic developments
In April 2023, Aegon announced the sale of its UK individual protection book to Royal London. Aegon UK has reinsured the portfolio to Royal London, and will ultimately transfer legal ownership to Royal London through a Part VII transfer in 2024, subject to court approval. The individual protection book has been closed for new business.
On August 10, 2023, Aegon announced an extension of its strategic partnership with Nationwide Building
Society (NBS), under which NBS’ financial planning teams will move to Aegon UK. Those teams service around 90,000 existing Aegon clients. In addition, under the extended partnership with NBS, Aegon UK will continue to provide the platform on which NBS members manage their investments. The transaction supports Aegon’s strategy to focus on the core Retail and Workplace platform activities in the UK, as part of Aegon’s ambition to create leading businesses in its chosen markets.
Business update
Net deposits
Net deposits in the Workplace segment of the platform amounted to GBP 1.5 billion in the first half of 2023 compared with net deposits of GBP 1.1 billion in the same period of 2022. The increase was driven by the onboarding of new schemes and higher net deposits on existing schemes. For Retail, net outflows amounted to GBP 1.1 billion in the first half of 2023 compared with net outflows of GBP 66 million in the prior year period. This reflects reduced customer activity because of the current macroeconomic environment, as well as an industry-wide reduction of transfers from defined benefit to defined contribution pensions.
Net outflows in Traditional products amounted to GBP 524 million, as this book gradually runs off. For the Institutional business, net deposits amounted to GBP 3.0 billion in the first half of 2023, driven by the onboarding of a large client, whereas net outflows amounted to GBP 1.5 billion in the same period of 2022. The Institutional business is low-margin and net deposits for this business can be lumpy.
|
|
Unaudited | Page 8 of 131 |
Condensed consolidated interim financial information for the period ended June 30, 2023
Annualized revenues gained / (lost) on net deposits
Annualized revenues lost on net deposits amounted to GBP 6 million for the first half-year of 2023, predominantly due to the gradual run-off of the traditional product portfolio, partially offset by revenues gained on net deposits in the Workplace channel.
Platform expenses as a percentage of assets under administration
Platform expenses as a percentage of assets under administration (AuA) amounted to 24 basis points in the first half of 2023, and rose compared with the same period of 2022. This was mostly driven by higher employee expenses which more than offset favorable market movements on assets under administration and net deposits on the platform.
|
|
Unaudited | Page 9 of 131 |
Condensed consolidated interim financial information for the period ended June 30, 2023
Business update Asset Management
| Asset Management
Business update |
||||||||||||||||
| EUR millions | Notes in Appendix B |
1H 2023 | 1H 2022 | % | ||||||||||||
| General Account |
(693) | (6,229) | 89 | |||||||||||||
| Affiliate |
(542) | (2,950) | 82 | |||||||||||||
| Third Party |
(574) | (399) | (44) | |||||||||||||
| Global Platforms |
(1,808) | (9,579) | 81 | |||||||||||||
| Strategic Partnerships |
(615) | 3,459 | n.m. | |||||||||||||
| Net deposits/(outflows) |
7 | (2,424) | (6,120) | 60 | ||||||||||||
| Strategic KPIs |
||||||||||||||||
| Annualized revenues gained/(lost) on net deposits - |
||||||||||||||||
| Global Platforms |
0.8 | (9.8) | n.m. | |||||||||||||
| General Account |
90,765 | 101,555 | (11) | |||||||||||||
| Affiliate |
63,698 | 62,139 | 3 | |||||||||||||
| Third Party |
83,834 | 89,012 | (6) | |||||||||||||
| Global Platforms |
238,297 | 252,706 | (6) | |||||||||||||
| Strategic Partnerships |
54,799 | 62,007 | (12) | |||||||||||||
| Assets under Management |
293,096 | 314,713 | (7) | |||||||||||||
Aegon Asset Management (Aegon AM) aims to improve efficiency and drive growth through third-party assets and by increasing the share of proprietary investment solutions in the affiliate business.
Strategic developments
Aegon AM has closed the previously announced acquisition of NIBC Bank’s European Collateralized Loan Obligation (CLO) management activities. In addition, the strategic partnership with Lakemore Partners to drive the growth of Aegon AM’s US CLO platform, which was announced in April has come into effect.
In July, 2023, Aegon AM and La Banque Postale announced an extension of their asset management joint venture in LBP AM through 2035, in which Aegon AM holds a 25% stake. Aegon AM participated in LBP AM’s capital raising to support the acquisition of La Financière de l’Echiquier, which will consolidate LBP AM’s market position. The extension of the joint venture, as well as participation in the capital raising, fits into Aegon’s strategy of investing in - and growing - its various successful joint ventures.
Business update
Net deposits
Third-party net outflows in Global Platforms amounted to EUR 0.6 billion in the first half of 2023 compared with net outflows of EUR 0.4 billion in the same period of 2022. Net deposits in the Dutch mortgage fund and other asset-backed fixed income products were more than offset by outflows in fiduciary management and other asset classes.
Third-party net outflows in Strategic Partnerships amounted to EUR 0.6 billion in the first half of 2023 compared with net deposits of EUR 3.5 billion in the same period of last year, and largely occurred in the Chinese asset management joint venture AegonIndustrial Fund Management Company (AIFMC). Investor sentiment in China remained weak, resulting in lower gross deposits and higher outflows compared with the first half of 2022.
|
|
Unaudited | Page 10 of 131 |
Condensed consolidated interim financial information for the period ended June 30, 2023
Net outflows from the general account were EUR 0.7 billion in the first half of 2023, compared with net outflows of EUR 6.2 billion in the prior year period. Net outflows in the first half of 2022 were largely attributable to rising interest rates, which led to redemptions.
Net outflows from affiliates amounted to EUR 0.5 billion in the first half of 2023 compared with elevated levels of net outflows in the same period of 2022, which then amounted to EUR 3.0 billion.
Annualized revenues gained / (lost) on net deposits
Annualized revenues gained on net deposits for Global Platforms amounted to EUR 1 million for the first half of 2023, driven by a more favorable asset mix.
Assets under management
Assets under management decreased by EUR 22 billion compared with June 30, 2022, to EUR 293 billion. This was mainly driven by unfavorable currency impacts, third-party net outflows and unfavorable market movements.
|
|
Unaudited | Page 11 of 131 |
Condensed consolidated interim financial information for the period ended June 30, 2023
Business update International
| International
Business update |
| |||||||||||||||
| EUR millions | Notes in Appendix B |
1H 2023 | 1H 2022 | % | ||||||||||||
| Spain & Portugal |
25 | 30 | (17) | |||||||||||||
| China |
82 | 45 | 80 | |||||||||||||
| Brazil |
59 | 44 | 35 | |||||||||||||
|
TLB and others |
9 | 4 | 164 | |||||||||||||
| New life sales (recurring plus 1/10 single) |
2,7 | 175 | 123 | 42 | ||||||||||||
| New premium production accident & health insurance |
29 | 16 | 85 | |||||||||||||
|
New premium production property & casualty insurance |
38 | 48 | (20) | |||||||||||||
In Spain & Portugal, China and Brazil, Aegon is investing in profitable growth. Transamerica Life Bermuda (TLB) is classified as a Financial Asset, for which Aegon is maximizing its value through active in-force management, disciplined risk management, and capital management actions while continuing to make profitable sales on a selective basis. Its closed block of universal life insurance liabilities is reinsured with Transamerica.
Strategic developments
In the first half of 2023, Aegon announced the completion of the divestment of its businesses in Poland and Romania to Vienna Insurance Group AG Wiener Versicherung Gruppe (VIG). This concluded the full sale of Aegon’s insurance, pension and asset management business in Central and Eastern Europe to VIG. Aegon also sold the Japanese and Hong Kong operations of Aegon Insights, its direct-marketing business that has been in run-off since 2017. Furthermore, Aegon announced the sale of its 56% stake in its Indian associate, Aegon Life Insurance Company (ALIC), to Bandhan Financial Holdings Limited, an Indian-financial services company. The completion of the proposed transaction is subject to customary regulatory approvals. These sales underscore Aegon’s commitment to exit non-core businesses.
In line with Aegon’s strategy to invest in growth assets where it can achieve the highest returns for its stakeholders, Aegon has increased its economic stake in its Brazil partnership by approximately 4%. Aegon now has a 59% economic ownership in the joint venture Mongeral Aegon Seguros e Previdência SA (MAG).
Business update
New life sales
New life sales increased by 42% compared with the first half of 2022 to EUR 175 million.
| ◾ | New life sales in Spain & Portugal decreased by 17% to EUR 25 million due to the divestment of Aegon’s stake in the joint venture with Liberbank, and reduced demand for mortgage-linked life sales in Santander Life given high interest rates. |
| ◾ | New life sales in China increased by 80% to EUR 82 million mainly driven by success in the bancassurance and brokerage channels following the relaxation of the country’s COVID-19 measures. |
| ◾ | In Brazil, new life sales increased by EUR 15 million to EUR 59 million mainly as a result of business growth and higher credit life sales. |
| ◾ | For TLB and others, new life sales improved to EUR 9 million driven by higher indexed universal life sales in Singapore and Bermuda. |
|
|
Unaudited | Page 12 of 131 |
Condensed consolidated interim financial information for the period ended June 30, 2023
New premium production for non-life business
New premium production for accident & health insurance amounted to EUR 29 million, an increase of 85% compared with the first half of 2022, driven by business growth in Spain & Portugal in all Spanish sales channels, in particular from health products.
New premium production for property & casualty insurance decreased by 20% to EUR 38 million driven by
Spain & Portugal from lower sales of funeral products while higher interest rates led to lower demand for mortgages resulting in fewer household policies being sold.
|
|
Unaudited | Page 13 of 131 |
Condensed consolidated interim financial information for the period ended June 30, 2023
| Aegon N.V. | ||||||||||||||||
| Main capital ratios | ||||||||||||||||
| in millions |
Notes in Appendix B |
2023 Jun. 30 |
2023 Mar. 31 |
% |
2022 Dec. 31 | |||||||||||
| United States (USD) |
||||||||||||||||
| Available capital |
8,280 | 8,183 | 1 | 7,984 | ||||||||||||
| Required capital |
1,939 | 1,875 | 3 | 1,877 | ||||||||||||
| US RBC ratio |
427% | 436% | 425% | |||||||||||||
| Scottish Equitable plc (UK) (GBP) |
||||||||||||||||
| Own funds |
1,920 | 2,037 | (6) | 1,993 | ||||||||||||
| SCR |
1,154 | 1,188 | (3) | 1,182 | ||||||||||||
| UK SE Solvency II ratio |
166% | 171% | 169% | |||||||||||||
| NL Life (EUR) |
||||||||||||||||
| Own funds |
4,548 | 4,576 | (1) | 4,627 | ||||||||||||
| SCR |
2,408 | 2,398 | - | 2,205 | ||||||||||||
| NL Life Solvency II ratio |
189% | 191% | 210% | |||||||||||||
| Aegon N.V. (EUR) |
||||||||||||||||
| Eligible own funds |
16,401 | 16,766 | (2) | 16,332 | ||||||||||||
| Consolidated Group SCR |
8,117 | 7,988 | 2 | 7,844 | ||||||||||||
| Group Solvency II ratio |
8,9 | 202% | 210% | 208% | ||||||||||||
| Aegon N.V. | ||||||||||||||
| Cash Capital at Holding | ||||||||||||||
| EUR millions | Notes in Appendix B |
1H 2023 | 1H 2022 | % | ||||||||||
| Beginning of period |
1,614 | 1,279 | 26 | |||||||||||
| Americas |
256 | 227 | 13 | |||||||||||
| United Kingdom |
64 | 58 | 11 | |||||||||||
| Asset Management |
15 | 85 | (82) | |||||||||||
| International |
80 | 47 | 71 | |||||||||||
| The Netherlands ¹ |
- | 110 | n.m. | |||||||||||
| Holding and other activities |
- | - | n.m. | |||||||||||
| Gross remittances |
416 | 527 | (21) | |||||||||||
| Funding and operating expenses |
(129) | (133) | 3 | |||||||||||
| Free cash flow |
287 | 394 | (27) | |||||||||||
| Divestitures and acquisitions |
(61) | 640 | n.m. | |||||||||||
| Capital injections |
(60) | (49) | (22) | |||||||||||
| Capital flows from / (to) shareholders |
(433) | (100) | n.m. | |||||||||||
| Net change in gross financial leverage |
- | (417) | n.m. | |||||||||||
| Other |
(31) | (66) | 53 | |||||||||||
| End of period |
1,315 | 1,680 | (22) | |||||||||||
1. From 2H 2022 onwards the gross remittances from Aegon the Netherlands to group are not recognized in Cash capital at Holding.
|
|
Unaudited | Page 14 of 131 |
Condensed consolidated interim financial information for the period ended June 30, 2023
Maintaining a strong balance sheet is a prerequisite for Aegon to achieve its financial and strategic objectives.
It allows the company to build leading, advantaged businesses in its chosen markets that create value for its customers, shareholders and other stakeholders. Aegon has a clear capital management framework in place that informs its capital deployment decisions. This framework is based on maintaining an adequate capitalization of its business units, Cash Capital at Holding, and gross financial leverage.
Capital ratios
US RBC ratio
The estimated RBC ratio in the US increased from 425% on December 31, 2022, to 427% on June 30, 2023, and remained well above the operating level of 400%. Market movements had a marginal positive impact on the RBC ratio with benefits from favorable equity markets being largely offset by fund basis risk. One-time items had a negative impact driven by the investments made in Strategic Assets and the annual assumption updates, in line with previous guidance. Operating capital generation contributed favorably to the US RBC ratio, and more than offset remittances to the Holding.
UK Solvency II ratio
The estimated Solvency II ratio for Scottish Equitable Plc decreased from 169% on December 31, 2022, to 166% on June 30, 2023, and remained above the operating level of 150%. The decrease in the ratio reflects a negative impact from market movements and a remittance to the UK intermediate holding to fund both remittances to the Group Holding and Aegon UK’s announced acquisition of NBS’ advisory business. These more than offset the positive contribution from operating capital generation and some smaller onetime items.
Group Solvency II ratio
Aegon’s Group Solvency II ratio decreased from 208% to 202% during the first half of 2023. Capital generation after holding expenses amounted to EUR 90 million but was more than offset by the deduction of the 2023 interim dividend and a reduction of eligible own funds due to tiering restrictions. Unfavorable market movements totaled EUR 178 million, and notably included the impact of lower real estate valuations in the Netherlands. One-time items amounted to a loss of EUR 224 million and were mainly driven by the investments made in Strategic Assets and the impact of the annual assumption updates, both in the US. As previously announced, the results of Aegon’s Dutch business are reported as one-time items, but are still included in the reported Group Solvency II ratio.
Cash Capital at Holding and free cash flow
Aegon’s Cash Capital at the Holding decreased during the first half of 2023 from EUR 1,614 million to EUR 1,315 million. This was largely due to previously announced capital returns to shareholders, which consisted of the payment of the 2022 final dividend of EUR 232 million and the EUR 200 million share buyback program that was finalized in the second quarter of 2023. The capital return to shareholders was partly offset by free cash flow of EUR 287 million. Divestitures and acquisitions amounted to an outflow of EUR 61 million, since the previously announced acquisition of the CLO business of NIBC by Aegon AM and the extension of Aegon AM’s joint venture partnership with La Banque Postale AM more than offset the proceeds from completion of the sale of Aegon’s business in Romania and Poland. Capital injections totaled EUR 60 million and notably included a previously announced injection into India. Other items totaled EUR 31 million of cash outflow and were driven by the previously announced EUR 43 million share buyback in the context of variable compensation plans.
|
|
Unaudited | Page 15 of 131 |
Condensed consolidated interim financial information for the period ended June 30, 2023
Interim dividend 2023
Aegon aims to pay out a sustainable dividend to allow equity investors to participate in the company’s performance, which can grow over time if Aegon’s performance so allows. Aegon targets a dividend per common share of around EUR 0.30 over 2023. At its 2023 Capital Markets Day, Aegon guided for dividend growth to around EUR 0.40 over 2025. Aegon announces today an interim dividend for 2023 of EUR 0.14 per common share, which represents an increase of EUR 0.03 compared with the interim dividend for 2022.
As previously announced, Aegon has moved to a cash-only dividend. Aegon’s shares will be quoted ex-dividend on August 29, 2023. The record date for the dividend will be August 30, 2023, and the dividend will be payable as of September 27, 2023.
Share buyback program
On July 6, 2023, Aegon announced the beginning of a EUR 1.5 billion share buyback program. This program followed the completion of the combination of its Dutch pension, life and non-life insurance, banking, and mortgage origination activities with a.s.r. The share buyback program is expected to be completed on or before June 30, 2024, barring unforeseen circumstances. Aegon intends to cancel these shares subject to the relevant board, shareholder and regulatory approvals.
|
|
Unaudited | Page 16 of 131 |
Condensed consolidated interim financial information for the period ended June 30, 2023
| Aegon N.V. |
||||||||||||||||
|
|
||||||||||||||||
|
Results overview |
||||||||||||||||
| EUR millions | Notes in Appendix B |
1H 2023 | 1H 2022 | % | ||||||||||||
| US Individual Solutions |
496 | 485 | 2 | |||||||||||||
| US Workplace Solutions |
132 | 121 | 9 | |||||||||||||
| Americas |
628 | 605 | 4 | |||||||||||||
| United Kingdom |
111 | 93 | 19 | |||||||||||||
| Global Platforms |
12 | 30 | (61) | |||||||||||||
| Strategic Partnerships |
62 | 87 | (29) | |||||||||||||
| Asset Management |
74 | 117 | (37) | |||||||||||||
| Spain & Portugal |
41 | 33 | 21 | |||||||||||||
| China (ATHTF) |
10 | 13 | (22) | |||||||||||||
| Brazil |
19 | 11 | 71 | |||||||||||||
| TLB |
27 | 39 | (31) | |||||||||||||
| Other |
(2) | (10) | 82 | |||||||||||||
| International |
95 | 87 | 9 | |||||||||||||
| Holding and other activities |
(91) | (107) | 15 | |||||||||||||
| Operating result |
1 | 818 | 796 | 3 | ||||||||||||
| Fair value items |
1 | 11 | 88 | (87) | ||||||||||||
| Realized gains/(losses) on investments |
1 | (95) | (135) | 30 | ||||||||||||
| Net impairments |
1 | (96) | (84) | (14) | ||||||||||||
|
Non-operating items |
1 | (180) | (132) | (36) | ||||||||||||
| Other income/(charges) |
1, 4 | (870) | (550) | (58) | ||||||||||||
| Result before tax |
1 | (232) | 114 | n.m. | ||||||||||||
| Income tax |
1 | 33 | (68) | n.m. | ||||||||||||
| Net result |
1 | (199) | 46 | n.m. | ||||||||||||
| Interest on financial leverage classified as equity after tax |
(24) | (16) | (52) | |||||||||||||
| Net result after interest on financial leverage classified as equity |
(223) | 30 | n.m. | |||||||||||||
| Average common shareholders’ equity |
8,456 | 11,204 | (25) | |||||||||||||
| Return on Equity1 |
3 | 15.6% | 11.5% | |||||||||||||
| Americas |
737 | 735 | - | |||||||||||||
| United Kingdom |
185 | 181 | 2 | |||||||||||||
| Asset Management |
65 | 65 | 1 | |||||||||||||
| International |
180 | 184 | (2) | |||||||||||||
| Holding and other activities |
53 | 54 | (1) | |||||||||||||
| Addressable expenses 2 |
1, 6 | 1,220 | 1,218 | - | ||||||||||||
| Operating expenses |
1,497 | 1,426 | 5 | |||||||||||||
1 Operating result after tax and after interest on financial leverage classified as equity / average common shareholders’ equity
2 Addressable expenses for all reporting periods are reported at constant currency at the current period YTD foreign exchange rate.
Net result
The result before tax amounted to a loss of EUR 232 million as the operating result is more than offset by
Other charges and nonoperating items. The tax benefit for the quarter amounts to EUR 33 million, mainly driven by the dividends received deduction and tax credits in the Americas. The net result was a loss of
EUR 199 million.
|
|
Unaudited | Page 17 of 131 |
Condensed consolidated interim financial information for the period ended June 30, 2023
Operating result
Aegon’s operating result increased by 3% compared with the first half of 2022 to EUR 818 million. Higher operating results in the Americas, the UK, and International were partially offset by a reduced operating result in Aegon AM, reflecting adverse market conditions and outflows.
Americas
The operating result from the Americas increased by 4% to EUR 628 million in the first half of 2023 from EUR 605 million in the same period in 2022. In local currency, the operating result from the Americas increased by 3% to USD 679 million in the first half-year 2023. The increase of the operating result was driven by an improvement in mortality claims experience. Unfavorable experience of USD 30 million in the first half-year 2023 compared with a COVID-19-driven unfavorable experience of USD 148 million in the first half of 2022. This improvement was largely offset by a decrease in the net investment result, partly from higher interest expense on short-term variable rate borrowings. The non-insurance operating result benefitted from growth in both Retirement Plans and WFG.
| ◾ | In Individual Solutions, the operating result increased by USD 6 million to USD 536 million in the first half of 2023 compared with the prior year period. Higher releases of Contractual Service Margin (CSM) and risk adjustment, an improvement in mortality claims experience in Individual Life, and growth in WFG and Mutual Funds earnings contributed to the increase. Partly offsetting these improvements was a decreasing net investment result and USD 20 million in unfavorable morbidity claims payments relative to expectations in Individual Health compared with experience in the prior year that was in line with expectations. |
| ◾ | In Workplace Solutions, the operating result increased by USD 10 million compared with the same period in 2022 to USD 142 million. The operating result of Retirement Plans increased from higher net investment result from growth in General Account Stable Value and from improved experience variance on annuitization payments in group annuities, partly offset by a decrease in record-keeping fee revenues. This was partly offset mainly by unfavorable morbidity experience of USD 10 million in supplemental health products which compared with marginally positive morbidity experience in the first half of 2022. |
United Kingdom
The operating result from the United Kingdom increased by 19% compared with the first half of 2022 to EUR 111 million. In local currency, the operating result increased by 24%, over the same period to GBP 97 million. This was mainly driven by a higher net investment result, which benefitted from favorable equity markets and higher interest rates, and partly offset by the impact of the planned transfer of the protection business to Royal London. The part of the platform business that is not accounted for as insurance business resulted in an operating loss that increased over the reporting period due to a reduction in fee income and outflows in the Retail channel. The benefit of higher net deposits in the Workplace channel was more than offset by higher expenses as we grow this business.
Asset Management
The operating result from Aegon AM amounted to EUR 74 million in the first half of 2023, a decrease of 37% compared with the same period of 2022. The decrease was driven by lower management fees in both Global Platforms and Strategic Partnerships, mainly as a consequence of lower asset balances due to adverse market conditions and outflows. This was partially offset by lower operating expenses.
International
The operating result from the International segment increased by 9% to EUR 95 million compared with EUR 87 million in the first half of 2022. The increase is driven by a higher operating result from Spain & Portugal of EUR 41 million, resulting from higher revenues and a one-time negative item in the first half of 2022, which more than offset the lost earnings from the sale of the 50% stake in the Spanish insurance joint venture with Liberbank in 2022. The operating result in Brazil increased due to business growth, a higher net investment result, and more favorable claims experience, while the operating result in China decreased mainly from a lower investment result as a consequence of a change in asset mix. The operating result from TLB was EUR 27 million and decreased by 31% following the internal reinsurance transaction between TLB and Transamerica in the second half of 2022.
|
|
Unaudited | Page 18 of 131 |
Condensed consolidated interim financial information for the period ended June 30, 2023
Holding
The operating result from the Holding was a loss of EUR 91 million, and mainly reflects funding expenses.
Non-operating items
The result from non-operating items amounted to a loss of EUR 180 million in the first half of 2023, mainly as a result of realized losses on investments and net impairments.
Fair value items
Fair value items were a gain of EUR 11 million, mainly driven by the Americas and partly offset by fair value losses in the UK.
In the Americas, fair value items amounted to a gain of EUR 79 million in the first half of 2023. Variable Annuity fair value items amounted to a gain of EUR 79 million as favorable markets led to gains on onerous contracts which were partly offset by some losses from fund basis risk. Market impacts on IUL hedging and fixed annuities resulted in a net gain of EUR 21 million driven by a mismatch between the asset returns and the projected crediting rate methodology. Fair value investments amounted to a loss of EUR 22 million mainly driven by the underperformance of private equity investments and partly offset by gains on derivatives due to credit spread tightening.
In the UK, fair value items amounted to a loss of EUR 40 million in the first half of 2023 and reflect the negative revaluations of hedges used to protect the solvency position and the impact of higher interest rates.
Realized losses on investments
Realized losses on investments amounted to EUR 95 million and were driven by the Americas. There, realized losses on investments amounted to EUR 96 million, mainly from the sale of bonds in the context of the agreement to reinsure a part of the SGUL portfolio to Wilton Re as well as to enable a reduction of short-term variable rate borrowings. This was partly offset by a gain from the disposition of bonds with an expected credit loss (ECL) balance.
Net impairments
Net impairments for the Group were EUR 96 million. These were driven by EUR 64 million of net impairments in the Americas from ECL balance increases mainly from a more conservative economic forecast in the ECL model and from purchases of new debt instruments. In International, net impairments of EUR 25 million related mainly to write-offs in the India associate prior to the announcement of its divestment in July 2023.
Other charges
Other charges amounted to EUR 870 million, which includes a net charge from the Netherlands. Note that the entire result of the Netherlands has been recorded as Other income following the annoucement of the transaction with a.s.r.
Other charges in the Americas amounted to EUR 574 million, in line with what was announced at the 2023
CMD. These were driven by EUR 317 million investments in the Life operating model and restructuring of an earn-out agreement with a founding WFG agent. Furthermore, there were EUR 257 million charges from model and assumption updates.
In International, Other charges of EUR 110 million were driven by a book loss from the completion of the divestment of Aegon’s businesses in Romania and Poland.
The loss in the Netherlands amounted to EUR 110 million and was driven by a further impairment, which was partially offset by a positive net result from Aegon the Netherlands as a standalone entity.
|
|
Unaudited | Page 19 of 131 |
Condensed consolidated interim financial information for the period ended June 30, 2023
Expenses
Operating expenses increased by 5%, or EUR 71 million compared with the first half of 2022 to EUR 1,497 million. This was mainly driven by an increase in restructuring expenses, which was driven by the one-time investments in Transamerica in its efficient operating model in order to improve customer service and product manufacturing. These more than offset the favorable impact from the completion of the sale of Aegon’s businesses in Central and Eastern Europe.
Addressable expenses remained stable on a constant currency basis when compared with the first half of 2022, at EUR 1,220 million. This reflects increased employee expenses in the US and UK in part due to inflation. It also reflects a decrease in the spend on outsourced activities.
|
|
Unaudited | Page 20 of 131 |
Condensed consolidated interim financial information for the period ended June 30, 2023
| Aegon N.V. | ||||||||||||||||
| Balance sheet items | ||||||||||||||||
| EUR millions |
Notes in Appendix B |
2023 Jun. 30 |
2022 Dec. 31 |
% |
||||||||||||
|
Shareholders’ equity |
8,148 | 8,815 | (8) | |||||||||||||
| Gross financial leverage |
5,586 | 5,621 | (1) | |||||||||||||
| Gross financial leverage ratio (%) |
27.4% | 25.7% | ||||||||||||||
| Americas |
5,158 | 5,801 | (11) | |||||||||||||
| United Kingdom |
1,146 | 1,300 | (12) | |||||||||||||
| International |
123 | 121 | 2 | |||||||||||||
|
Eliminations |
20 | 5 | n.m. | |||||||||||||
| Contractual Service Margin (CSM)1 (pro-forma after tax) |
6,446 | 7,227 | (11) | |||||||||||||
1 On IFRS basis, i.e. excluding joint ventures & associates.
| Aegon N.V. | ||||||||||||||||
| Contractual Service Margin (CSM) | ||||||||||||||||
| EUR millions | Notes in Appendix B |
1H 2023 | 1H 2022 | % | ||||||||||||
| CSM balance at beginning of period |
9,128 | 11,841 | (23) | |||||||||||||
| Americas |
214 | 206 | 4 | |||||||||||||
| Netherlands |
- | 19 | ||||||||||||||
| United Kingdom |
(29) | 8 | n.m. | |||||||||||||
|
International |
9 | 11 | (19) | |||||||||||||
| New business |
194 | 245 | (21) | |||||||||||||
| Americas |
(386) | (403) | 4 | |||||||||||||
| Netherlands |
- | (92) | n.m. | |||||||||||||
| United Kingdom |
(83) | (88) | 6 | |||||||||||||
|
International |
(15) | (16) | 4 | |||||||||||||
| CSM release |
(483) | (599) | 19 | |||||||||||||
| Accretion of interest |
126 | 105 | 20 | |||||||||||||
| Claims and policyholder experience variance |
(163) | (232) | 30 | |||||||||||||
|
Non-financial assumption changes |
(554) | (35) | n.m. | |||||||||||||
|
Non-disaggregated risk adjustment |
(107) | 881 | n.m. | |||||||||||||
| Market impact on unhedged risk of VFA products |
345 | (871) | n.m. | |||||||||||||
| Net exchange differences |
(105) | 590 | n.m. | |||||||||||||
| Other movements |
(78) | (42) | (88) | |||||||||||||
| CSM balance at end of period |
8,302 | 11,882 | (30) | |||||||||||||
Shareholders’ equity
As of June 30, 2023, shareholders’ equity was EUR 8.1 billion, or EUR 4.23 per common share; this was
EUR 0.7 billion lower than that at December 31, 2022. The reduction in equity was mainly driven by capital return to shareholders and the net loss in the first half of 2023.
|
|
Unaudited | Page 21 of 131 |
Condensed consolidated interim financial information for the period ended June 30, 2023
Gross financial leverage
Gross financial leverage remained unchanged in the first half of 2023 at EUR 5.6 billion.
Contractual Service Margin
The contractual service margin (CSM) amounted to EUR 8.3 billion per June 30, 2023, a decrease of EUR 0.8 billion compared with December 31, 2022.
The CSM release of EUR 483 million was mainly driven by the run-off of the Financial Assets in the Americas and of the traditional book in the UK. New business contributed EUR 194 million to CSM, mainly driven by growth in the US Individual Life business, while the reinsurance of the protection book in the UK had a negative impact. Interest accretion contributed another EUR 126 million to CSM.
Previously announced assumption changes in the Americas drove an overall decrease in CSM. The reduction of future profits from the removal of the morbidity improvement assumption and an increase in the inflation assumption for long-term care were partly offset by an increase of CSM from long-term care premium rate increases. The expected near term impacts of the COVID-19 pandemic were reflected in the mortality improvement assumption, and the impacts of the opioid crisis on expected mortality, especially on younger lives, was reflected as well. In addition, the impact of investments Aegon will make into a more customer focused operating model for Life was reflected in the assumptions, and reduced the CSM.
The negative claims and policyholder experience variance was driven by unfavorable experience in Individual
Life and unfavorable lapse and utilization experience on Variable Annuities, both in the US.
Markets had a favorable impact on the CSM for products accounted for under the variable fee approach (VFA), primarily variable annuities in the US. The present value of base contract fees on variable annuities, which we do not hedge, and that of fees on unit linked insurance products in the UK increased as a consequence of rising equity markets, resulting in a EUR 345 million increase in CSM. Various other items, including the impact of interest rate changes on the risk adjustment – which are reflected in the CSM – and currency movements had a negative impact of EUR 290 million on the CSM.
|
|
Unaudited | Page 22 of 131 |
Condensed consolidated interim financial information for the period ended June 30, 2023
Condensed consolidated interim financial statements
Condensed consolidated income statement
| EUR millions | Notes | YTD 2023 |
YTD2 2022 |
2Q 2023 |
2Q1 2022 |
|||||||||||||||
| Continuing operations |
||||||||||||||||||||
| Insurance revenue |
5,370 | 5,506 | 2,638 | 2,810 | ||||||||||||||||
| Insurance service expenses |
7 | (5,235) | (5,344) | (2,729) | (2,694) | |||||||||||||||
| Net income on reinsurance held |
185 | (120) | 132 | (162) | ||||||||||||||||
| Insurance service result |
4 | 319 | 41 | 41 | (45) | |||||||||||||||
| Interest revenue on financial instruments - effective interest method |
1,396 | 1,392 | 697 | 706 | ||||||||||||||||
| Interest revenue on financial instruments measured at FVPL |
382 | 244 | 176 | 124 | ||||||||||||||||
| Other investment income |
781 | 725 | 333 | 284 | ||||||||||||||||
| Results from financial transactions |
6,467 | (26,855) | 1,634 | (16,419) | ||||||||||||||||
| Impairment (losses) / reversals |
(80) | (47) | 10 | (20) | ||||||||||||||||
| Insurance finance income / (expenses) |
(9,246) | 24,957 | (2,981) | 15,471 | ||||||||||||||||
| Net reinsurance finance income / (expenses) on reinsurance held |
382 | 210 | 151 | 120 | ||||||||||||||||
| Interest expenses |
(114) | (14) | (73) | (10) | ||||||||||||||||
| Insurance net investment result |
5 | (32) | 612 | (54) | 257 | |||||||||||||||
| Interest revenue on financial instruments - effective interest method |
265 | 178 | 142 | 96 | ||||||||||||||||
| Interest revenue on financial instruments measured at FVPL |
26 | 19 | 12 | 11 | ||||||||||||||||
| Other investment income |
318 | 333 | 50 | 57 | ||||||||||||||||
| Results from financial transactions |
5 | 3,212 | (11,119) | 1,480 | (7,644) | |||||||||||||||
| Impairment (losses) / reversals |
(38) | (42) | (32) | (9) | ||||||||||||||||
| Investment contract income / (expenses) |
5 | (3,654) | 10,566 | (1,595) | 7,413 | |||||||||||||||
| Interest expenses |
(21) | 1 | (13) | 1 | ||||||||||||||||
| Other net investment result |
107 | (65) | 44 | (75) | ||||||||||||||||
| Interest charges |
(90) | (101) | (20) | (53) | ||||||||||||||||
| Other financial income |
- | 2 | - | (0) | ||||||||||||||||
| Financing net investment result |
(90) | (99) | (20) | (53) | ||||||||||||||||
| Total net investment result |
5 | (15) | 449 | (29) | 129 | |||||||||||||||
| Fee and commission income |
6 | 1,057 | 1,122 | 526 | 559 | |||||||||||||||
| Other operating expenses |
7 | (1,587) | (1,358) | (929) | (665) | |||||||||||||||
| Other income / (charges) |
8 | (48) | 244 | (48) | (82) | |||||||||||||||
| Other result |
(579) | 8 | (451) | (188) | ||||||||||||||||
| Result before share in profit / (loss) of joint ventures, associates and tax |
(275) | 497 | (439) | (105) | ||||||||||||||||
| Share in profit / (loss) of joint ventures |
103 | 122 | 51 | 58 | ||||||||||||||||
| Share in profit / (loss) of associates |
(13) | (11) | (2) | - | ||||||||||||||||
| Result before tax from continuing operations |
(186) | 608 | (391) | (47) | ||||||||||||||||
| Income tax (expense) / benefit |
9 | 69 | (29) | 104 | 18 | |||||||||||||||
| Net result from continuing operations |
(117) | 579 | (287) | (29) | ||||||||||||||||
| Discontinued operations |
||||||||||||||||||||
| Net result from discontinued operations |
20 | (82) | (533) | 350 | (134) | |||||||||||||||
| Net result from continuing and discontinued operations |
(199) | 46 | 64 | (163) | ||||||||||||||||
| Net result attributes to: |
||||||||||||||||||||
| Owners of Aegon N.V. |
(201) | 0 | 67 | (181) | ||||||||||||||||
| Non-controlling interests |
2 | 45 | (3) | 18 | ||||||||||||||||
| Earnings per share (EUR per share) |
12 | |||||||||||||||||||
| Basic earnings per common share |
(0.12) | (0.01) | 0.03 | (0.10) | ||||||||||||||||
| Basic earnings per common share B |
(0.00) | (0.00) | 0.00 | (0.00) | ||||||||||||||||
| Diluted earnings per common share |
(0.12) | (0.01) | 0.03 | (0.10) | ||||||||||||||||
| Diluted earnings per common share B |
(0.00) | (0.00) | 0.00 | (0.00) | ||||||||||||||||
| Earnings per share (EUR per share) from continuing operations |
||||||||||||||||||||
| Basic earnings per common share from continuing operations |
(0.07) | 0.25 | (0.16) | (0.03) | ||||||||||||||||
| Basic earnings per common share B from continuing operations |
(0.00) | 0.01 | (0.00) | (0.00) | ||||||||||||||||
| Diluted earnings per common share from continuing operations |
(0.07) | 0.25 | (0.16) | (0.03) | ||||||||||||||||
| Diluted earnings per common share B from continuing operations |
(0.00) | 0.01 | (0.00) | (0.00) | ||||||||||||||||
2 Comparatives have been restated due to the initial application of IFRS 9 and IFRS 17. Note 2.2 includes further details on the changes in accounting policies.
|
|
Unaudited | Page 23 of 131 |
Condensed consolidated interim financial information for the period ended June 30, 2023
Condensed consolidated statement
of comprehensive income
| EUR millions | Notes | YTD 2023 |
YTD1 2022 |
2Q 2023 |
2Q1 2022 |
|||||||||||||||
| Net result from continuing and discontinued operations |
(199) | 46 | 64 | (163) | ||||||||||||||||
| Other comprehensive income: |
||||||||||||||||||||
| Items that will not be reclassified to profit or loss: |
||||||||||||||||||||
| Gains/ (losses) on investments in equity instruments designated at FVOCI |
- | (1) | - | - | ||||||||||||||||
| Changes in revaluation reserve real estate held for own use |
1 | - | 1 | - | ||||||||||||||||
| Remeasurements of defined benefit plans |
(108) | 22 | (101) | (76) | ||||||||||||||||
| Income tax relating to items that will not be reclassified |
16 | (11) | 16 | 4 | ||||||||||||||||
| Discontinued operations that will not be reclassified 2 |
38 | 703 | 62 | 396 | ||||||||||||||||
| Insurance items that may be reclassified subsequently to profit or loss |
||||||||||||||||||||
| Gains / (losses) on financial assets measured at FVOCI |
5 | 567 | (11,235) | (871) | (5,894) | |||||||||||||||
| Gains / (losses) transferred to income statement on disposal of |
5 | 100 | 158 | 90 | 167 | |||||||||||||||
| financial assets measured at FVOCI |
||||||||||||||||||||
| Insurance finance income / (expenses) |
5 | (860) | 14,193 | 1,102 | 7,039 | |||||||||||||||
| Reinsurance finance income / (expenses) |
5 | 181 | (3,362) | (256) | (1,654) | |||||||||||||||
| Changes in cash flow hedging reserve |
(39) | (157) | (18) | 110 | ||||||||||||||||
| Income tax relating to items that may be reclassified |
10 | 104 | (12) | 51 | ||||||||||||||||
| Other items that may be reclassified subsequently to profit or loss: |
||||||||||||||||||||
| Gains / (losses) on financial assets measured at FVOCI |
89 | (1,246) | (113) | (438) | ||||||||||||||||
| Gains / (losses) on disposal of financial assets measured at FVOCI |
3 | 2 | (1) | (4) | ||||||||||||||||
| Changes in cash flow hedging reserve |
(3) | 26 | 3 | 24 | ||||||||||||||||
| Movement in foreign currency translation and net foreign investment hedging reserves |
(38) | 250 | (6) | 172 | ||||||||||||||||
| Equity movements of joint ventures |
(8) | (21) | 9 | (8) | ||||||||||||||||
| Equity movements of associates |
3 | (10) | 5 | (8) | ||||||||||||||||
| Disposal of group assets |
19 | 47 | 176 | 47 | 138 | |||||||||||||||
| Income tax relating to items that may be reclassified |
(15) | 261 | 25 | 91 | ||||||||||||||||
| Discontinued operations that may be reclassified |
12 | (252) | 2 | (146) | ||||||||||||||||
| Other |
17 | 2 | 15 | 3 | ||||||||||||||||
| Total other comprehensive income |
14 | (399) | (1) | (33) | ||||||||||||||||
| Total comprehensive income / (loss) |
(185) | (351) | 63 | (194) | ||||||||||||||||
1 Comparatives have been restated due to the initial application of IFRS 9 and IFRS 17. Note 2.2 includes further details on the changes in accounting policies.
2 Consists of remeasurement of defined benefit plans.
|
|
Unaudited | Page 24 of 131 |
Condensed consolidated interim financial information for the period ended June 30, 2023
Condensed consolidated statement
of financial position
| EUR millions | Notes | June 30, 2023 | December 31, 20221 | |||||||||
| Assets |
||||||||||||
| Cash and cash equivalents |
3,755 | 3,402 | ||||||||||
| Assets held for sale |
88,542 | 88,440 | ||||||||||
| Investments |
10 | 262,682 | 254,759 | |||||||||
| Derivatives |
805 | 2,771 | ||||||||||
| Investments in joint ventures |
1,413 | 1,430 | ||||||||||
| Investments in associates |
280 | 165 | ||||||||||
| Reinsurance contract assets |
13 | 16,467 | 16,939 | |||||||||
| Insurance contract assets |
13 | 53 | 36 | |||||||||
| Deferred tax assets |
2,383 | 2,433 | ||||||||||
| Deferred expenses |
447 | 452 | ||||||||||
| Other assets and receivables |
6,070 | 9,240 | ||||||||||
| Intangible assets |
367 | 420 | ||||||||||
| Total assets |
383,263 | 380,487 | ||||||||||
| Equity and liabilities |
||||||||||||
| Shareholders’ equity |
12 | 8,148 | 8,815 | |||||||||
| Other equity instruments |
1,937 | 1,943 | ||||||||||
| Issued capital and reserves attributable to equity holders of Aegon N.V. |
10,085 | 10,758 | ||||||||||
| Non-controlling interests |
163 | 176 | ||||||||||
| Group equity |
10,248 | 10,935 | ||||||||||
| Subordinated borrowings |
2,262 | 2,295 | ||||||||||
| Trust pass-through securities |
113 | 118 | ||||||||||
| Reinsurance contract liabilities |
13 | 211 | 270 | |||||||||
| Insurance contract liabilities |
13 | 177,695 | 176,120 | |||||||||
| Investment contracts with discretionary participating features |
13 | 21,533 | 21,055 | |||||||||
| Investment contracts without discretionary participating features |
14 | 71,960 | 65,227 | |||||||||
| Derivatives |
2,957 | 5,175 | ||||||||||
| Borrowings |
15 | 3,020 | 4,051 | |||||||||
| Liabilities related to assets and disposal groups held for sale |
83,828 | 83,959 | ||||||||||
| Other liabilities |
9,436 | 11,283 | ||||||||||
| Total liabilities |
373,015 | 369,553 | ||||||||||
| Total equity and liabilities |
383,263 | 380,487 | ||||||||||
1 Comparatives have been restated due to the initial application of IFRS 9 and IFRS 17. Note 2.2 includes further details on the changes in accounting policies.
|
|
Unaudited | Page 25 of 131 |
Condensed consolidated interim financial information for the period ended June 30, 2023
Condensed consolidated statement
of changes in equity
| EUR millions | Share capital |
Retained earnings |
Revaluation reserves |
Re- benefit plans |
Other reserves |
Shareholders’ equity |
Other equity instruments |
Reserve of held for sale |
Issued capital and reserves |
Non- controlling interests |
Total | |||||||||||||||||||||||||||||||||
| Opening balance at January 1, 20231 | 7,172 | 7,187 | (4,615) | (890) | 652 | 9,506 | 1,943 | (691) | 10,758 | 176 | 10,935 | |||||||||||||||||||||||||||||||||
| Net result recognized in the income statement | - | (201) | - | - | - | (201) | - | - | (201) | 2 | (199) | |||||||||||||||||||||||||||||||||
| Other comprehensive income: | ||||||||||||||||||||||||||||||||||||||||||||
| Items that will not be reclassified to profit or loss: | ||||||||||||||||||||||||||||||||||||||||||||
| Gains/ (losses) on investments in equity instruments (FVOCI) | - | - | - | - | - | - | - | - | - | - | - | |||||||||||||||||||||||||||||||||
| Changes in revaluation reserve real estate held for own use | - | - | 1 | - | - | 1 | - | - | 1 | - | 1 | |||||||||||||||||||||||||||||||||
| Remeasurements of defined benefit plans | - | - | - | (108) | - | (108) | - | - | (108) | - | (108) | |||||||||||||||||||||||||||||||||
| Income tax relating to items that will not be reclassified | - | - | - | 17 | - | 16 | - | - | 16 | - | 16 | |||||||||||||||||||||||||||||||||
| Discontinued operations that will not be reclassified | - | - | - | - | - | - | - | 38 | 38 | - | 38 | |||||||||||||||||||||||||||||||||
| Insurance items that may be reclassified subsequently to profit or loss | ||||||||||||||||||||||||||||||||||||||||||||
| Gains / (losses) on financial assets measured at FVOCI | - | - | 567 | - | - | 567 | - | - | 567 | - | 567 | |||||||||||||||||||||||||||||||||
| Gains / (losses) transferred to income statement on disposal of financial assets measured at FVOCI | - | - | 100 | - | - | 100 | - | - | 100 | - | 100 | |||||||||||||||||||||||||||||||||
| Insurance finance income / (expenses) | - | - | (860) | - | - | (860) | - | - | (860) | - | (860) | |||||||||||||||||||||||||||||||||
| Reinsurance finance income / (expenses) | - | - | 181 | - | - | 181 | - | - | 181 | - | 181 | |||||||||||||||||||||||||||||||||
| Changes in cash flow hedging reserve | - | - | (39) | - | - | (39) | - | - | (39) | - | (39) | |||||||||||||||||||||||||||||||||
| Income tax relating to items that may be reclassified | - | - | 10 | - | - | 10 | - | - | 10 | - | 10 | |||||||||||||||||||||||||||||||||
| Discontinued operations that may be reclassified | - | - | - | - | - | - | - | - | - | - | - | |||||||||||||||||||||||||||||||||
| Other items that may be reclassified subsequently to profit or loss: | ||||||||||||||||||||||||||||||||||||||||||||
| Gains / (losses) on financial assets measured at FVOCI | - | - | 89 | - | - | 89 | - | - | 89 | - | 89 | |||||||||||||||||||||||||||||||||
| Gains / (losses) on disposal of financial assets measured at FVOCI | - | - | 3 | - | - | 3 | - | - | 3 | - | 3 | |||||||||||||||||||||||||||||||||
| Changes in cash flow hedging reserve | - | - | (3) | - | - | (3) | - | - | (3) | - | (3) | |||||||||||||||||||||||||||||||||
| Movement in foreign currency translation and net foreign investment hedging reserves | - | - | 101 | 2 | (137) | (34) | - | - | (34) | (3) | (38) | |||||||||||||||||||||||||||||||||
| Equity movements of joint ventures | - | - | - | - | (8) | (8) | - | - | (8) | - | (8) | |||||||||||||||||||||||||||||||||
| Equity movements of associates | - | - | - | - | 3 | 3 | - | - | 3 | - | 3 | |||||||||||||||||||||||||||||||||
| Disposal of group assets | - | - | 19 | - | 28 | 47 | - | - | 47 | - | 47 | |||||||||||||||||||||||||||||||||
| Income tax relating to items that may be reclassified | - | - | (19) | - | 4 | (15) | - | - | (15) | - | (15) | |||||||||||||||||||||||||||||||||
| Discontinued operations that may be reclassified | - | - | - | - | - | - | - | 12 | 12 | - | 12 | |||||||||||||||||||||||||||||||||
| Other | - | 16 | - | - | - | 16 | - | 16 | 1 | 17 | ||||||||||||||||||||||||||||||||||
| Total other comprehensive income | - | 16 | 149 | (89) | (109) | (33) | - | 50 | 16 | (3) | 14 | |||||||||||||||||||||||||||||||||
| Total comprehensive income | - | (185) | 149 | (89) | (109) | (235) | - | 50 | (185) | - | (185) | |||||||||||||||||||||||||||||||||
| Issuance and (purchase) of treasury shares | - | (222) | - | - | - | (222) | - | - | (222) | - | (222) | |||||||||||||||||||||||||||||||||
| Dividends paid | - | (232) | - | - | - | (232) | - | - | (232) | - | (232) | |||||||||||||||||||||||||||||||||
| Coupons on perpetual securities | - | (24) | - | - | - | (24) | - | - | (24) | - | (24) | |||||||||||||||||||||||||||||||||
| Incentive plans | - | (5) | - | - | - | (5) | (6) | - | (11) | - | (11) | |||||||||||||||||||||||||||||||||
| Change in ownership non-controlling interests | - | - | - | - | - | - | - | - | - | (13) | (13) | |||||||||||||||||||||||||||||||||
| Closing equity at June 30, 2023 | 7,172 | 6,519 | (4,466) | (979) | 543 | 8,789 | 1,937 | (641) | 10,085 | 163 | 10,248 | |||||||||||||||||||||||||||||||||
1 Opening balance as per January 1, 2023 has been restated due to the initial application of IFRS 9 and IFRS 17. Note 2.2 includes further details on the changes in accounting policies.
|
|
Unaudited | Page 26 of 131 |
Condensed consolidated interim financial information for the period ended June 30, 2023
| EUR millions | Share capital |
Retained earnings |
Revaluation reserves |
Re- measurement of defined benefit plans |
Other reserves |
Shareholders’ equity |
Other equity instruments |
Issued capital and reserves |
Non- controlling interests |
Total | ||||||||||||||||||||||||||||||
| Opening balance (IAS 39 / IFRS 4) at January 1, 2022 1 | 7,354 | 12,362 | 6,442 | (2,199) | 325 | 24,282 | 2,363 | 26,645 | 196 | 26,841 | ||||||||||||||||||||||||||||||
| IFRS 9/17 opening balance impacts | - | (3,707) | (9,022) | - | (67) | (12,795) | - | (12,795) | - | (12,795) | ||||||||||||||||||||||||||||||
| Restated opening balance at January 1, 2022 | 7,354 | 8,655 | (2,580) | (2,199) | 258 | 11,487 | 2,363 | 13,850 | 196 | 14,046 | ||||||||||||||||||||||||||||||
| Net result recognized in the income statement | - | - | - | - | - | - | - | - | 45 | 46 | ||||||||||||||||||||||||||||||
| Other comprehensive income: | ||||||||||||||||||||||||||||||||||||||||
| Items that will not be reclassified to profit or loss: | ||||||||||||||||||||||||||||||||||||||||
| Gains/ (losses) on investments in equity instruments (FVOCI) | - | - | (1) | - | - | (1) | - | (1) | - | (1) | ||||||||||||||||||||||||||||||
| Change in fair value attributable to change in the credit risk of financial liability (FVPL) | - | - | - | - | - | - | - | - | - | - | ||||||||||||||||||||||||||||||
| Changes in revaluation reserve real estate held for own use | - | 17 | (18) | - | - | - | - | - | - | - | ||||||||||||||||||||||||||||||
| Remeasurements of defined benefit plans | - | - | - | 969 | - | 969 | - | 969 | - | 969 | ||||||||||||||||||||||||||||||
| Income tax relating to items that will not be reclassified | - | - | - | (256) | - | (256) | - | (256) | - | (256) | ||||||||||||||||||||||||||||||
| Insurance items that may be reclassified subsequently to profit or loss | ||||||||||||||||||||||||||||||||||||||||
| Gains / (losses) on financial assets measured at FVOCI | - | - | (11,235) | - | - | (11,235) | - | (11,235) | - | (11,235) | ||||||||||||||||||||||||||||||
| Gains / (losses) transferred to income statement on disposal of financial assets measured at FVOCI | - | - | 158 | - | - | 158 | - | 158 | - | 158 | ||||||||||||||||||||||||||||||
| Insurance finance income / (expenses) | - | - | 14,193 | - | - | 14,193 | - | 14,193 | - | 14,193 | ||||||||||||||||||||||||||||||
| Reinsurance finance income / (expenses) | - | - | (3,362) | - | - | (3,362) | - | (3,362) | - | (3,362) | ||||||||||||||||||||||||||||||
| Changes in cash flow hedging reserve | - | - | (157) | - | - | (157) | - | (157) | - | (157) | ||||||||||||||||||||||||||||||
| Income tax relating to items that may be reclassified | - | - | 104 | - | - | 104 | - | 104 | - | 104 | ||||||||||||||||||||||||||||||
| Other items that may be reclassified subsequently to profit or loss: | ||||||||||||||||||||||||||||||||||||||||
| Gains / (losses) on financial assets measured at FVOCI | - | - | (1,594) | - | - | (1,594) | - | (1,594) | - | (1,594) | ||||||||||||||||||||||||||||||
| Gains / (losses) on disposal of financial assets measured at FVOCI | - | - | 9 | - | - | 9 | - | 9 | - | 9 | ||||||||||||||||||||||||||||||
| Changes in cash flow hedging reserve | - | - | 26 | - | - | 26 | - | 26 | - | 26 | ||||||||||||||||||||||||||||||
| Movement in foreign currency translation and net foreign investment hedging reserves | - | - | (314) | (40) | 589 | 234 | - | 234 | 16 | 250 | ||||||||||||||||||||||||||||||
| Equity movements of joint ventures | - | - | - | - | (21) | (21) | - | (21) | - | (21) | ||||||||||||||||||||||||||||||
| Equity movements of associates | - | - | - | - | (8) | (8) | - | (8) | - | (8) | ||||||||||||||||||||||||||||||
| Disposal of group assets | - | - | 15 | - | 161 | 176 | - | 176 | - | 176 | ||||||||||||||||||||||||||||||
| Income tax relating to items that may be reclassified | - | - | 361 | - | (12) | 349 | - | 349 | - | 349 | ||||||||||||||||||||||||||||||
| Other | - | 2 | - | - | - | 2 | - | 2 | - | 2 | ||||||||||||||||||||||||||||||
| Total other comprehensive income | - | 19 | (1,815) | 673 | 708 | (416) | - | (416) | 17 | (399) | ||||||||||||||||||||||||||||||
| Total comprehensive income | - | 20 | (1,815) | 673 | 708 | (415) | - | (415) | 64 | (351) | ||||||||||||||||||||||||||||||
| Shares issued | 1 | - | - | - | - | 1 | - | 1 | - | 1 | ||||||||||||||||||||||||||||||
| Issuance and (purchase) of treasury shares | - | (47) | - | - | - | (47) | - | (47) | - | (47) | ||||||||||||||||||||||||||||||
| Redemption other equity instruments | - | 31 | - | - | - | 31 | (429) | (398) | - | (398) | ||||||||||||||||||||||||||||||
| Dividends paid | (80) | (77) | - | - | - | (157) | - | (157) | - | (157) | ||||||||||||||||||||||||||||||
| Coupons on perpetual securities | - | (16) | - | - | - | (16) | - | (16) | - | (16) | ||||||||||||||||||||||||||||||
| Incentive plans | - | (7) | - | - | - | (7) | (9) | (15) | - | (15) | ||||||||||||||||||||||||||||||
| Change in ownership non-controlling interests | - | - | - | - | - | - | - | - | (34) | (34) | ||||||||||||||||||||||||||||||
| Closing equity at June 30, 2022 | 7,274 | 8,559 | (4,395) | (1,526) | 965 | 10,877 | 1,925 | 12,802 | 225 | 13,027 | ||||||||||||||||||||||||||||||
1 Comparatives have been restated due to the initial application of IFRS 9 and IFRS 17. Note 2.2 includes further details on the changes in accounting policies
|
|
Unaudited | Page 27 of 131 |
Condensed consolidated interim financial information for the period ended June 30, 2023
Condensed consolidated cash flow statement
| EUR millions | YTD 2023 | YTD 20223 | ||||||
| Result before tax from continuing operations |
(186) | 608 | ||||||
| Result before tax from discontinued operations |
425 | (762) | ||||||
| Impairment loss on measurement of disposal group |
(430) | - | ||||||
| Result before tax from continuing operations and discontinued operations |
(191) | (154) | ||||||
| Results from financial transactions |
(10,681) | 54,841 | ||||||
| Amortization and depreciation |
(134) | 70 | ||||||
| Impairment losses |
113 | 64 | ||||||
| Results from (re)insurance contracts and investment contracts with discretionary participating features |
9,608 | (39,350) | ||||||
| Income from joint ventures |
(107) | (146) | ||||||
| Income from associates |
(1) | (76) | ||||||
| Release of cash flow hedging reserve |
(58) | (62) | ||||||
| Other |
697 | (69) | ||||||
| Adjustments of non-cash items |
(562) | 15,273 | ||||||
| Investment contracts without discretionary participating features |
5,561 | (9,670) | ||||||
| Accrued expenses and other liabilities |
(324) | (1,452) | ||||||
| Accrued income and prepayments |
344 | (144) | ||||||
| Changes in accruals |
5,581 | (11,266) | ||||||
| Insurance contracts |
(6,006) | (6,252) | ||||||
| Investment contracts with discretionary participating features |
(893) | (959) | ||||||
| Reinsurance contracts held |
762 | 747 | ||||||
| Purchase of investments (other than money market investments) |
(25,920) | (35,802) | ||||||
| Purchase of derivatives |
(833) | (3,373) | ||||||
| Disposal of investments (other than money market investments) |
27,991 | 46,889 | ||||||
| Disposal of derivatives |
(298) | (1,290) | ||||||
| Net change in cash collateral |
1,008 | (2,591) | ||||||
| Net purchase of money market investments |
400 | 300 | ||||||
| Cash flow movements on operating items not reflected in income |
(3,790) | (2,331) | ||||||
| Tax received / (paid) |
5 | 5 | ||||||
| Other |
17 | 23 | ||||||
| Net cash flows from operating activities |
1,061 | 1,550 | ||||||
| Purchase of individual intangible assets (other than future servicing rights) |
(13) | (12) | ||||||
| Purchase of equipment and real estate for own use |
(28) | (36) | ||||||
| Acquisition of subsidiaries, net of cash |
(30) | (28) | ||||||
| Acquisition joint ventures and associates |
(201) | (41) | ||||||
| Disposal of equipment |
48 | - | ||||||
| Disposal of subsidiaries, net of cash |
235 | 604 | ||||||
| Disposal joint ventures and associates |
12 | 7 | ||||||
| Dividend received from joint ventures and associates |
108 | 37 | ||||||
| Net cash flows from investing activities |
130 | 532 | ||||||
| Purchase of treasury shares |
(243) | (150) | ||||||
| Proceeds from TRUPS1, subordinated loans and borrowings |
2,463 | 2,339 | ||||||
| Repayment of perpetuals |
- | (429) | ||||||
| Repayment of TRUPS1, subordinated borrowings and borrowings |
(3,392) | (2,848) | ||||||
| Dividends paid |
(232) | - | ||||||
| Coupons on perpetual securities |
(33) | (21) | ||||||
| Payment of lease liabilities |
(20) | (24) | ||||||
| Change in ownership non-controlling interests |
(13) | (28) | ||||||
| Other |
- | 31 | ||||||
| Net cash flows from financing activities |
(1,470) | (1,131) | ||||||
| Net increase / (decrease) in cash and cash equivalents 2 |
(279) | 951 | ||||||
| Net cash and cash equivalents at the beginning of the reporting period |
8,486 | 6,861 | ||||||
| Effects of changes in exchange rate |
(20) | 85 | ||||||
| Net cash and cash equivalents at the end of the reporting period |
8,188 | 7,897 | ||||||
| Cash classified as Assets held for sale |
4,460 | - | ||||||
| Bank overdrafts |
(27) | - | ||||||
| Cash and cash equivalents in balance sheet |
3,755 | - | ||||||
1 Trust pass-through securities
2 Included in net increase / (decrease) in cash and cash equivalents are interest received EUR 3,030 million (2022: EUR 2,640 million) dividends received EUR 1,326 million (2022: EUR 1,193 million) and interest paid EUR 298 million (2022: EUR 156 million). All included in operating activities except for dividend received from joint ventures and associates EUR 108 million (2022: EUR 37 million).
3 Comparatives have been restated due to the initial application of IFRS 9 and IFRS 17. Note 2.2 includes further details on the changes in accounting policies.
|
|
Unaudited | Page 28 of 131 |
Condensed consolidated interim financial information for the period ended June 30, 2023
Notes to the condensed consolidated interim financial statements
1. General information
Amounts in EUR millions, unless otherwise stated.
Aegon N.V., incorporated and domiciled in the Netherlands, is a public limited liability company organized under Dutch law and recorded in the Commercial Register of The Hague under number 27076669 and with its registered address at Aegonplein 50, 2591 TV, The Hague, the Netherlands. Aegon N.V. serves as the holding company for the Aegon Group and has listings of its common shares in Amsterdam and New York.
Aegon N.V. (or ‘the Company’) and its subsidiaries (‘Aegon’ or ‘the Group’) have life insurance and pensions operations and are also active in savings and asset management operations, accident and health insurance, general insurance and to a limited extent banking operations. Aegon focuses on three core markets (the United States, the Netherlands, and the United Kingdom), three growth markets (Spain & Portugal, China, and Brazil) and one global asset manager. Headquarters are located in The Hague, the Netherlands. The Group employs over 18,500 people worldwide.
2. Material accounting policy information and estimates
2.1 Basis of presentation
The condensed consolidated interim financial statements as at, and for the three-month (‘second quarter 2023’ or ‘2Q 2023’) and six-month periods ended, June 30, 2023 (‘first half year 2023’ or ‘1H 2023’), have been prepared in accordance with IAS 34 ‘Interim Financial Reporting’, as adopted by the European Union (hereafter ‘EU-IFRS’). They do not include all of the information required for a full set of financial statements prepared in accordance with EU-IFRS and should therefore be read together with the 2022 consolidated financial statements of Aegon N.V. as included in Aegon’s Annual Report for 2022, which is available on its website (www.aegon.com).
Additional disclosures have been included in the interim financial statements in relation to the initial application of IFRS 9 and IFRS 17, that became effective on January 1, 2023.
The condensed consolidated interim financial statements are presented in euro (EUR) and all values are rounded to the nearest million unless otherwise stated. The consequence is that the rounded amounts may not add up to the rounded total in all cases.
2.2 New accounting policies
The accounting policies and methods of computation applied in the condensed consolidated interim financial statements are the same as those applied in the 2022 consolidated financial statements, except for the following IFRS standards and amendments that became effective for Aegon from January 1, 2023 and have been endorsed by the European Union:
| ◾ | IFRS 17 Insurance contracts |
| ◾ | Initial Application of IFRS 17 and IFRS 9 – Comparative information (Amendments to IFRS 17) |
| ◾ | IFRS 9 Financial instruments |
| ◾ | Prepayment Features with Negative Compensation (Amendments to IFRS 9) |
| ◾ | Disclosure of Accounting Policies (Amendments to IAS 1 and IFRS Practice Statement 2) |
| ◾ | Definition of Accounting Estimates (Amendments to IAS 8) |
| ◾ | Deferred tax related to Assets and Liabilities arising from a Single Transaction (Amendments to IAS 12) |
|
|
Unaudited | Page 29 of 131 |
Condensed consolidated interim financial information for the period ended June 30, 2023
Aegon has not yet applied “International Tax Reform – Pillar Two Model Rules (Amendments to IAS 12)” which was published on 23 May 2023 and became effective retrospectively per 1 January 2023, as Pillar Two Model Rules have not been (substantively) enacted in the tax jurisdictions within which it operates. Furthermore, the amendments to IAS 12 have not yet been endorsed by the European Union.
The adoption of IFRS 17 and IFRS 9, which replaced IFRS 4 and IAS 39 respectively, have had a significant impact on the financial position of Aegon and the condensed consolidated interim financial statements. Based on the amendment to IFRS 17, Aegon has decided to apply the overlay approach upon initial application of IFRS 9 and IFRS 17. This has allowed it to restate the 2022 comparative period for both new standards.
IFRS 9 also significantly amended the credit risk disclosures required by IFRS 7 ‘Financial Instruments: Disclosures’. The consequential amendments to IFRS 7 disclosures have also been applied to the comparative period.
A full description of Aegon’s accounting policies for financial instruments, (re)insurance contracts and investment contracts with discretionary participating features can be found in Appendix A ‘Material accounting policy information of Aegon N.V. in accordance with IFRS 9 and IFRS 17 (as per 1 January 2023)’. The main differences compared to the previous accounting policies and the main elements of the transition accounting are described below.
The impact of the adoption of the amendments to other standards, listed above, was immaterial.
2.2.1 Effects of initial adoption of IFRS 9 and IFRS 17
The effects of adopting IFRS 9 and IFRS 17 on the consolidated financial statements at January 1, 2022 are presented in the statement of changes in equity. The adjustments made to the statement of financial position on transition date of January 1, 2022, and on initial application date January 1, 2023 of IFRS 9 and IFRS 17 are presented below.
The transition to IFRS 9 and IFRS 17 changes Aegon’s balance sheet significantly. The main changes are:
| ◾ | Deferred policy acquisition cost (DPAC) and Value of Business Acquired (VOBA) will no longer be recognized as separate assets; |
| ◾ | Residential mortgages related to the insurance entities in the Netherlands will be measured at fair value through P&L instead of at amortized cost; |
| ◾ | Insurance liabilities are measured at fulfilment value which represents the present value of future cashflow to fulfil insurance contracts, including a risk adjustment for non-financial risk. Interest rate movements impacting the fulfilment value flow through P&L or OCI, depending on the accounting policy choice. Aegon Americas applies the OCI option for certain groups of contracts, whereas Aegon the Netherlands and Aegon UK apply the P&L option. These choices are aligned with the measurement of the related assets to ensure an accounting match for market movements on assets and liabilities; and |
| ◾ | On top of the fulfilment value, a contractual service margin (CSM), reflecting unearned profits, is added to the insurance liabilities. |
|
|
Unaudited | Page 30 of 131 |
Condensed consolidated interim financial information for the period ended June 30, 2023
| EUR millions | December 31, 2022
(as previously reported) |
Adoption of IFRS 9 and IFRS 17 |
January 1, 2023
(restated) |
|||||||||
| Assets |
||||||||||||
| Cash and cash equivalents |
3,407 | (5) | 3,402 | |||||||||
| Assets held for sale |
88,902 | (462) | 88,440 | |||||||||
| Investments |
76,825 | 177,934 | 254,759 | |||||||||
| Investments for account of policyholders |
180,006 | (180,006) | - | |||||||||
| Derivatives |
2,760 | 11 | 2,771 | |||||||||
| Investments in joint ventures |
1,443 | (13) | 1,430 | |||||||||
| Investments in associates |
165 | (0) | 165 | |||||||||
| Reinsurance contract assets |
21,184 | (4,245) | 16,939 | |||||||||
| Insurance contract assets |
- | 36 | 36 | |||||||||
| Deferred tax assets |
1,827 | 606 | 2,433 | |||||||||
| Deferred expenses |
12,886 | (12,434) | 452 | |||||||||
| Other assets and receivables |
10,291 | (1,051) | 9,240 | |||||||||
| Intangible assets |
1,240 | (820) | 420 | |||||||||
| Total assets |
400,936 | (20,449) | 380,487 | |||||||||
| Shareholders’ equity |
11,440 | (2,625) | 8,815 | |||||||||
| Other equity instruments |
1,943 | 0 | 1,943 | |||||||||
| Issued capital and reserves attributable to owners of Aegon N.V. |
13,383 | (2,625) | 10,758 | |||||||||
| Non-controlling interests |
176 | 0 | 176 | |||||||||
| Group equity |
13,559 | (2,624) | 10,935 | |||||||||
| Subordinated borrowings |
2,295 | (0) | 2,295 | |||||||||
| Trust pass-through securities |
118 | 0 | 118 | |||||||||
| Reinsurance contract liabilities |
- | 270 | 270 | |||||||||
| Insurance contracts for account of policyholders |
100,409 | (100,409) | - | |||||||||
| Insurance contract liabilities |
87,309 | 88,811 | 176,120 | |||||||||
| Investments contracts |
10,658 | (10,658) | - | |||||||||
| Investment contracts for account of policyholders |
80,555 | (80,555) | - | |||||||||
| Investment contract liabilities with discretionary participating features |
- | 21,055 | 21,055 | |||||||||
| Investment contracts without discretionary participating features |
- | 65,227 | 65,227 | |||||||||
| Derivatives |
6,094 | (919) | 5,175 | |||||||||
| Borrowings |
4,051 | (0) | 4,051 | |||||||||
| Liabilities held for sale |
84,119 | (160) | 83,959 | |||||||||
| Other liabilities |
11,766 | (483) | 11,283 | |||||||||
| Total liabilities |
387,376 | (17,823) | 369,553 | |||||||||
| Total equity and liabilities |
400,936 | (20,449) | 380,487 | |||||||||
Due to these transition adjustments and the different measurement of insurance contracts and financial instruments during 2022, total assets as of January 1, 2023, were lower by EUR 20,449 million, total liabilities were lower by 17,823 million and shareholders’ equity was lower by EUR 2,625 million than the amounts presented in the last annual financial statements for December 31, 2022.
On implementation of IFRS 9 and IFRS 17 the comparative balance of shareholder’s equity is restated due to the combination of opening balance sheet adjustments (decrease of EUR 12,795 million) of the transition date, and the cumulative differences in equity movements of 2022 arising from the application of IFRS 9 and 17 in the amount of EUR 10,170 million increase, of which 8,853 million is an adjustment to the change in the revaluation reserve. The remaining impact of EUR 1,318 million is largely attributable to the changes in CSM balance and different measurement of insurance liabilities.
|
|
Unaudited | Page 31 of 131 |
Condensed consolidated interim financial information for the period ended June 30, 2023
The decrease of total assets is for an amount of EUR 12,434 million as of January 1, 2023 (2022: EUR 10,076 million decrease) attributable to the elimination of deferred acquisition costs, which are no longer recognized under IFRS 17 as separate assets, but form part of the fulfillment cash-flows used in the measurement of insurance contracts.
The change in the measurement basis of insurance contracts (as described under note 2.2.2) resulted in a decrease of EUR 11,598 million in the carrying amount of insurance liabilities (Insurance contract liabilities and Insurance contracts for account of policyholders combined) as of January 1, 2023 (2022: EUR 16,321 million increase), and also impacted reinsurance assets resulting in a lower carrying amount by EUR 4,245 million (2022: EUR 330 million increase) and investment contracts, which decreased by EUR 4,931 (2022: EUR 6,602 million decrease).
The impacts of transition from IAS 39 to IFRS 9 on the carrying amounts of financial instruments including investments, derivative assets and liabilities, investment contracts without discretionary participating features, other financial assets and liabilities are detailed in note 2.2.3.2.
The carrying amount of assets held for sale on January 1, 2023 was lower by EUR 462 million compared to the balance presented in the latest annual financial statements of December 31, 2022. Regarding liabilities held for sale, the carrying amount on January 1, 2023 was lower by EUR 160 million compared to the figures previously reported. Note 20 includes details on the impacts of IFRS 9 and 17 on the measurement of the disposal group.
The book value of intangible assets decreased by EUR 820 million as of January 1, 2023 (2022: EUR 748 million) due to the derecognition of value of business acquired on transition, as it will not be recognized as a separate asset under IFRS 17.
|
|
Unaudited | Page 32 of 131 |
Condensed consolidated interim financial information for the period ended June 30, 2023
| EUR millions | December 31, 2021 (as previously reported) |
Adoption of IFRS 9 and IFRS 17 |
January 1, 2022 (restated) |
|||||||||
| Assets |
||||||||||||
| Cash and cash equivalents |
6,889 | (28) | 6,861 | |||||||||
| Investments |
158,463 | 251,614 | 410,077 | |||||||||
| Investments for account of policyholders |
250,953 | (250,953) | - | |||||||||
| Derivatives |
8,827 | 16 | 8,843 | |||||||||
| Investments in joint ventures |
1,743 | (28) | 1,715 | |||||||||
| Investments in associates |
1,289 | (0) | 1,289 | |||||||||
| Reinsurance contract assets |
20,992 | 330 | 21,322 | |||||||||
| Insurance contract assets |
- | 110 | 110 | |||||||||
| Deferred tax assets |
131 | 1,870 | 2,001 | |||||||||
| Deferred expenses |
10,503 | (10,076) | 428 | |||||||||
| Other assets and receivables |
7,761 | (963) | 6,798 | |||||||||
| Intangible assets |
1,333 | (748) | 585 | |||||||||
| Total assets |
468,884 | (8,856) | 460,029 | |||||||||
| Shareholders’ equity |
24,282 | (12,795) | 11,487 | |||||||||
| Other equity instruments |
2,363 | 0 | 2,363 | |||||||||
| Issued capital and reserves attributable to owners of Aegon N.V. |
26,645 | (12,795) | 13,850 | |||||||||
| Non-controlling interests |
196 | 0 | 196 | |||||||||
| Group equity |
26,841 | (12,795) | 14,046 | |||||||||
| Subordinated borrowings |
2,194 | 0 | 2,194 | |||||||||
| Trust pass-through securities |
126 | - | 126 | |||||||||
| Reinsurance contract liabilities |
- | 471 | 471 | |||||||||
| Insurance contracts for account of policyholders |
149,323 | (149,323) | - | |||||||||
| Insurance contract liabilities |
124,422 | 165,644 | 290,066 | |||||||||
| Investment contracts |
21,767 | (21,767) | - | |||||||||
| Investment contracts for account policyholder |
104,592 | (104,592) | - | |||||||||
| Investment contract liabilities with discretionary participating features |
- | 27,392 | 27,392 | |||||||||
| Investment contracts without discretionary participating features |
- | 92,364 | 92,364 | |||||||||
| Derivatives |
10,639 | (3,501) | 7,138 | |||||||||
| Borrowings |
9,661 | 0 | 9,661 | |||||||||
| Other liabilities |
19,321 | (2,749) | 16,572 | |||||||||
|
Total liabilities |
442,044 | 3,939 | 445,983 | |||||||||
| Total equity and liabilities |
468,884 | (8,856) | 460,029 | |||||||||
As the result of restatement of the opening balance sheet on transition date January 1, 2022 the carrying amount of total assets decreased by EUR 8,856 million while total liabilities increased by EUR 3,939 million and as such shareholders’ equity decreased by EUR 12,795 million. The main component of this change was the net decrease of other comprehensive income by EUR 9,022 million due to the establishment of a revaluation reserve for interest rate movements on insurance liabilities under IFRS 17, and the reclassification of revaluation reserves on financial assets from other comprehensive income to retained earnings. The total decrease of retained earnings in amount of EUR 3,707 million also includes the establishment of CSM on insurance contracts, partly offset by other remeasurements arising from lower fulfillment cashflows under
IFRS 17 compared to IFRS 4.
The impact of restated adjustments due to the adoption of IFRS 9 and IFRS 17 on earnings per share is reflected in the table below.
|
|
Unaudited | Page 33 of 131 |
Condensed consolidated interim financial information for the period ended June 30, 2023
| 1H 2022 | 1H 2022 | |||||||||||
|
Impact of adoption of new accounting standards on the consolidated income statement |
Adoption of IFRS 9 and IFRS | |||||||||||
| (as previously reported) |
17 | (restated) | ||||||||||
| Earnings per share (EUR per share) |
||||||||||||
| Basic earnings per common share |
0 | (0.01) | (0.01) | |||||||||
| Basic earnings per common share B |
0 | 0 | 0 | |||||||||
| Diluted earnings per common share |
0 | (0.01) | (0.01) | |||||||||
| Diluted earnings per common share B |
0 | 0 | 0 | |||||||||
| Earnings per common share calculation |
||||||||||||
| Net result / (loss) attributable to owners |
19 | (19) | 0 | |||||||||
| Coupons on perpetual securities |
(16) | 0 | (16) | |||||||||
| Net result / (loss) attributable to owners for basic earnings per share calculation |
3 | (18) | (15) | |||||||||
| Weighted average number of common shares outstanding (in million) |
2,021 | 0 | 2,021 | |||||||||
| Weighted average number of common shares B outstanding (in million) |
538 | 0 | 538 | |||||||||
2.2.2 IFRS 17 Insurance contracts
Aegon has adopted IFRS 17 – Insurance Contracts, including any consequential amendments to other standards, with a date of initial application of January 1, 2023 and a transition date of January 1, 2022.
Aegon does not use the optional exemption provided under EU-IFRS to group together specific insurance contracts that were issued more than 12 months apart.
2.2.2.1 Changes compared to previous accounting policies
Under IFRS 4, Aegon largely continued to report under the accounting policies that were applied prior to the adoption of EU-IFRS. This meant that, in general, the Group applied non-uniform accounting policies for insurance assets and liabilities as allowed under Dutch Accounting Policies. Specific measurement methodologies differed between Aegon’s operations, reflecting local regulatory requirements and local practices for specific product features. Under IFRS 17, consistent accounting policies are applied to all insurance contracts and investment contracts with discretionary participation features, regardless of the jurisdiction in which the contracts have been issued.
Under Aegon’s previous accounting policies, some minimum guarantees were separated from the host insurance contracts and classified as derivatives. The Group also elected to apply the accounting option under IFRS 4 to measure certain closely related minimum guarantees at fair value. Under IFRS 17, Aegon has not identified any embedded derivatives that require separation. All minimum guarantees are measured together with the host contract, in accordance with the requirements of IFRS 17.
Policy loans, value of business acquired, and insurance payables and receivables, which were previously accounted for as separate assets, are now included in the measurement of the insurance liabilities.
Measurement
IFRS 17 establishes principles for the accounting for insurance contracts, reinsurance contracts, and investment contracts with discretionary participation features. It introduces a model that measures groups of contracts based on Aegon’s estimate of the present value of the future cash flows that will arise as these contracts are fulfilled, and which includes an explicit risk adjustment for non-financial risk and a contractual service margin (CSM) reflecting unearned profits. Contrary to previous accounting, IFRS 17 requires estimates to be current, unbiased and probability-weighted, incorporating all available information in a way that is consistent with observable market data.
|
|
Unaudited | Page 34 of 131 |
Condensed consolidated interim financial information for the period ended June 30, 2023
IFRS 17 prescribes modifications to the general measurement model for contracts with direct participating features (the ‘variable fee approach’) and for reinsurance contracts held. The standard also provides an option to simplify the measurement of certain short-term contracts (the ‘premium allocation approach’, ‘PAA’), which is primarily applied by Aegon to non-life insurance contracts and related reinsurance contracts held. The measurement of these contracts is similar to the previous treatment under IFRS 4, albeit that when measuring liabilities for incurred claims, Aegon now discounts cash flows expected to occur more than one year after the claim’s date and includes an explicit risk adjustment for non-financial risk.
Acquisition costs
Previously, under IFRS 4, all acquisition costs were recognized and presented as separate assets (‘DPAC’) until these costs were included in profit or loss. Under IFRS 17, only insurance acquisition cash flows that arise before the recognition of the related insurance contracts are included within the insurance liability as a separate asset. These assets, which are subject to recoverability testing, are derecognized and included in the carrying amount of the related portfolio of contracts on initial recognition.
For some (but not all) groups of contracts for which the premium allocation approach is applied, Aegon has opted to expense acquisition costs when incurred.
Aegon allocates acquisition costs to either product or business lines (where applicable) based on a study, a series of studies or a thoroughly defined rational for their allocation methodologies.
Revenue and expenses
Under IFRS 4, the revenues reported in the income statement included gross insurance premiums when due, or for products where deposit accounting was required, surrender fees and other charges. Under IFRS 17, the insurance revenue in each reporting period reflects the consideration to which Aegon expects to be entitled in exchange for the services provided in that period.
The actual claims and expenses incurred in providing the service, are presented in the income statement as insurance service expenses.
Insurance finance income and expenses, disaggregated between profit or loss and other comprehensive income (OCI) for certain groups of contracts, are now presented separately from insurance revenue and insurance service expenses.
Income and expenses from reinsurance contracts, other than insurance finance expenses, are presented as a single net amount in the income statement. Previously, amounts recovered from reinsurers and reinsurance expenses were presented separately.
2.2.2.2 Transition
Changes in accounting policies resulting from the adoption of IFRS 17 were applied retrospectively, to the extent practicable. Aegon considered the full retrospective approach to be impracticable when its application required hindsight, for example in setting historical assumptions, or if the required historical input data could not be made available within reasonable efforts. The latter was, for example, concluded when information was no longer, available electronically and incorporating it into the IFRS 17 reporting process was expected to cause high costs and efforts.
If the retrospective application of IFRS 17 to a group of contracts was impracticable, either the modified retrospective approach or the fair value approach was applied. The modified retrospective approach may only be applied if there is reasonable and supportable information available to do so. For groups of contracts that in principle were eligible for both the modified retrospective and the fair value approach, the most appropriate transition method was elected based on a mix of operational and financial considerations.
|
|
Unaudited | Page 35 of 131 |
Condensed consolidated interim financial information for the period ended June 30, 2023
Notwithstanding the foregoing, Aegon applied the fair value approach to some groups of contracts with direct participating features, to which it could have applied IFRS 17 fully retrospectively. These were groups of contracts for which Aegon had mitigated financial risk prior to transition using derivatives, other financial instruments classified as fair value through profit or loss, and reinsurance contracts, and to which risk mitigation has been applied prospectively from the transition date.
Fair Value Approach
Under the fair value approach, the carrying amount of a group of insurance contracts at transition is determined in accordance with IFRS 13 Fair Value Measurement but with the exclusion of the guidance on demand features. The difference between the fair value and the fulfilment cash flows at the transaction -date is recognized as contractual service margin.
In estimating the fair value of insurance contracts for the transition to IFRS 17, Aegon applied a methodology whereby the estimated future cash flows were adjusted for known differences between the IFRS 17 and market valuation methodologies (such as the inclusion of investment expenses for all product types) and the risk adjustment was recalculated at a higher confidence level to reflect the additional compensation that a market participant would require for financial risk and the remaining contractual services that need to be provided. Where possible, the results were compared to market-observable transactions, such as recent reinsurance transactions entered into by Aegon and sales transactions of insurance portfolios and businesses.
For contracts that transitioned to IFRS 17 under the fair value approach, the following assessments were generally performed at original contract inception date, with a limited number of products being assessed at the transition date:
| ◾ | Assessment whether an insurance contract met the definition of an insurance contract with direct participating features; |
| ◾ | Assessment whether an investment contract met the definition of an investment contract with discretionary participating features; and |
| ◾ | Identification of discretionary cash flows for insurance contracts without direct participating features. |
The grouping of contracts to which the fair value approach is applied has been performed at the transition date. The contracts were grouped together in portfolios following the approach described in Appendix A ‘Significant Accounting Policies of Aegon N.V. in accordance with IFRS 9 and IFRS 17 (as per 1 January 2023)’. None of the contracts were identified as being onerous at transition. The identified groups of contracts were not further segmented into cohorts based on issue date.
The discount rates at which interest is accrued to the contractual service margin and at which changes in non-financial assumptions are recognized for groups of contracts without direct participating features have also been set at the transition date.
Modified Retrospective Approach
The objective of a modified retrospective approach is to reach the closest outcome to the full retrospective approach using reasonable and supportable information that can be obtained without undue cost or effort. Aegon applied the modified retrospective approach to groups of contracts for which the fair value approach was not the preferred transition approach, by working back from the transition date to the date on initial recognition to gather the necessary information. Only where the information could not be made available without undue effort were modifications applied as allowed under IFRS 17.
For all contracts that transitioned to IFRS 17 under the modified retrospective approach, sufficient information was available to perform the contract classifications at the original contract inception date.
|
|
Unaudited | Page 36 of 131 |
Condensed consolidated interim financial information for the period ended June 30, 2023
The grouping of contracts was performed at the original contract inception date, or if there was a lack of reasonable and supportable information, at the transition date. Contracts were grouped into cohorts not exceeding 12 months.
None of the contracts to which the modified retrospective approach was applied were identified as being onerous at initial inception.
Modifications applied to contracts without direct participating features
To determine the contractual service margin at transition for groups of contracts without direct participating features, Aegon first estimated the contractual service margin at the original inception date. The contractual service margin at inception was then rolled forward to the transition date by deducting the estimated amount that would have been released for services provided prior to transition.
In order to attribute past calendar-year cash flows (including acquisition cash flows) to issue year cohorts, appropriate allocation keys were set by cash flow type based on the information available. Examples include accumulated premiums in force and (first year) account values.
The calculation of the fulfilment cash flows at inception and the subsequent accretion of interest to the contractual service margin of a group of contracts, required the use of historical discount rates. In principle, Aegon determines IFRS 17 discount rates using a hybrid approach based on risk-free rates plus an illiquidity premium based on expected asset returns. Where the necessary asset portfolio data was not or no longer available, an appropriate observable yield curve plus a spread adjustment was applied to approximate historical discount rates. For cohorts that exceed 12 months, weighted-average historical discount rates were applied. The weighting was based on sales volumes, or where not available, on the expected coverage units at inception.
The modified retrospective calculations were based on the assumption that Aegon had not previously prepared interim financial statements, unless sufficient information existed to roll the contractual service margin forward with Aegon’s historical reporting frequency.
Modifications applied to contracts with direct participating features
To determine the contractual service margin at transition for a group of insurance contracts with direct participating features, Aegon first estimated the total contractual service margin for all services to be provided for that group of contracts. It then deducted the estimated amount that would have been released for services provided prior to the transition date.
The total contractual service margin for all services to be provided was estimated by taking the fair value of the underlying items at the transition date minus the fulfilment cash flows at that date and adjusting it for:
| ◾ | Amounts charged to policyholders prior to the transition date |
| ◾ | Excess claims and expenses paid in this period, including acquisition costs; and |
| ◾ | The estimated change in the risk adjustment for non-financial risk caused by the release of risk before the transition date. |
Calendar year cash flows were attributed to issue years using allocation keys that were appropriate for the cash flow types, based on available information (for example, account value, and for excess claims paid, the net amount at risk). In estimating the change in the risk adjustment for non-financial risk prior to the transition date, the projected risk adjustment pattern for newly issued cohorts of similar products were deemed an appropriate proxy for previous years.
The amount released for services provided prior to transition was determined by multiplying the adjusted total contractual service margin by the ratio of the coverage units served prior to transition and the total coverage units expected to be provided over the lifetime of the group of contracts.
|
|
Unaudited | Page 37 of 131 |
Condensed consolidated interim financial information for the period ended June 30, 2023
Other Comprehensive Income
Under IFRS 17, Aegon has elected to disaggregate the insurance finance income or expenses between profit or loss and OCI for certain groups of contracts without direct participating features that are issued in the Americas and Asia. The balance recognized in OCI has been determined retrospectively where possible, or alternatively, has been set to nil at the transition date. The latter applies, for example, to the fixed deferred annuities, indexed universal life and other life insurance products with indirect participating features issued in the Americas.
Aegon also no longer applies shadow accounting which, ignoring the impact of any reclassifications of investments discussed below, has had a positive impact on the carrying amount of revaluation reserves presented in OCI.
2.2.3 IFRS 9 Financial instruments
Aegon has adopted IFRS 9 as issued by the IASB in July 2014, with a date of initial application of January 1, 2023 and a transition date of January 1, 2022. Aegon did not early adopt IFRS 9 in previous periods. Aegon has elected to continue to apply the hedge accounting requirements for macro fair value hedges of IAS 39 on adoption of IFRS 9. As such, fair value hedge accounting for portfolio hedges of interest rate risk (macro hedging) under the EU ‘carve out’ of IFRS is applied.
2.2.3.1. Changes compared to previous accounting policies
The adoption of IFRS 9 resulted in changes in Aegon’s accounting policies for recognition, classification and measurement of financial assets and financial liabilities, impairment of financial assets and hedge accounting.
Classification and Measurement
Under IAS 39, financial assets were classified as ‘Available-For-Sale’ (AFS), ‘Loans and Receivables’ (L&R) or as held at ‘Fair Value Through Profit or Loss’ (FVTPL). The following financial assets are measured at FVTPL: financial assets held for trading, financial assets managed on a fair value basis and financial assets containing an embedded derivative that is not closely related and that cannot be reliably bifurcated. In addition, in certain instances Aegon designated financial assets to this category when by doing so a potential accounting mismatch in the financial statements is eliminated or significantly reduced.
Under IFRS 9, classification and measurement differ for debt instruments and equity instruments.
Debt instruments are those instruments that meet the definition of a financial liability from the issuer’s perspective, such as mortgage loans, private loans, and government and corporate bonds. Aegon classifies its debt instruments into one of the following three IFRS 9 measurement categories, based on its business model for managing the asset, the asst’s cash flow characteristics, and Aegon’s intent to designate the asset at FVPL to eliminate or significantly reduce an accounting mismatch or recognition inconsistency:
| ◾ | Amortized cost (‘AC’): Assets that are held for collection of contractual cash flows where those cash flows represent solely payments of principal and interest (‘SPPI’), and that are not designated at FVPL, are measured at amortized cost. The carrying amount of these assets is adjusted by any Expected Credit Loss (ECL) allowance recognized |
| ◾ | Fair value through other comprehensive income (‘FVOCI’): Financial assets that are held for collection of contractual cash flows and for selling the assets, where the assets’ cash flows represent solely payments of principal and interest, and that are not designated at FVPL, are measured at FVOCI. |
| ◾ | Fair value through profit or loss (‘FVPL’): Assets that do not meet the criteria for amortized cost or FVOCI are measured mandatorily at fair value through profit or loss |
Equity instruments are instruments that meet the definition of equity from the issuer’s perspective, such as basic ordinary shares. On initial recognition, IFRS 9 allows Aegon to make an irrevocable election to present changes in the fair value of equity investment in OCI or profit or loss. In both cases, the equity instruments are not subject to impairment under expected credit loss model.
|
|
Unaudited | Page 38 of 131 |
Condensed consolidated interim financial information for the period ended June 30, 2023
Financial liabilities are to be classified as subsequently measured at amortized cost, except financial liabilities measured at fair value through profit or loss, financial liabilities arising from the transfer of financial assets which did not qualify for derecognition, and financial guarantee contracts and loan commitments.
Impairment allowance
The IAS 39 impairment methodology was based on an ‘incurred loss’ model, which means that an allowance was determined when an instrument was deemed credit impaired. The allowance for instruments that are credit impaired will generally align with the Stage 3 category of IFRS 9. However, within the expected loss framework of IFRS 9 the entire portfolio of financial instruments will be assigned an impairment allowance through the additions of the 12-month ECL category (stage 1) and the Lifetime ECL Non-credit-impaired (Stage 2), generally leading to increases in the overall allowances.
Hedge accounting
The Group has elected to adopt the new hedge accounting model in IFRS 9. This requires the Group to ensure that hedging relationships are aligned with its risk management objectives and strategy and to apply a more qualitative and forward-looking approach to assessing hedge effectiveness. The Group has elected to continue to apply hedge accounting requirements for macro fair value hedges of IAS 39 on adoption of IFRS 9. As such, fair value hedge accounting for portfolio hedges of interest rate risk (macro hedging) under the EU ‘carve out’ of IFRS is applied.
|
|
Unaudited | Page 39 of 131 |
Condensed consolidated interim financial information for the period ended June 30, 2023
2.2.3.2. IFRS 9 Transition
Any adjustments to the carrying amounts of financial assets and liabilities at the date of transition were recognized in the opening retained earnings and other reserves of the initial recognition period, January 1, 2022.
Classification and Measurement
On transition to IFRS 9, Aegon performed a detailed analysis of its business models for managing financial assets and analysis of their cash flow characteristics. Furthermore some AC and FVOCI financial assets have been designated as FVTPL to reduce the accounting mismatch between assets and liabilities.
The transition to IFRS 9 impacted the classification and measurement of financial assets.
The measurement category and the carrying amount of financial assets and liabilities in accordance with IAS 39 and IFRS 9 at January 1, 2022 and January 1, 2023 are detailed in the table below by type of instrument, together with a reconciliation of the carrying amounts of financial instruments, from their previous measurement category in accordance with IAS 39 to their new measurement categories upon transition:
| IAS 39 | Reclassification | Remeasurement | IFRS 9 | |||||||||||||||||||||||
| January 1, 2023 | Category | Amount | ECL | Other | Category | Amount | ||||||||||||||||||||
| Financial assets: |
||||||||||||||||||||||||||
| Shares |
FVPL | 15,698 | 155 | - | - | FVPL (mandatorily) | 15,853 | |||||||||||||||||||
| Shares |
AFS | 195 | (186 | ) | - | - | FVOCI (designated) | 10 | ||||||||||||||||||
| Debt securities |
AFS | 53,093 | (1,486 | ) | - | - | FVOCI | 51,607 | ||||||||||||||||||
| Debt securities |
FVPL | 6,248 | (5,449 | ) | - | - | FVPL (mandatorily) | 799 | ||||||||||||||||||
| Debt securities |
6,935 | - | - | FVPL (designated) | 6,935 | |||||||||||||||||||||
| Money market and other short-term investments |
AFS | 5,514 | (2,938 | ) | - | - | FVOCI | 2,576 | ||||||||||||||||||
| Money market and other short-term investments |
FVPL | 1,362 | 1,514 | - | - | FVPL (mandatorily) | 2,876 | |||||||||||||||||||
| Money market and other short-term investments |
1,429 | - | - | FVPL (designated) | 1,429 | |||||||||||||||||||||
| Loans |
L&R | 12,511 | (2,095 | ) | (12 | ) | 4 | AC | 10,408 | |||||||||||||||||
| Deposits with financial institutions |
L&R | 45 | - | - | - | AC | 45 | |||||||||||||||||||
| Deposits with financial institutions |
FVPL | 2,360 | - | - | - | FVPL (designated) | 2,360 | |||||||||||||||||||
| Unconsolidated investment funds |
FVPL | 154,741 | - | - | - | FVPL (mandatorily) | 154,741 | |||||||||||||||||||
| Other investments |
FVPL | 3,722 | 866 | - | - | FVPL (mandatorily) | 4,588 | |||||||||||||||||||
| Other investments |
AFS | 840 | (810 | ) | - | - | FVOCI | 31 | ||||||||||||||||||
| IAS 39 / IFRS 9 Investments1 |
256,328 | 254,257 | ||||||||||||||||||||||||
| Cash and cash equivalents |
L&R | 3,407 | (4 | ) | - | - | AC | 3,402 | ||||||||||||||||||
| Other financial assets and receivables2 |
L&R | 9,722 | (1,050 | ) | - | - | AC | 8,671 | ||||||||||||||||||
| Derivatives |
FVPL | 2,760 | 11 | - | - | FVPL (mandatorily) | 2,771 | |||||||||||||||||||
|
Total financial assets |
272,217 | (3,108 | ) | (12 | ) | 4 | 269,102 | |||||||||||||||||||
| Financial liabilities: |
||||||||||||||||||||||||||
| Investment contracts |
AC | 10,485 | (888 | ) | - | - | AC | 9,597 | ||||||||||||||||||
| Investment contracts |
FVPL | 55,254 | 376 | - | - | FVPL (designated) | 55,631 | |||||||||||||||||||
| Investment contracts with discretionary participating features |
65,739 | 65,227 | ||||||||||||||||||||||||
| Long-term borrowings and group loans |
AC | 4,051 | - | - | - | AC | 4,051 | |||||||||||||||||||
| Derivatives |
FVPL | 6,094 | (919 | ) | - | - | FVPL (mandatorily) | 5,175 | ||||||||||||||||||
| Other liabilities |
AC | 10,785 | (507 | ) | - | - | AC | 10,278 | ||||||||||||||||||
|
Total financial liabilities |
86,668 | (1,938 | ) | - | - | 84,730 | ||||||||||||||||||||
1 Investments and other assets include financial assets and non-financial assets as well. Investments under IAS 39 comprises EUR 256,328 million financial assets as detailed in the table and EUR 502 million investments in real estates as at December 31, 2023. Investments under IFRS 9 comprises EUR 254,257 million financial assets as detailed in the table and EUR 502 million investments in real estates as at January 1, 2023.
2 Other assets and receivables under IAS 39 contains EUR 9,722 million other financial assets and receivables and EUR 482 million own used real estates and right of use assets as at December 31, 2022. Other assets and receivables under IFRS 9 contains EUR 8,671 million other financial assets and receivables and EUR 482 million own used real estates and right of use assets as at January 1, 2023.
|
|
Unaudited | Page 40 of 131 |
Condensed consolidated interim financial information for the period ended June 30, 2023
| IAS 39 | Reclassification | Remeasurement | IFRS 9 | |||||||||||||||||||||||
| January 1, 2022 | Category | Amount | ECL | Other | Category | Amount | ||||||||||||||||||||
| Financial assets: |
||||||||||||||||||||||||||
| Shares |
FVPL | 31,203 | 252 | - | - | FVPL (mandatorily) | 31,455 | |||||||||||||||||||
| Shares |
AFS | 350 | (279 | ) | - | - | FVOCI (designated) | 72 | ||||||||||||||||||
| Debt securities |
AFS | 93,899 | (22,925 | ) | - | - | FVOCI | 70,974 | ||||||||||||||||||
| Debt securities |
FVPL | 23,117 | (22,387 | ) | - | - | FVPL (mandatorily) | 730 | ||||||||||||||||||
| Debt securities |
45,312 | - | - | FVPL (designated) | 45,312 | |||||||||||||||||||||
| Money market and other short-term investments |
AFS | 4,790 | (2,289 | ) | - | - | FVOCI | 2,501 | ||||||||||||||||||
| Money market and other short-term investments |
FVPL | 1,602 | 694 | - | - | FVPL (mandatorily) | 2,296 | |||||||||||||||||||
| Money market and other short-term investments |
1,624 | - | - | FVPL (designated) | 1,624 | |||||||||||||||||||||
| Loans |
L&R | 47,402 | (21,971 | ) | (150 | ) | 110 | AC | 25,392 | |||||||||||||||||
| Loans |
20,106 | - | 2,594 | FVPL (designated) | 22,700 | |||||||||||||||||||||
| Deposits with financial institutions |
L&R | 52 | - | - | - | AC | 52 | |||||||||||||||||||
| Deposits with financial institutions |
FVPL | 4,105 | - | - | - | FVPL (designated) | 4,105 | |||||||||||||||||||
| Unconsolidated investment funds |
FVPL | 191,950 | - | - | - | FVPL (mandatorily) | 191,950 | |||||||||||||||||||
| Other investments |
FVPL | 6,893 | (3,321 | ) | - | - | FVPL (mandatorily) | 3,572 | ||||||||||||||||||
| Other investments |
4,092 | - | - | FVPL (designated) | 4,092 | |||||||||||||||||||||
| Other investments |
AFS | 844 | (800 | ) | - | - | FVOCI | 44 | ||||||||||||||||||
| IAS 39 / IFRS 9 Investments1 |
406,210 | 406,871 | ||||||||||||||||||||||||
| Cash and cash equivalents |
L&R | 6,889 | (28 | ) | - | - | AC | 6,861 | ||||||||||||||||||
| Other financial assets and receivables2 |
L&R | 6,988 | (963 | ) | - | - | AC | 6,025 | ||||||||||||||||||
| Derivatives |
FVPL | 8,827 | 16 | - | - | FVPL (mandatorily) | 8,843 | |||||||||||||||||||
|
Total financial assets |
428,913 | (2,868 | ) | (150 | ) | 2,704 | 428,599 | |||||||||||||||||||
| Financial liabilities: |
||||||||||||||||||||||||||
| Investment contracts |
AC | 21,573 | (899 | ) | - | - | AC | 20,674 | ||||||||||||||||||
| Investment contracts |
FVPL | 71,242 | 448 | - | - | FVPL (designated) | 71,690 | |||||||||||||||||||
| Investment contracts with discretionary participating features |
92,815 | 92,364 | ||||||||||||||||||||||||
| Long-term borrowings and group loans |
AC | 9,661 | - | - | - | AC | 9,661 | |||||||||||||||||||
| Derivatives |
FVPL | 10,639 | (3,501 | ) | - | - | FVPL (mandatorily) | 7,138 | ||||||||||||||||||
| Other liabilities |
AC | 12,916 | (1,033 | ) | - | - | AC | 11,883 | ||||||||||||||||||
|
Total financial liabilities |
126,030 | (4,985 | ) | - | - | 121,046 | ||||||||||||||||||||
1 Investments and other assets include financial assets and non-financial assets as well. Investments under IAS 39 comprises EUR 406,210 million financial assets as detailed in the table and EUR 3,206 million investments in real estates as at December 31, 2023. Investments under IFRS 9 comprises EUR 406,871 million financial assets as detailed in the table and EUR 3,206 million investments in real estates as at January 1, 2023.
2 Other assets and receivables under IAS 39 contains EUR 6,988 million other financial assets and receivables and EUR 654 million own used real estates and right of use assets as at December 31, 2022. Other assets and receivables under IFRS 9 contains EUR 6,025 million other financial assets and receivables and EUR 654 million own used real estates and right of use assets as at January 1, 2023.
The reclassification and remeasurement impacts as of January 1, 2023 do not include the Netherlands, which is separately disclosed in note 20. Discontinued operations.
As of January 1, 2023, EUR 3,108 million (January 1, 2022: EUR 2,868 million) has been reclassified out of financial assets, and EUR 1,938 million (January 1, 2022: EUR 4,985 million) has been reclassified out of financial liabilities which moved in scope of IFRS 17 and classified and measured as (re)insurance contracts from January 1, 2022.
Remeasurement impacts included the reversal of impairments of financial assets recognized under IAS 39 in amount of EUR 4 million (January 1, 2022: EUR 110 million) and the recognition of expected credit losses of EUR 12 million (January 1, 2022: EUR 150 million) in line with the impairment requirements of IFRS 9.
On January 1, 2022, an additional remeasurement gain of EUR 2,594 was the result of the designation of loans and receivables in the Netherlands (previously measured at amortized cost) to measurement at fair value through profit or loss. The corresponding difference in measurement on January 1, 2023 is presented in note 20. Discontinued operations.
|
|
Unaudited | Page 41 of 131 |
Condensed consolidated interim financial information for the period ended June 30, 2023
Impairment allowance
The following table reconciles the prior period’s closing impairment allowance measured in accordance with the IAS 39 incurred loss model to the new impairment allowance measured in accordance with the IFRS 9 expected loss model on January 1, 2022, and January 1, 2023.
| Measurement category | Loss allowance under IAS 39 / Provision under IAS 37 |
Reclassifications | Remeasurements | ECL under IFRS 9 | ||||||||||||
| Loans and receivables (IAS 39) to Financial assets at amortized cost (IFRS 9) | (9 | ) | 2 | (4 | ) | (12 | ) | |||||||||
| Available for sale financial instruments (IAS 39) to Financial assets at FVOCI (IFRS 9) | (374 | ) | 187 | (89 | ) | (276 | ) | |||||||||
| Total as at January 1, 2023 |
(383 | ) | 189 | (93 | ) | (287 | ) | |||||||||
| Measurement category | Loss allowance under IAS 39 / Provision under IAS 37 |
Reclassifications | Remeasurements | ECL under IFRS 9 | ||||||||||||
| Loans and receivables (IAS 39) to Financial assets at amortized cost (IFRS 9) | (125 | ) | 6 | (31 | ) | (150 | ) | |||||||||
| Available for sale financial instruments (IAS 39) to Financial assets at FVOCI (IFRS 9) | (376 | ) | 190 | (33 | ) | (219 | ) | |||||||||
| Total as at January 1, 2022 |
(501 | ) | 196 | (63 | ) | (369 | ) | |||||||||
2.3 Judgements and critical accounting estimates
In preparing these consolidated financial statements, Aegon has made judgements, estimates and assumptions that affect the application of the Group’s accounting policies and the reported amount of assets, liabilities, income and expenses. Actual results may differ from these estimates.
Included among the material (or potentially material) reported amounts and disclosures that require extensive use of estimates are the fair value of certain investments and derivatives (please refer to note 11), the measurement of (re)insurance contracts and investment contracts with discretionary participating features (please refer to note 13), and the measurement of the expected credit loss allowance (please refer to note 16).
Estimates and underlying assumptions are reviewed on an ongoing basis. Revisions to estimates are recognized prospectively.
Macro-economic context
When making judgments, estimates and assumptions, Aegon has taken into consideration the current macro-economic context.
In the first half of 2023, the war in the Ukraine continued. The war caused a humanitarian crisis and also impacted global financial markets and caused significant economic turbulence. Aegon closely monitors financial and wider economic developments to understand our exposure to potential shocks in the markets where we invest, and Aegon works proactively to mitigate related risks. The inflation rates for the main economies that Aegon is exposed to increased significantly. Aegon has implemented an inflation hedge covering liabilities with conditional indexation rights in the Netherlands to address the uncertainty around the rise in inflation. In the United States, the inflation risk within long-term care claims derives primarily from wage inflation, which Aegon mitigate by offering customers downgrades of the maximum daily benefit as an alternative to premium rate increases. In addition, Aegon’s expense savings program helps to mitigate the impact of rising inflation. High inflation has prompted central banks to start raising interest rates significantly. As a consequence, interest rates have increased significantly in Aegon’s main markets during 2022, however in the first six months of 2023 interest rates have started to stabilize. Equity markets in Aegon’s three main markets have shown recovery in the first half of 2023 compared to a decline of equity markets in 2022. Credit spreads have not changed significantly over the first half of 2023.
|
|
Unaudited | Page 42 of 131 |
Condensed consolidated interim financial information for the period ended June 30, 2023
2.4 Other
Taxes
Taxes on income for the three and six-month period ended June 30, 2023, are calculated using the tax rate that is estimated to be applicable to earnings for the full year.
Exchange rates
Assets and liabilities of foreign operations are translated to the presentation currency at the closing rates on the reporting date. Income, expenses and capital transactions (such as dividends) are translated at average exchange rates or at the prevailing rates on the transaction date, if more appropriate. The following exchange rates (most relevant rates to Aegon) are applied for the condensed consolidated interim financial statements:
| Closing exchange rates | USD | GBP | ||||||||||
| June 30, 2023 |
1 | EUR | 1.0910 | 0.8581 | ||||||||
| December 31, 2022 |
1 | EUR | 1.0673 | 0.8872 | ||||||||
| Weighted average exchange rates | USD | GBP | ||||||||||
| Six months ended June 30, 2023 |
1 | EUR | 1.0806 | 0.8763 | ||||||||
| Six months ended June 30, 2022 |
1 | EUR | 1.0933 | 0.8425 | ||||||||
3. Segment information
3.1 Change in measurement of performance measure
Aegon uses the non-EU-IFRS performance measure operating result. Similar as under the previous accounting policies, operating result reflects Aegon’s profit before tax from underlying business operations and mainly excludes components that relate to accounting mismatches that are dependent on market volatility, updates to best estimate actuarial and economic assumptions and model updates or events that are considered outside the normal course of business.
There have been changes in the calculation of the items excluded from operating result (fair value items, realized gains or losses on investments, impairment charges/reversals, other income or charges, and share in earnings of joint ventures and associates) due to the adoption of IFRS 9 and IFRS 17. For example:
| ◾ | The Fair Value items have reduced significantly, reflecting fewer accounting mismatches under the new accounting policies. Other components of fair value items remain largely unchanged. |
| ◾ | Realized Gains or Losses on Investments now includes realized gains and losses on financial assets classified as AC and FVOCI. |
| ◾ | Impairment losses and reversals of impairment losses reflect the change in ECL for financial assets, as well as changes in the non-performance risk of reinsurers. |
| ◾ | Other non-operating results continue to include items that cannot be directly allocated to a specific line of business and items that are outside the normal course of business. It no longer includes all impacts of actuarial and economic assumption and model updates, but only: |
| - | The impact of changes in actuarial assumptions and model updates on onerous contracts, and |
| - | The impact of changes in financial assumptions and the passage of time on onerous groups of VFA contracts to which no risk mitigation is applied. |
|
|
Unaudited | Page 43 of 131 |
Condensed consolidated interim financial information for the period ended June 30, 2023
3.2 Segment results
Aegon’s segment information is prepared by consolidating on a proportionate basis Aegon’s joint ventures and associated companies.
| EUR millions | Americas | The Netherlands |
United Kingdom |
International | Asset management |
Holdings and other activities |
Eliminations | Segment total |
Joint ventures and associates eliminations |
Consolidated 1 | ||||||||||||||||||||||||||||||
| Six months ended June 30, 2023 | ||||||||||||||||||||||||||||||||||||||||
| Operating result geographically |
628 | - | 111 | 95 | 74 | (91) | 1 | 818 | (49) | 768 | ||||||||||||||||||||||||||||||
| Fair value items |
79 | - | (40) | (1) | 1 | 1 | (29) | 11 | - | 11 | ||||||||||||||||||||||||||||||
| Realized gains / (losses) on investments | (96) | - | - | 1 | - | - | - | (95) | (3) | (99) | ||||||||||||||||||||||||||||||
| Impairment (losses) / reversals |
(64) | - | - | (25) | - | (7) | - | (96) | - | (96) | ||||||||||||||||||||||||||||||
|
Non-operating items |
(82) | - | (40) | (25) | 1 | (6) | (29) | (180) | (3) | (183) | ||||||||||||||||||||||||||||||
| Other income / (charges) | (574) | (110) | (46) | (110) | (16) | (14) | - | (870) | 17 | (852) | ||||||||||||||||||||||||||||||
| Result before tax |
(28) | (110) | 25 | (40) | 59 | (111) | (28) | (232) | (35) | (267) | ||||||||||||||||||||||||||||||
| Income tax (expense) / benefit | 63 | - | (11) | (24) | (20) | 26 | - | 33 | 35 | 69 | ||||||||||||||||||||||||||||||
| Net result |
35 | (110) | 14 | (64) | 39 | (85) | (28) | (199) | 0 | (199) | ||||||||||||||||||||||||||||||
| Inter-segment operating result |
(280) | (47) | (37) | 138 | 87 | 139 | ||||||||||||||||||||||||||||||||||
| Revenues | ||||||||||||||||||||||||||||||||||||||||
| Insurance contracts revenue | ||||||||||||||||||||||||||||||||||||||||
| • Insurance contracts: direct participation |
4,900 | - | 305 | 601 | - | - | (27) | 5,778 | (752) | 5,026 | ||||||||||||||||||||||||||||||
| • Insurance contracts: without direct participation |
- | - | - | 314 | - | - | - | 314 | - | 314 | ||||||||||||||||||||||||||||||
| Investment contracts with discretionary participation features revenue | ||||||||||||||||||||||||||||||||||||||||
|
• Insurance contracts: direct participation |
- | - | 29 | - | - | - | - | 29 | - | 29 | ||||||||||||||||||||||||||||||
| Insurance revenue |
4,900 | - | 335 | 915 | - | - | (27) | 6,122 | (752) | 5,370 | ||||||||||||||||||||||||||||||
| Interest revenue on financial instruments - effective interest method | 1,576 | - | 21 | 43 | 1 | 24 | (4) | 1,661 | (1) | 1,661 | ||||||||||||||||||||||||||||||
| Interest revenue on financial instruments measured at FVPL | 183 | - | 224 | 1 | - | - | - | 407 | - | 407 | ||||||||||||||||||||||||||||||
| Other investment income |
8 | - | 1,090 | 52 | 7 | 252 | (252) | 1,158 | (59) | 1,099 | ||||||||||||||||||||||||||||||
| Fee and commission income |
821 | - | 106 | 19 | 312 | - | (84) | 1,173 | (113) | 1,061 | ||||||||||||||||||||||||||||||
| Other revenues | - | - | - | 17 | - | - | - | 17 | (17) | - | ||||||||||||||||||||||||||||||
| Total revenues |
7,487 | - | 1,775 | 1,047 | 321 | 276 | (367) | 10,539 | (942) | 9,597 | ||||||||||||||||||||||||||||||
| Inter-segment revenues |
25 | - | - | - | 97 | 253 | - | - | - | - | ||||||||||||||||||||||||||||||
1 The “result before tax from continuing operations” included in the “Condensed consolidated income statement” of EUR (186) million aligns with the segment reporting by deducting the net result of discontinued operations of EUR (82) million from the result before tax of EUR (267) million.
On July 4, 2023, Aegon announced the completion of the combination of its Dutch pension, life and non-life insurance, banking, and mortgage origination activities with a.s.r., and the beginning of its asset management partnership with a.s.r. As part of the transaction, Aegon received EUR 2.2 billion in cash proceeds and a 29.99% stake in a.s.r. The associated EUR 1.5 billion share buyback program has commenced and is expected to be completed on or before June 30, 2024. In light of the transaction, Aegon the Netherlands is no longer reported as a separate segment, and its first half 2023 result is included in Other income in the income statement.
|
|
Unaudited | Page 44 of 131 |
Condensed consolidated interim financial information for the period ended June 30, 2023
| EUR millions | Americas | The Netherlands |
United Kingdom |
International | Asset management |
Holdings and other activities |
Eliminations | Segment total |
Joint ventures and associates eliminations |
Consolidated1 | ||||||||||||||||||||||||||||||
| Six months ended June 30, 2022 | ||||||||||||||||||||||||||||||||||||||||
| Operating result geographically |
605 | - | 93 | 87 | 117 | (107) | - | 796 | (53) | 743 | ||||||||||||||||||||||||||||||
| Fair value items |
106 | - | 8 | 18 | (3) | (7) | (35) | 88 | 6 | 93 | ||||||||||||||||||||||||||||||
| Realized gains / (losses) on investments | (140) | - | - | (3) | - | 8 | - | (135) | (1) | (137) | ||||||||||||||||||||||||||||||
| Impairment (losses) / reversals |
(46) | - | (8) | (12) | - | (18) | - | (84) | 0 | (84) | ||||||||||||||||||||||||||||||
|
Non-operating items |
(80) | - | 1 | 3 | (3) | (17) | (35) | (132) | 5 | (127) | ||||||||||||||||||||||||||||||
| Other income / (charges) | (129) | (576) | (31) | 242 | (20) | (37) | - | (550) | 9 | (541) | ||||||||||||||||||||||||||||||
| Result before tax |
397 | (576) | 63 | 332 | 94 | (160) | (35) | 114 | (39) | 75 | ||||||||||||||||||||||||||||||
| Income tax (expense) / benefit | (55) | 0 | 13 | (24) | (38) | 35 | - | (68) | 39 | (29) | ||||||||||||||||||||||||||||||
| Net result |
342 | (576) | 76 | 308 | 56 | (125) | (35) | 46 | - | 46 | ||||||||||||||||||||||||||||||
| Inter-segment operating result |
(181) | (48) | (38) | 39 | 95 | 134 | - | - | - | - | ||||||||||||||||||||||||||||||
| Revenues | ||||||||||||||||||||||||||||||||||||||||
| Insurance contracts revenue | ||||||||||||||||||||||||||||||||||||||||
| • Insurance contracts: direct participation |
4,948 | - | 315 | 503 | - | - | (11) | 5,755 | (441) | 5,314 | ||||||||||||||||||||||||||||||
| • Insurance contracts: without direct participation |
- | - | - | 329 | - | - | - | 329 | (180) | 148 | ||||||||||||||||||||||||||||||
| Investment contracts with discretionary participation features revenue | ||||||||||||||||||||||||||||||||||||||||
|
• Insurance contracts: direct participation |
- | - | 43 | - | - | - | - | 43 | - | 43 | ||||||||||||||||||||||||||||||
| Insurance revenue |
4,948 | - | 357 | 832 | - | - | (11) | 6,127 | (621) | 5,506 | ||||||||||||||||||||||||||||||
| Interest revenue on financial instruments - effective interest method | 1,427 | - | 3 | 144 | - | (3) | (3) | 1,569 | (2) | 1,567 | ||||||||||||||||||||||||||||||
| Interest revenue on financial instruments measured at FVPL | 78 | - | 189 | (4) | - | - | - | 263 | - | 263 | ||||||||||||||||||||||||||||||
| Other investment income |
12 | - | 1,046 | 39 | 6 | 241 | (241) | 1,103 | (45) | 1,058 | ||||||||||||||||||||||||||||||
| Fee and commission income |
861 | - | 107 | 36 | 363 | - | (93) | 1,273 | (140) | 1,133 | ||||||||||||||||||||||||||||||
| Other revenues | - | - | - | 12 | 4 | 0 | - | 16 | (16) | 0 | ||||||||||||||||||||||||||||||
| Total revenues |
7,326 | - | 1,702 | 1,059 | 374 | 238 | (348) | 10,350 | (824) | 9,527 | ||||||||||||||||||||||||||||||
| Inter-segment revenues |
11 | (9) | - | 0 | 104 | 241 | - | - | - | - | ||||||||||||||||||||||||||||||
1The “result before tax from continuing operations” included in the “Condensed consolidated income statement” of EUR 608 million aligns with the segment reporting by deducting the result of discontinued operations of EUR (533) million from the result before tax of EUR 75 million.
|
|
Unaudited | Page 45 of 131 |
Condensed consolidated interim financial information for the period ended June 30, 2023
3.3 Investments
Amounts included in the table below are presented on an EU-IFRS basis, which means that investments in joint ventures and associates are not consolidated on a proportionate basis. Instead, these investments are included on a single line using the equity method of accounting.
| EUR millions | Americas | The Netherlands |
United Kingdom |
International | Asset Management |
Holding and other activities |
Eliminations | Total | ||||||||||||||||||||||||
| June 30, 2023 |
||||||||||||||||||||||||||||||||
| Investments |
||||||||||||||||||||||||||||||||
| Shares |
264 | - | 16,146 | 22 | 8 | 1 | - | 16,441 | ||||||||||||||||||||||||
| Debt securities |
50,164 | - | 6,693 | 1,382 | 69 | - | - | 58,308 | ||||||||||||||||||||||||
| Unconsolidated investment funds |
92,387 | - | 71,019 | 187 | - | - | - | 163,592 | ||||||||||||||||||||||||
| Loans |
10,249 | - | 2,239 | 3 | - | 38 | - | 12,529 | ||||||||||||||||||||||||
| Other financial assets |
8,747 | - | 2,049 | 423 | 89 | - | - | 11,307 | ||||||||||||||||||||||||
| Investments in real estate | 40 | - | 446 | 17 | - | - | - | 504 | ||||||||||||||||||||||||
| Investments on balance sheet |
161,850 | - | 98,593 | 2,034 | 166 | 39 | - | 262,682 | ||||||||||||||||||||||||
| Off balance sheet investments third parties | 224,113 | - | 132,391 | 3,526 | 139,204 | - | - | 499,234 | ||||||||||||||||||||||||
| Total revenue generating investments | 385,964 | - | 230,983 | 5,561 | 139,369 | 39 | - | 761,916 | ||||||||||||||||||||||||
| Investments |
||||||||||||||||||||||||||||||||
| Financial assets measured at FVOCI |
||||||||||||||||||||||||||||||||
| • Backing insurance contracts without direct participation |
45,383 | - | - | 1,786 | - | - | - | 47,169 | ||||||||||||||||||||||||
| • Backing investment contracts without direct participation |
6,041 | - | - | - | - | - | - | 6,041 | ||||||||||||||||||||||||
|
• Non-insurance related assets |
- | - | - | 1 | 70 | - | - | 71 | ||||||||||||||||||||||||
| Financial assets measured at FVPL |
||||||||||||||||||||||||||||||||
| • Backing direct participation insurance contracts |
67,852 | - | 39,083 | 160 | - | - | - | 107,095 | ||||||||||||||||||||||||
| • Backing insurance contracts without direct participation |
7,274 | - | 1,125 | 23 | - | - | - | 8,423 | ||||||||||||||||||||||||
| • Backing direct participation investment contracts |
24,534 | - | 22,612 | - | - | - | - | 47,147 | ||||||||||||||||||||||||
| • Backing investment contracts without direct participation |
388 | - | - | 46 | - | - | - | 433 | ||||||||||||||||||||||||
|
• Non-insurance related assets |
89 | - | 35,326 | - | 44 | 1 | - | 35,459 | ||||||||||||||||||||||||
| Financial assets measured at amortized cost |
10,249 | - | - | 1 | 52 | 38 | - | 10,340 | ||||||||||||||||||||||||
| Investments in real estate | 40 | - | 446 | 17 | - | - | - | 504 | ||||||||||||||||||||||||
| Total investments on balance sheet | 161,850 | - | 98,593 | 2,034 | 166 | 39 | - | 262,682 | ||||||||||||||||||||||||
| Investments in joint ventures |
- | - | - | 973 | 440 | - | - | 1,413 | ||||||||||||||||||||||||
| Investments in associates |
- | - | - | 6 | 270 | 4 | - | 280 | ||||||||||||||||||||||||
| Assets held for sale |
- | 88,542 | - | - | - | - | - | 88,542 | ||||||||||||||||||||||||
| Other assets | 24,092 | 113 | 2,612 | 6,511 | 369 | 14,936 | (18,287) | 30,346 | ||||||||||||||||||||||||
| Consolidated total assets | 185,943 | 88,655 | 101,205 | 9,524 | 1,244 | 14,978 | (18,287) | 383,263 | ||||||||||||||||||||||||
|
|
Unaudited | Page 46 of 131 |
Condensed consolidated interim financial information for the period ended June 30, 2023
| EUR millions | Americas | The Netherlands |
United Kingdom |
International | Asset Management |
Holding and other activities |
Eliminations | Total | ||||||||||||||||||||||||
| December 31, 2022 |
||||||||||||||||||||||||||||||||
| Investments |
||||||||||||||||||||||||||||||||
| Shares |
315 | - | 15,518 | 21 | 7 | 1 | - | 15,863 | ||||||||||||||||||||||||
| Debt securities |
51,008 | - | 6,455 | 1,864 | 15 | - | - | 59,341 | ||||||||||||||||||||||||
| Unconsolidated investment funds |
89,535 | - | 64,776 | 431 | - | - | - | 154,741 | ||||||||||||||||||||||||
| Loans |
10,406 | - | 2,354 | 14 | - | 38 | - | 12,812 | ||||||||||||||||||||||||
| Other financial assets |
9,318 | - | 1,917 | 150 | 114 | - | - | 11,500 | ||||||||||||||||||||||||
| Investments in real estate | 42 | - | 443 | 17 | - | - | - | 502 | ||||||||||||||||||||||||
| Investments on balance sheet |
160,624 | - | 91,463 | 2,497 | 136 | 39 | - | 254,759 | ||||||||||||||||||||||||
| Off balance sheet investments third parties | 216,060 | - | 122,742 | 3,384 | 141,067 | - | 483,253 | |||||||||||||||||||||||||
| Total revenue generating investments | 376,684 | - | 214,205 | 5,881 | 141,203 | 39 | - | 738,013 | ||||||||||||||||||||||||
| Investments |
||||||||||||||||||||||||||||||||
| Financial assets measured at FVOCI |
||||||||||||||||||||||||||||||||
| • Backing insurance contracts without direct part. |
46,665 | - | - | 1,900 | - | - | - | 48,565 | ||||||||||||||||||||||||
| • Backing investment contracts without direct participation |
5,482 | - | - | - | - | - | - | 5,482 | ||||||||||||||||||||||||
|
• Non-insurance related assets |
- | - | - | 81 | 96 | - | - | 177 | ||||||||||||||||||||||||
| Financial assets measured at FVPL |
||||||||||||||||||||||||||||||||
| • Backing direct participation insurance contracts |
66,344 | - | 36,843 | 140 | - | - | - | 103,327 | ||||||||||||||||||||||||
| • Backing insurance contracts without direct participation |
8,164 | - | 1,083 | 305 | - | - | - | 9,552 | ||||||||||||||||||||||||
| • Backing direct participation investment contracts |
23,191 | - | 22,262 | - | - | - | - | 45,453 | ||||||||||||||||||||||||
| • Backing investment contracts without direct participation |
285 | - | - | 47 | - | - | - | 331 | ||||||||||||||||||||||||
|
• Non-insurance related assets |
46 | - | 30,832 | - | 40 | 1 | - | 30,918 | ||||||||||||||||||||||||
| Financial assets measured at amortized cost |
10,406 | - | - | 9 | - | 38 | - | 10,453 | ||||||||||||||||||||||||
| Investments in real estate | 42 | - | 443 | 17 | - | - | - | 502 | ||||||||||||||||||||||||
| Total investments on balance sheet | 160,624 | - | 91,463 | 2,497 | 136 | 39 | - | 254,759 | ||||||||||||||||||||||||
| Investments in joint ventures |
- | - | - | 959 | 471 | - | - | 1,430 | ||||||||||||||||||||||||
| Investments in associates |
- | 11 | - | 20 | 129 | 16 | (11) | 165 | ||||||||||||||||||||||||
| Assets held for sale |
- | 88,440 | - | - | - | - | - | 88,440 | ||||||||||||||||||||||||
| Other assets | 27,399 | 1,076 | 2,544 | 6,726 | 513 | 18,094 | (20,658) | 35,693 | ||||||||||||||||||||||||
| Consolidated total assets | 188,023 | 89,527 | 94,007 | 10,201 | 1,249 | 18,148 | (20,669) | 380,487 | ||||||||||||||||||||||||
|
|
Unaudited | Page 47 of 131 |
Condensed consolidated interim financial information for the period ended June 30, 2023
3.4 Insurance, reinsurance and investment contracts with discretionary participation features
| United | ||||||||||||||||||||
| EUR millions |
Americas | Kingdom | International | Eliminations | Total | |||||||||||||||
| June 30, 2023 |
||||||||||||||||||||
| Insurance contracts1 |
137,229 | 39,307 | 7,072 | - | 177,641 | |||||||||||||||
| Direct participating contracts |
70,500 | 38,377 | 208 | - | 109,085 | |||||||||||||||
| Without direct participating features |
66,729 | 930 | 6,813 | (5,966 | ) | 68,506 | ||||||||||||||
| Contracts measured under the PAA |
- | - | 50 | - | 50 | |||||||||||||||
| Investment contracts with DPF |
||||||||||||||||||||
| Direct participating contracts |
- | 21,533 | - | - | 21,533 | |||||||||||||||
| Insurance contracts and investment contracts with DPF |
137,229 | 60,840 | 7,072 | (5,966 | ) | 199,175 | ||||||||||||||
| Reinsurance contracts held2 |
16,041 | 340 | 5,852 | (5,976 | ) | 16,256 | ||||||||||||||
1 Total insurance contracts is EUR 177,641 million which comprises of EUR 53 million Insurance contract assets and EUR 177,695 million Insurance contract liabilities.
2 Total reinsurance contracts is EUR 16,256 million which comprises of EUR 16,467 million Reinsurance contract assets and EUR 211 million reinsurance contract liabilities.
| United | ||||||||||||||||||||
| EUR millions |
Americas | Kingdom | International | Eliminations | Total | |||||||||||||||
| December 31, 2022 |
||||||||||||||||||||
| Insurance contracts |
137,159 | 37,621 | 7,570 | (6,266 | ) | 176,083 | ||||||||||||||
| Direct participating contracts |
69,163 | 36,694 | 187 | - | 106,044 | |||||||||||||||
| Without direct participating features |
67,996 | 927 | 6,944 | (6,266 | ) | 69,600 | ||||||||||||||
| Contracts measured under the PAA |
- | - | 439 | - | 439 | |||||||||||||||
| Investment contracts with DPF |
||||||||||||||||||||
| Direct participating contracts |
- | 21,055 | - | - | 21,055 | |||||||||||||||
| Insurance contracts and investment contracts with DPF |
137,159 | 58,676 | 7,570 | (6,266 | ) | 197,139 | ||||||||||||||
| Reinsurance contracts held2 |
16,458 | 369 | 6,065 | (6,223 | ) | 16,669 | ||||||||||||||
1 Total insurance contracts is EUR 176,083 million which comprises of EUR 36 million Insurance contract assets and EUR 176,120 million Insurance contract liabilities
2 Total reinsurance contracts is EUR 16,669 million which comprises of EUR 16,939 million Reinsurance contract assets and EUR 270 million reinsurance contract liabilities.
|
|
Unaudited | Page 48 of 131 |
Condensed consolidated interim financial information for the period ended June 30, 2023
4. Insurance service result
|
|
| |||||||||||||||
| 1H 2023 | 1H 2022 | |||||||||||||||
| Investment | ||||||||||||||||
| Insurance | contracts with | Insurance | Investment | |||||||||||||
| EUR millions |
contracts | DPF | contracts | contracts with DPF | ||||||||||||
| Insurance revenue |
||||||||||||||||
| Expected insurance claims and other insurance service expenses to be incurred |
4,352 | 16 | 4,473 | 28 | ||||||||||||
| Earnings released from contractual service margin |
480 | 6 | 469 | 7 | ||||||||||||
| Release of risk adjustment for non-financial risk |
198 | 7 | 143 | 8 | ||||||||||||
| Allocated portion of consideration that relates to recovery acquisition costs |
272 | - | 260 | - | ||||||||||||
| Other |
(38) | - | (11) | - | ||||||||||||
| Contracts not measured under the PAA |
5,263 | 29 | 5,333 | 43 | ||||||||||||
| Contracts measured under the PAA |
77 | - | 129 | - | ||||||||||||
| Total insurance revenue |
5,340 | 29 | 5,463 | 43 | ||||||||||||
| Insurance service expenses |
||||||||||||||||
| Incurred claims and other incurred insurance service expenses |
(4,218) | (14) | (4,561) | (34) | ||||||||||||
| Changes in fulfillment cash flows relating to incurred claims |
(13) | - | (1) | - | ||||||||||||
| Onerous contract losses (and reversals) |
(635) | - | (362) | (2) | ||||||||||||
| Amortization of insurance acquisition costs |
(272) | - | (260) | - | ||||||||||||
| Contracts not measured under the PAA |
(5,138) | (14) | (5,183) | (36) | ||||||||||||
| Contracts measured under the PAA |
(83) | - | (125) | - | ||||||||||||
| Total insurance service expenses |
(5,221) | (14) | (5,308) | (36) | ||||||||||||
| Net expenses on reinsurance held |
||||||||||||||||
| Assumption changes that relate to (a reversal of) underlying onerous contracts |
33 | - | (12) | - | ||||||||||||
| Experience adjustments that relate to (a reversal of) underlying onerous contracts |
425 | - | 26 | - | ||||||||||||
| Release of the contractual service margin for services received |
(7) | - | 27 | - | ||||||||||||
| Release of risk adjustment for non-financial risk |
(73) | - | (61) | - | ||||||||||||
| Experience adjustments on current service |
(200) | - | (120) | - | ||||||||||||
| Changes in fulfillment cash flows relating to incurred claims |
5 | - | (2) | - | ||||||||||||
| New contracts issued/acquired: loss on initial recognition of underlying contracts |
(6) | - | 19 | - | ||||||||||||
| Establishing of loss recovery component from onerous underlying contracts |
7 | - | 2 | - | ||||||||||||
| Reversals of a loss-recovery component other than changes in the FCF of reinsurance contracts held |
(1) | - | - | - | ||||||||||||
| Contracts not measured under the PAA |
184 | - | (121) | - | ||||||||||||
| Contracts measured under the PAA |
1 | - | 1 | - | ||||||||||||
| Total net expenses on reinsurance held |
185 | - | (120) | - | ||||||||||||
| Insurance service result |
304 | 15 | 35 | 7 | ||||||||||||
The following table shows the revenue recognized on insurance and investments contracts with discretionary participating features by transition method. Other contracts comprise contracts transitioned under the full retrospective approach and contracts issued after the transition to IFRS 17.
|
EUR millions |
1H 2023 | 1H 2022 | ||||||
| Insurance contracts |
||||||||
| Related to contracts transitioned under the modified retrospective method |
260 | 281 | ||||||
| Related to contracts transitioned under the fair value approach |
4,524 | 4,623 | ||||||
| Other contracts |
556 | 558 | ||||||
| Total revenue reported in the period |
5,340 | 5,463 | ||||||
| Investment contracts with discretionary participating features |
||||||||
| Related to contracts transitioned under the fair value approach |
29 | 43 | ||||||
| Total revenue reported in the period |
29 | 43 | ||||||
| Total revenue reported in the period – all contracts |
5,370 | 5,506 | ||||||
|
|
Unaudited | Page 49 of 131 |
Condensed consolidated interim financial information for the period ended June 30, 2023
5. Total net investment result
| 1H | 1H | |||||||
| EUR millions |
2023 | 2022 | ||||||
| Insurance net investment result |
(32) | 612 | ||||||
| Other net investment result |
107 | (65) | ||||||
| Financing net investment result |
(90) | (99) | ||||||
| Total net investment result |
(15) | 449 | ||||||
| 1H 2023 | ||||||||||||||||||||
| Insurance net investment result |
Insurance contracts | Investment contracts with DPF | ||||||||||||||||||
| EUR millions |
Direct Part. | |
Without direct part. |
|
Direct Part. | |
Without direct part. |
|
|
Total |
| |||||||||
| Insurance investment return |
||||||||||||||||||||
| Interest revenue on financial instruments calculated using the effective interest method |
- | 1,396 | - | - | 1,396 | |||||||||||||||
| Interest revenue on financial instruments measured at FVPL |
134 | 199 | 48 | - | 382 | |||||||||||||||
| Other investment income |
532 | 7 | 242 | - | 781 | |||||||||||||||
| Results from financial transactions |
6,144 | (55) | 378 | - | 6,467 | |||||||||||||||
| Impairment losses / (reversals) |
- | (80) | - | - | (80) | |||||||||||||||
| Interest expenses |
- | (114) | - | - | (114) | |||||||||||||||
| P&L impacts |
6,810 | 1,353 | 668 | - | 8,832 | |||||||||||||||
| Gains / (losses) on investments in equity instruments designated at FVOCI |
- | 0 | - | - | 0 | |||||||||||||||
| Gains / (losses) on financial assets measured at FVOCI |
- | 567 | - | - | 567 | |||||||||||||||
| Gains / (losses) transferred to income statement on disposal of financial assets measured at FVOCI |
- | 100 | - | - | 100 | |||||||||||||||
| OCI impacts |
- | 667 | - | - | 667 | |||||||||||||||
| Total insurance investment return |
6,810 | 2,021 | 668 | - | 9,500 | |||||||||||||||
| Insurance finance income / (expenses) – General model |
||||||||||||||||||||
| Interest accreted to insurance contracts |
- | (1,564) | - | - | (1,564) | |||||||||||||||
| Changes in interest rates and other financial assumptions |
- | (687) | - | - | (687) | |||||||||||||||
| Revaluation of changes in non-financial assumptions and experience adjustments to current interest rates |
- | (476) | - | - | (476) | |||||||||||||||
| Insurance finance income / (expenses) – Variable fee approach |
||||||||||||||||||||
| Change in fair value of underlying assets of products with direct participating features |
(7,470) | - | (676) | - | (8,147) | |||||||||||||||
| Change in fulfilment value not recognized in CSM due to risk mitigation option |
780 | - | - | - | 780 | |||||||||||||||
| Insurance finance income / (expenses) – Premium allocation approach |
||||||||||||||||||||
| Insurance finance expenses from PAA contracts |
- | (12) | - | - | (12) | |||||||||||||||
| Total insurance finance income / (expenses) |
(6,691) | (2,739) | (676) | - | (10,106) | |||||||||||||||
| Represented by: |
||||||||||||||||||||
| Amounts recognized in profit or loss |
(6,692) | (1,877) | (676) | - | (9,246) | |||||||||||||||
| Amounts recognized in OCI |
2 | (862) | - | - | (860) | |||||||||||||||
| Reinsurance finance income / (expenses) on reinsurance held |
||||||||||||||||||||
| Interest accreted to reinsurance contracts |
- | 319 | - | - | 319 | |||||||||||||||
| Changes in interest rates and other financial assumptions |
- | 91 | - | - | 91 | |||||||||||||||
| Revaluation of changes in non-financial assumptions and experience adjustments to current interest rates |
- | 157 | - | - | 157 | |||||||||||||||
| Changes in risk of non-performance of reinsurers |
- | (5) | - | - | (5) | |||||||||||||||
| Reinsurance finance income / (expenses) on reinsurance held |
- | 563 | - | - | 563 | |||||||||||||||
| Represented by: |
||||||||||||||||||||
| Amounts recognized in profit or loss |
- | 382 | - | - | 382 | |||||||||||||||
| Amounts recognized in OCI |
- | 181 | - | - | 181 | |||||||||||||||
| Insurance net investment result |
120 | (155) | (8) | - | (43) | |||||||||||||||
| Represented by: |
||||||||||||||||||||
| Amounts recognized in profit or loss |
118 | (142) | (8) | - | (32) | |||||||||||||||
| Amounts recognized in OCI |
2 | (14) | - | - | (12) | |||||||||||||||
|
|
Unaudited | Page 50 of 131 |
Condensed consolidated interim financial information for the period ended June 30, 2023
|
|
||||||||||||||||||||
| 1H 2022 | ||||||||||||||||||||
| Insurance net investment result |
Insurance contracts | Investment contracts with DPF | ||||||||||||||||||
| EUR millions |
Direct Part. | |
Without direct part. |
|
Direct Part. | |
Without direct part. |
|
Total | |||||||||||
| Insurance investment return |
||||||||||||||||||||
| Interest revenue on financial instruments calculated using the effective interest method |
- | 1,392 | - | - | 1,392 | |||||||||||||||
| Interest revenue on financial instruments measured at FVPL |
148 | 37 | 59 | - | 244 | |||||||||||||||
| Other investment income |
443 | 12 | 271 | - | 725 | |||||||||||||||
| Results from financial transactions |
(22,685) | (363) | (3,807) | - | (26,855) | |||||||||||||||
| Impairment losses / (reversals) |
- | (47) | - | - | (47) | |||||||||||||||
| Interest expenses |
- | (14) | - | - | (14) | |||||||||||||||
| P&L impacts |
(22,094) | 1,017 | (3,478) | - | (24,555) | |||||||||||||||
| Gains / (losses) on financial assets measured at FVOCI |
- | (1) | - | - | (1) | |||||||||||||||
| Gains / (losses) transferred to income statement on disposal of financial assets measured at FVOCI |
- | (11,235) | - | - | (11,235) | |||||||||||||||
| Gains / (losses) transferred to income statement on disposal of financial assets measured at FVOCI |
- | 158 | - | - | 158 | |||||||||||||||
| OCI impacts |
- | (11,077) | - | - | (11,077) | |||||||||||||||
| Total insurance investment return |
(22,094) | (10,060) | (3,478) | - | (35,632) | |||||||||||||||
| Insurance finance income / (expenses) – General model |
||||||||||||||||||||
| Interest accreted to insurance contracts |
- | (1,428) | - | - | (1,428) | |||||||||||||||
| Changes in interest rates and other financial assumptions |
- | 14,172 | - | - | 14,172 | |||||||||||||||
| Revaluation of changes in non-financial assumptions and experience adjustments to current interest rates |
- | 678 | - | - | 678 | |||||||||||||||
| Insurance finance income / (expenses) – Variable fee approach |
||||||||||||||||||||
| Change in fair value of underlying assets of products with direct participating features |
20,768 | - | 3500 | - | 24,268 | |||||||||||||||
| Change in fulfilment value not recognized in CSM due to risk mitigation option |
1,459 | - | - | - | 1,459 | |||||||||||||||
| Insurance finance income / (expenses) – Premium allocation approach |
||||||||||||||||||||
| Insurance finance expenses from PAA contracts |
- | 1 | - | - | 1 | |||||||||||||||
| Total insurance finance income / (expenses) |
22,227 | 13,423 | 3,500 | - | 39,150 | |||||||||||||||
| Represented by: |
||||||||||||||||||||
| Amounts recognized in profit or loss |
22,248 | (790) | 3,500 | - | 24,957 | |||||||||||||||
| Amounts recognized in OCI |
(21) | 14,214 | - | - | 14,193 | |||||||||||||||
| Reinsurance finance income / (expenses) on reinsurance held |
||||||||||||||||||||
| Interest accreted to reinsurance contracts |
- | 329 | - | - | 329 | |||||||||||||||
| Changes in interest rates and other financial assumptions |
- | (3,284) | - | - | (3,284) | |||||||||||||||
| Revaluation of changes in non-financial assumptions and experience adjustments to current interest rates |
- | (194) | - | - | (194) | |||||||||||||||
| Changes in risk of non-performance of reinsurers |
- | (4) | - | - | (4) | |||||||||||||||
| Reinsurance finance income / (expenses) on reinsurance held |
- | (3,153) | - | - | (3,153) | |||||||||||||||
| Represented by: |
||||||||||||||||||||
| Amounts recognized in profit or loss |
- | 210 | - | - | 210 | |||||||||||||||
| Amounts recognized in OCI |
- | (3,362) | - | - | (3,362) | |||||||||||||||
| Insurance net investment result |
133 | 210 | 22 | - | 365 | |||||||||||||||
| Represented by: |
||||||||||||||||||||
| Amounts recognized in profit or loss |
153 | 436 | 22 | - | 612 | |||||||||||||||
| Amounts recognized in OCI |
(21) | (226) | - | - | (247) | |||||||||||||||
|
|
Unaudited | Page 51 of 131 |
Condensed consolidated interim financial information for the period ended June 30, 2023
| EUR millions | 1H 2023 | 1H 2022 | ||||||||||||||
| Insurance | Non-insurance | Insurance | Non- | |||||||||||||
| related | related | related | insurance | |||||||||||||
| related | ||||||||||||||||
| Fair value gains and losses derivatives |
(806) | 2 | (2,168) | (47) | ||||||||||||
| Fair value changes of financial assets at FVPL |
7,400 | 3,213 | (24,597) | (11,005) | ||||||||||||
| Other |
(127) | (3) | (91) | (66) | ||||||||||||
| Results from financial transactions |
6,467 | 3,212 | (26,855) | (11,119) | ||||||||||||
The main driver of increase in fair value changes of FVPL financial assets is that equity markets in Aegon’s three main markets have shown recovery in the first half of 2023 compared to the decline of equity markets in 1H 2022.
| EUR millions | 1H 2023 | 1H 2022 | ||||||
| Insurance related | ||||||||
| General model |
(1,865) | (788) | ||||||
| Variable fee approach |
(7,369) | 25,748 | ||||||
| Premium allocation approach |
(12) | (2) | ||||||
| Insurance finance income / (expenses) |
(9,246) | 24,957 | ||||||
| EUR millions | 1H 2023 | 1H 2022 | ||||||
| Non-insurance related | ||||||||
| Fair value changes in financial liabilities - policyholders |
(2,255) | 6,123 | ||||||
| Fair value changes in other financial liabilities |
(1,403) | 4,447 | ||||||
| Other |
3 | (4) | ||||||
| Investment contract income / (expenses) |
(3,654) | 10,566 | ||||||
6. Fee and commission income
| EUR millions | ||||||||
| 1H 2023 | 1H 2022 | |||||||
| Fee income from asset management |
963 | 1,039 | ||||||
| Commission income |
10 | 12 | ||||||
| Securities lending income |
0 | 0 | ||||||
| Other fee and commission income |
84 | 71 | ||||||
| Fee and commission income |
1,057 | 1,122 | ||||||
|
|
Unaudited | Page 52 of 131 |
Condensed consolidated interim financial information for the period ended June 30, 2023
7. Other operating expenses
| EUR millions | 1H 2023 | 1H 2022 | ||||||||||||||
| Insurance related | Non- insurance related |
Insurance related |
Non- insurance related |
|||||||||||||
| Policyholder claims and benefits |
3,466 | 0 | 3,775 | 0 | ||||||||||||
| Onerous contract losses (and reversals) |
636 | - | 367 | - | ||||||||||||
| Commissions |
748 | 636 | 787 | 468 | ||||||||||||
| Handling and clearing fees |
(1) | 17 | 1 | 16 | ||||||||||||
| Right of use assets – interest expense |
0 | 3 | 0 | 3 | ||||||||||||
| Employee expenses |
289 | 536 | 302 | 538 | ||||||||||||
| Administration expenses |
289 | 394 | 269 | 327 | ||||||||||||
| Deferred transaction expenses |
- | (13) | - | (15) | ||||||||||||
| Amortization of deferred expenses |
- | 10 | - | 14 | ||||||||||||
| Amortization of future servicing rights |
- | 3 | - | 5 | ||||||||||||
|
Total |
5,427 | 1,587 | 5,501 | 1,358 | ||||||||||||
| Amounts attributed to insurance acquisition cash flows |
(474) | - | (429) | - | ||||||||||||
| Amortization of insurance acquisition cash flows |
10 | - | 12 | - | ||||||||||||
| Amortization of insurance acquisition cash flows PAA |
272 | - | 260 | - | ||||||||||||
| Total commissions and expenses |
5,235 | 1,587 | 5,344 | 1,358 | ||||||||||||
8. Other income and charges
Other income and charges decreased significantly in the first half of 2023 compared to the previous period driven by the book loss of EUR 78 million on the divestment of Aegon’s businesses in Poland and Romania, as recorded in Aegon’s 2023 results. For further information, please refer to note 19 Companies and businesses acquired and divested. Furthermore, Aegon recorded a book gain of EUR 239 million in the first half year of 2022 on the divestment of Aegon Hungary and Aegon Turkey.
9. Income Tax
The income tax includes recurring beneficial impacts such as the dividend received deduction and tax credits in the United States. Non-taxable income for the half year period ended, June 30, 2023 is mainly related to tax exempt result in the Netherlands on the sale of the Poland/Romania business, as well as the regular non-taxable items such as the dividend received deduction in the United States. Tax credits mainly include tax benefits in the United States from investments that provide affordable housing to individuals and families that meet median household income requirement.
|
|
Unaudited | Page 53 of 131 |
Condensed consolidated interim financial information for the period ended June 30, 2023
10. Investments
| Insurance related | ||||||||||||||||||||||||
| Insurance contracts
|
Investment contracts with DPF
|
June 30, 2023
|
||||||||||||||||||||||
| EUR millions | Direct Part. | Without direct part. |
Direct Part. | Without direct part. |
Non-Insurance related |
Total | ||||||||||||||||||
| Financial assets measured at FVOCI – with recycling |
- | 47,160 | - | 6,041 | 70 | 53,272 | ||||||||||||||||||
| Financial assets measured at FVOCI – no recycling |
- | 8 | - | - | 1 | 9 | ||||||||||||||||||
| Financial assets measured at amortized cost |
- | 8,043 | - | 2,207 | 90 | 10,340 | ||||||||||||||||||
| Financial assets measured at FVPL – designated |
107,095 | 1,700 | 47,147 | 46 | 35,341 | 191,329 | ||||||||||||||||||
| Financial assets measured at FVPL – mandatory |
- | 6,723 | - | 388 | 118 | 7,228 | ||||||||||||||||||
| Total financial assets, excluding derivatives |
107,095 | 63,634 | 47,147 | 8,682 | 35,620 | 262,178 | ||||||||||||||||||
| Investments in real estate |
241 | 58 | 159 | - | 47 | 504 | ||||||||||||||||||
| Total investments |
107,336 | 63,692 | 47,306 | 8,682 | 35,667 | 262,682 | ||||||||||||||||||
| Insurance related | ||||||||||||||||||||||||
| Insurance contracts | Investment contracts with DPF | December 31, | ||||||||||||||||||||||
| 2022 | ||||||||||||||||||||||||
| EUR millions | Direct Part. | Without direct part. |
Direct Part. | Without direct part. |
Non-Insurance related |
Total | ||||||||||||||||||
| Financial assets measured at FVOCI – with recycling |
- | 48,556 | - | 5,482 | 176 | 54,214 | ||||||||||||||||||
| Financial assets measured at FVOCI – no recycling |
- | 9 | - | - | 1 | 10 | ||||||||||||||||||
| Financial assets measured at amortized cost |
- | 8,254 | - | 2,159 | 39 | 10,453 | ||||||||||||||||||
| Financial assets measured at FVPL – designated |
103,327 | 1,833 | 45,453 | 47 | 30,843 | 181,503 | ||||||||||||||||||
| Financial assets measured at FVPL – mandatory |
- | 7,719 | - | 285 | 75 | 8,079 | ||||||||||||||||||
| Total financial assets, excluding derivatives |
103,327 | 66,371 | 45,453 | 7,972 | 31,134 | 254,257 | ||||||||||||||||||
| Investments in real estate |
236 | 59 | 168 | - | 40 | 502 | ||||||||||||||||||
| Total investments |
103,562 | 66,430 | 45,620 | 7,972 | 31,174 | 254,759 | ||||||||||||||||||
Financial assets excluding derivatives
| EUR millions | ||||||||
| Financial assets | June 30, 2023 | December 31, 2022 | ||||||
| where Aegon bears the risk |
73,023 | 74,694 | ||||||
| where policyholders bear the risk |
189,154 | 179,563 | ||||||
|
Total |
262,178 | 254,257 | ||||||
Financial assets, where Aegon bears the risk, excluding derivatives
| FVOCI | FVOCI | Amortized | FVPL | FVPL | ||||||||||||||||||||||||
| EUR millions | (with recycling) | (no recycling) | cost | (designated) | (mandatory) | Total | Fair value | |||||||||||||||||||||
| Shares |
- | 9 | - | - | 297 | 306 | 306 | |||||||||||||||||||||
| Debt securities |
50,083 | - | 52 | 1,359 | 918 | 52,411 | 52,360 | |||||||||||||||||||||
| Money market and other short-term investments |
3,162 | - | - | 124 | 1,866 | 5,152 | 5,152 | |||||||||||||||||||||
| Deposits with financial institutions |
- | - | 38 | - | - | 38 | 38 | |||||||||||||||||||||
| Mortgage loans |
- | - | 10,249 | - | - | 10,249 | 9,080 | |||||||||||||||||||||
| Other |
28 | - | 1 | 691 | 4,147 | 4,867 | 4,867 | |||||||||||||||||||||
| June 30, 2023 |
53,272 | 9 | 10,340 | 2,175 | 7,228 | 73,023 | 71,802 | |||||||||||||||||||||
|
|
Unaudited | Page 54 of 131 |
Condensed consolidated interim financial information for the period ended June 30, 2023
| FVOCI | FVOCI | Amortized | FVPL | FVPL | ||||||||||||||||||||||||
| EUR millions | (with recycling) | (no recycling) | cost | (designated) | (mandatory) | Total | Fair value | |||||||||||||||||||||
| Shares |
- | 10 | - | - | 348 | 358 | 358 | |||||||||||||||||||||
| Debt securities |
51,607 | - | - | 1,241 | 799 | 53,647 | 53,647 | |||||||||||||||||||||
| Money market and other short-term investments |
2,576 | - | - | 167 | 2,876 | 5,618 | 5,618 | |||||||||||||||||||||
| Deposits with financial institutions |
- | - | 45 | - | - | 45 | 45 | |||||||||||||||||||||
| Mortgage loans |
- | - | 10,407 | - | - | 10,407 | 9,218 | |||||||||||||||||||||
| Other |
31 | - | 1 | 532 | 4,056 | 4,619 | 4,619 | |||||||||||||||||||||
| December 31, 2022 |
54,214 | 10 | 10,453 | 1,940 | 8,079 | 74,694 | 73,506 | |||||||||||||||||||||
Financial assets where policyholders bear the risk, excluding derivatives
| EUR millions | June 30, 2023 | December 31, 2022 | ||||||
| Shares |
16,135 | 15,505 | ||||||
| Debt securities |
5,897 | 5,694 | ||||||
| Money market and other short-term investments |
1,290 | 1,263 | ||||||
| Unconsolidated investment funds |
163,592 | 154,741 | ||||||
| Deposits with financial institutions |
2,241 | 2,360 | ||||||
|
Total |
189,154 | 179,563 | ||||||
|
|
Unaudited | Page 55 of 131 |
Condensed consolidated interim financial information for the period ended June 30, 2023
11. Fair value
The following tables provide an analysis of financial instruments recorded at fair value on a recurring basis by level of the fair value hierarchy.
|
|
||||||||||||||||
| June 30, 2023 | ||||||||||||||||
| EUR millions | Level I | Level II | Level III | Total | ||||||||||||
| Financial assets carried at fair value |
||||||||||||||||
| Financial assets measured at FVOCI |
||||||||||||||||
| Shares |
5 | - | 4 | 9 | ||||||||||||
| Debt securities |
6,078 | 43,747 | 258 | 50,083 | ||||||||||||
| Money markets and other short-term instruments |
3,017 | 134 | 10 | 3,162 | ||||||||||||
| Other investments at fair value |
- | 28 | - | 28 | ||||||||||||
| Total Financial assets measured at FVOCI |
9,100 | 43,909 | 273 | 53,281 | ||||||||||||
| Financial assets measured at fair value through profit or loss |
||||||||||||||||
| Shares |
154 | 58 | 85 | 297 | ||||||||||||
| Debt securities |
289 | 1,944 | 44 | 2,277 | ||||||||||||
| Money market and other short-term investments |
1,894 | 96 | - | 1,990 | ||||||||||||
| Other investments at fair value |
1 | 692 | 4,146 | 4,838 | ||||||||||||
| Derivatives |
46 | 751 | 8 | 805 | ||||||||||||
| Investments where the policyholder bears the risk |
90,333 | 98,443 | 379 | 189,154 | ||||||||||||
| Total Financial assets measured at fair value through profit or loss |
92,717 | 101,983 | 4,662 | 199,362 | ||||||||||||
| Total financial assets at measured at fair value |
101,816 | 145,892 | 4,934 | 252,643 | ||||||||||||
| Financial liabilities carried at fair value |
||||||||||||||||
| Investment contracts without DPF where the policyholder bears the risk |
- | 61,847 | - | 61,847 | ||||||||||||
|
Derivatives |
51 | 2,900 | 6 | 2,957 | ||||||||||||
| Total financial liabilities measured at fair value |
51 | 64,747 | 6 | 64,804 | ||||||||||||
|
|
||||||||||||||||
| December 31, 2022 | ||||||||||||||||
| EUR millions | Level I | Level II | Level III | Total | ||||||||||||
| Financial assets carried at fair value |
||||||||||||||||
| Financial assets measured at FVOCI |
||||||||||||||||
| Shares |
5 | - | 4 | 10 | ||||||||||||
| Debt securities |
6,353 | 45,073 | 181 | 51,607 | ||||||||||||
| Money markets and other short-term instruments |
1,597 | 973 | 5 | 2,576 | ||||||||||||
| Other investments at fair value |
- | 31 | - | 31 | ||||||||||||
| Total Financial assets measured at FVOCI |
7,956 | 46,077 | 191 | 54,223 | ||||||||||||
| Financial assets measured at fair value through profit or loss |
||||||||||||||||
| Shares |
160 | 61 | 127 | 348 | ||||||||||||
| Debt securities |
282 | 1,722 | 35 | 2,040 | ||||||||||||
| Money market and other short-term investments |
2,084 | 957 | 1 | 3,042 | ||||||||||||
| Other investments at fair value |
1 | 537 | 4,050 | 4,588 | ||||||||||||
| Derivatives |
33 | 2,727 | 11 | 2,771 | ||||||||||||
| Investments where the policyholder bears the risk |
87,362 | 91,799 | 402 | 179,563 | ||||||||||||
| Total Financial assets measured at fair value through profit or loss |
89,922 | 97,804 | 4,626 | 192,352 | ||||||||||||
| Total financial assets at measured at fair value |
97,878 | 143,881 | 4,816 | 246,575 | ||||||||||||
| Financial liabilities carried at fair value |
||||||||||||||||
| Investment contracts without DPF where the policyholder bears the risk |
- | 55,631 | - | 55,631 | ||||||||||||
|
Derivatives |
51 | 5,136 | 12 | 5,199 | ||||||||||||
| Total financial liabilities measured at fair value |
51 | 60,767 | 12 | 60,830 | ||||||||||||
|
|
Unaudited | Page 56 of 131 |
Condensed consolidated interim financial information for the period ended June 30, 2023
Significant transfers between Level I, Level II and Level III
There have been no significant transfers between Level I, II and III for financial assets and financial liabilities recorded at fair value on a recurring basis during the six-month period ended June 30, 2023.
Movements in Level III financial instruments measured at fair value
The following table summarizes the change of all assets and liabilities measured at estimated fair value on a recurring basis using significant unobservable inputs (Level III), including realized and unrealized gains (losses) of all assets and liabilities and unrealized gains (losses) of all assets and liabilities still held at the end of the respective period.
|
|
||||||||||||||||||||||||||||||||||||||||||||
| Total | ||||||||||||||||||||||||||||||||||||||||||||
| unrealized | ||||||||||||||||||||||||||||||||||||||||||||
| gains and | ||||||||||||||||||||||||||||||||||||||||||||
| losses for the | ||||||||||||||||||||||||||||||||||||||||||||
| period | ||||||||||||||||||||||||||||||||||||||||||||
| Transfers | recorded in | |||||||||||||||||||||||||||||||||||||||||||
| Total gains | Total | Transfers | to | the P&L for | ||||||||||||||||||||||||||||||||||||||||
| / losses in | gains / | Net | from Level | Level I | June | instruments | ||||||||||||||||||||||||||||||||||||||
| January 1, | income | losses | exchange | I and Level | and | 30, | held at June | |||||||||||||||||||||||||||||||||||||
| EUR millions | 2023 | statement | in OCI | Purchases | Sales | Settlements | differences | II | Level II | 2023 | 30, 2023 | |||||||||||||||||||||||||||||||||
| Financial assets measured at fair value through other comprehensive income | ||||||||||||||||||||||||||||||||||||||||||||
| Shares |
4 | - | - | - | - | - | - | - | - | 4 | - | |||||||||||||||||||||||||||||||||
| Debt securities |
181 | - | 13 | 41 | (56) | (7) | (4) | 93 | (1) | 258 | - | |||||||||||||||||||||||||||||||||
| Money markets and other short-term instruments |
5 | - | 5 | - | - | - | - | - | - | 10 | - | |||||||||||||||||||||||||||||||||
| 191 | - | 18 | 41 | (56) | (7) | (4) | 93 | (1) | 273 | - | ||||||||||||||||||||||||||||||||||
| Financial assets measured at fair value through profit or loss | ||||||||||||||||||||||||||||||||||||||||||||
| Shares |
127 | 1 | - | - | (41) | - | (2) | - | - | 85 | 2 | |||||||||||||||||||||||||||||||||
| Debt securities |
35 | 8 | - | - | (5) | (2) | (1) | 8 | - | 44 | 6 | |||||||||||||||||||||||||||||||||
| Money markets and other short-term instruments |
1 | - | - | - | - | - | (0) | - | (1) | - | - | |||||||||||||||||||||||||||||||||
| Other investments at fair value |
4,050 | 31 | (57) | 332 | (121) | - | (90) | - | - | 4,146 | (22) | |||||||||||||||||||||||||||||||||
| Derivatives |
11 | (2) | - | - | (1) | - | - | - | - | 8 | (2) | |||||||||||||||||||||||||||||||||
| Investments where the policyholder bears the risk |
402 | (25) | - | 27 | (27) | - | 2 | - | - | 379 | (9) | |||||||||||||||||||||||||||||||||
| 4,626 | 14 | (57) | 360 | (195) | (2) | (91) | 9 | (2) | 4,662 | (26) | ||||||||||||||||||||||||||||||||||
| Total assets at fair value |
4,816 | 14 | (39) | 401 | (251) | (9) | (95) | 101 | (3) | 4,934 | (26) | |||||||||||||||||||||||||||||||||
| Financial liabilities carried at fair value |
||||||||||||||||||||||||||||||||||||||||||||
|
Derivatives |
12 | (6) | - | - | - | - | - | - | - | 6 | - | |||||||||||||||||||||||||||||||||
| Total financial liabilities measured at fair value |
12 | (6) | - | - | - | - | - | - | - | 6 | - | |||||||||||||||||||||||||||||||||
|
|
Unaudited | Page 57 of 131 |
Condensed consolidated interim financial information for the period ended June 30, 2023
|
|
||||||||||||||||||||||||||||||||||||||||||||
| Total | ||||||||||||||||||||||||||||||||||||||||||||
| unrealized | ||||||||||||||||||||||||||||||||||||||||||||
| gains and | ||||||||||||||||||||||||||||||||||||||||||||
| losses for the | ||||||||||||||||||||||||||||||||||||||||||||
| period | ||||||||||||||||||||||||||||||||||||||||||||
| recorded in | ||||||||||||||||||||||||||||||||||||||||||||
| Transfers | the P&L for | |||||||||||||||||||||||||||||||||||||||||||
| Total gains | Total | Transfers | to | instruments | ||||||||||||||||||||||||||||||||||||||||
| / losses in | gains / | Net | from Level | Level I | December | held at | ||||||||||||||||||||||||||||||||||||||
| January 1, | income | losses | exchange | I and Level | and | 31, | December 31, | |||||||||||||||||||||||||||||||||||||
| EUR millions | 2022 | statement | in OCI | Purchases | Sales | Settlements | differences | II | Level II | 2022 | 2022 | |||||||||||||||||||||||||||||||||
| Financial assets measured at fair value through other comprehensive income | ||||||||||||||||||||||||||||||||||||||||||||
| Shares |
4 | - | - | - | - | - | - | - | - | 4 | - | |||||||||||||||||||||||||||||||||
| Debt securities |
365 | (1) | (73) | 98 | (47) | (16) | 23 | 37 | (207) | 181 | - | |||||||||||||||||||||||||||||||||
| Money markets and other short-term instruments |
28 | - | (23) | - | - | - | - | - | - | 5 | - | |||||||||||||||||||||||||||||||||
| 398 | (1) | (95) | 98 | (47) | (16) | 23 | 37 | (207) | 191 | - | ||||||||||||||||||||||||||||||||||
| Financial assets measured at fair value through profit or loss | ||||||||||||||||||||||||||||||||||||||||||||
| Shares |
166 | (38) | - | 1 | (14) | - | 12 | - | - | 127 | (38) | |||||||||||||||||||||||||||||||||
| Debt securities |
45 | (11) | - | 1 | - | (5) | 3 | 2 | - | 35 | (9) | |||||||||||||||||||||||||||||||||
| Money markets and other short-term instruments | - | 1 | - | - | - | - | - | - | - | 1 | 1 | |||||||||||||||||||||||||||||||||
| Other investments at fair value |
3,548 | 247 | - | 627 | (587) | (14) | 229 | - | - | 4,050 | (1) | |||||||||||||||||||||||||||||||||
| Derivatives |
1 | 10 | - | - | - | - | - | - | - | 11 | 2 | |||||||||||||||||||||||||||||||||
| Investments where the policyholder bears the risk | 323 | 105 | - | 94 | (106) | - | (14) | - | - | 402 | (32) | |||||||||||||||||||||||||||||||||
| 4,083 | 314 | - | 724 | (708) | (19) | 229 | 2 | - | 4,626 | (77) | ||||||||||||||||||||||||||||||||||
| Total assets at fair value |
4,481 | 313 | (95) | 822 | (755) | (34) | 252 | 40 | (207) | 4.816 | (77) | |||||||||||||||||||||||||||||||||
| Financial liabilities carried at fair value | ||||||||||||||||||||||||||||||||||||||||||||
| Investment contracts without DPF where the policyholder bears the risk | - | - | - | - | - | - | - | - | - | - | - | |||||||||||||||||||||||||||||||||
| Derivatives | 39 | (29) | - | - | - | - | 3 | - | - | 12 | - | |||||||||||||||||||||||||||||||||
| Total financial liabilities measured at fair value | 39 | (29) | - | - | - | - | 3 | - | - | 12 | - | |||||||||||||||||||||||||||||||||
The following table presents the carrying values and estimated fair values of financial assets and liabilities, excluding financial instruments which are carried at fair value on a recurring basis.
|
|
||||||||
| Carrying | Total estimated | |||||||
| amount | fair value | |||||||
| EUR millions | June 30, 2023 | |||||||
| Assets |
||||||||
| Mortgage loans – held at amortized cost |
10,249 | 9,080 | ||||||
| Other loans – held at amortized cost |
90 | 90 | ||||||
| Liabilities |
||||||||
| Subordinated borrowings – held at amortized cost |
2,262 | 2,122 | ||||||
| Trust pass-through securities – held at amortized cost |
113 | 130 | ||||||
| Borrowings – held at amortized cost |
3,020 | 3,058 | ||||||
| Investment contracts – held at amortized cost |
10,113 | 8,868 | ||||||
|
|
Unaudited | Page 58 of 131 |
Condensed consolidated interim financial information for the period ended June 30, 2023
|
|
||||||||
| Carrying | Total estimated | |||||||
| amount | fair value | |||||||
| EUR millions | December 31, 2022 | |||||||
| Assets |
||||||||
| Mortgage loans – held at amortized cost |
10,407 | 9,218 | ||||||
| Other loans – held at amortized cost |
46 | 46 | ||||||
| Liabilities |
||||||||
| Subordinated borrowings – held at amortized cost |
2,295 | 2,035 | ||||||
| Trust pass-through securities – held at amortized cost |
118 | 133 | ||||||
| Borrowings – held at amortized cost |
4,051 | 4,114 | ||||||
| Investment contracts – held at amortized cost |
9,597 | 8,416 | ||||||
Financial instruments for which carrying value approximates fair value
Certain financial instruments that are not carried at fair value are carried at amounts that approximate fair value, due to their short-term nature and generally negligible credit risk. These instruments include cash and cash equivalents, short-term receivables and accrued interest receivable, short-term liabilities, and accrued liabilities. These instruments are not included in the table above.
12. Shareholders’ equity
12.1 Share capital
|
|
||||||||
| EUR millions | June 30, 2023 | December 31, 2022 | ||||||
| Share capital – par value |
319 | 319 | ||||||
| Share premium |
6,853 | 6,853 | ||||||
|
Total share capital |
7,172 | 7,172 | ||||||
| Share capital – par value |
||||||||
| Balance at January 1 |
319 | 321 | ||||||
|
Dividend |
- | 2 | ||||||
|
Shares withdrawn |
- | (4) | ||||||
|
Balance |
319 | 319 | ||||||
|
|
||||||||
| Share premium |
||||||||
| Balance at January 1 |
6,853 | 7,033 | ||||||
| Share dividend |
- | (180) | ||||||
|
Balance |
6,853 | 6,853 | ||||||
|
|
Unaudited | Page 59 of 131 |
Condensed consolidated interim financial information for the period ended June 30, 2023
Earnings per share
| EUR millions | 1H 2023 |
1H 2022 |
||||||
| Earnings per share (EUR per share) |
||||||||
| Basic earnings per common share |
(0.12) | (0.01) | ||||||
| Basic earnings per common share B |
- | - | ||||||
| Diluted earnings per common share |
(0.12) | (0.01) | ||||||
| Diluted earnings per common share B |
- | - | ||||||
| Earnings per share calculation |
||||||||
| Net result attributable to owners of Aegon N.V. |
(201) | 0 | ||||||
| Coupons on other equity instruments |
(24) | (16) | ||||||
| Earnings attributable to common shares and common shares B |
(225) | (15) | ||||||
| Earnings attributable to common shareholders |
(224) | (15) | ||||||
| Earnings attributable to common shareholders B |
(1) | (0) | ||||||
| Weighted average number of common shares outstanding (in millions) |
1,935 | 2,021 | ||||||
| Weighted average number of common shares B outstanding (in millions) |
494 | 538 | ||||||
Final dividend 2022
At the Annual General Meeting of Shareholders on May 25, 2023 it was decided to pay a final dividend over 2022 of EUR 0.12 per common share and EUR 0.003 per common share B. After taking into account the interim dividend of EUR 0.11 per common share and EUR 0.00275 per common share B, this resulted in a total 2022 dividend of EUR 0.23 per common share and EUR 0.00575 per common share B. Aegon’s shares were quoted ex-dividend on the New York Stock Exchange on May 26, 2023 and on Euronext Amsterdam on May 29, 2023. The record date for the dividend was May 30, 2023, and the dividend was paid on June 29, 2023.
2023 interim dividend
Aegon will pay a 2023 interim dividend of EUR 0.14 per common share and EUR 0.0035 per common share B. Aegon has moved to a cash-only dividend. Aegon’s shares will be quoted ex-dividend on August 29, 2023. The record date for the dividend will be August 30, 2023, and the dividend will be payable as of September 27, 2023.
Share buyback
On June 2, 2023, Aegon completed its share buyback program, as announced on February 9, 2023, aimed at returning EUR 200 million of surplus cash capital to shareholders. Between February 10, 2023 and June 2, 2023, a total of 46,797,567 common shares were repurchased at an average price of EUR 4.2737 per share.
|
|
Unaudited | Page 60 of 131 |
Condensed consolidated interim financial information for the period ended June 30, 2023
12.2 Revaluation reserves
| EUR millions | ||||||||||||||||||||||||
| Investments measured at fair value through OCI |
Real estate held for own use |
Cash flow hedging reserve |
Insurance contracts |
Reinsurance contracts held |
Total | |||||||||||||||||||
| At January 1, 2023 | (5,251) | 15 | 1,024 | 2,110 | (2,544) | (4,646) | ||||||||||||||||||
| Gross revaluation | 672 | 1 | 16 | (860) | 181 | 10 | ||||||||||||||||||
| Net (gains) / losses transferred to income statement | 103 | - | (58) | - | - | 45 | ||||||||||||||||||
| Foreign currency translation differences | 106 | (0) | (22) | (37) | 54 | 101 | ||||||||||||||||||
| Tax effect | (166) | (0) | 9 | 224 | (79) | (13) | ||||||||||||||||||
| Disposal of group assets | 19 | - | - | - | - | 19 | ||||||||||||||||||
| At June 30, 2023 | (4,516) | 15 | 968 | 1,436 | (2,388) | (4,484) | ||||||||||||||||||
| EUR millions | ||||||||||||||||||||||||
| Investments measured at fair value through OCI |
Real estate held for own use |
Cash flow hedging reserve |
Insurance contracts |
Reinsurance contracts held |
Total | |||||||||||||||||||
| At January 1, 2022 | 6,810 | 32 | 1,100 | (11,291) | 768 | (2,580) | ||||||||||||||||||
| Gross revaluation | (16,743) | (17) | (66) | 18,543 | (4,643) | (2,926) | ||||||||||||||||||
| Net (gains) / losses transferred to income statement | 541 | - | (126) | - | - | 415 | ||||||||||||||||||
| Foreign currency translation differences | 588 | (0) | 74 | (930) | 95 | (173) | ||||||||||||||||||
| Tax effect | 3,499 | 0 | 42 | (4,182) | 1,237 | 597 | ||||||||||||||||||
| Disposal of group assets | 46 | - | - | (31) | - | 14 | ||||||||||||||||||
| Other | 7 | - | - | - | - | 7 | ||||||||||||||||||
| At December 31, 2022 | (5,251) | 15 | 1,024 | 2,110 | (2,544) | (4,646) | ||||||||||||||||||
The revaluation accounts for both investments measured at FVOCI and for real estate held for own use include unrealized gains and losses on these investments, net of tax. Upon sale, the amounts realized are recognized in the income statement (for FVOCI investments with recycling and insurance contracts without direct participating features) or transferred to retained earnings (for real estate held for own use). Upon impairment, unrealized losses are recognized in the income statement.
The closing balances of the revaluation reserve for investments measured at FVOCI relate to the following instruments:
| EUR millions | June 30, 2023 | December 31, 2022 | ||||||
| Shares | 2 | 2 | ||||||
| Debt securities | (4,511) | (5,249) | ||||||
| Other | (8) | (5) | ||||||
| Revaluation reserve for investments measured at FVOCI | (4,516) | (5,251) | ||||||
|
|
Unaudited | Page 61 of 131 |
Condensed consolidated interim financial information for the period ended June 30, 2023
13. Insurance contracts, reinsurance contracts held and investment contracts with discretionary participating features
13.1 Contracts by measurement model
The following tables show the assets and liabilities for groups of insurance contracts issued and reinsurance contracts held by measurement model.
| Insurance contracts
EUR millions |
Contracts not measured under the PAA |
Contracts measured under |
Total | |||||||
| Portfolios in an asset position |
53 | - | 53 | |||||||
| Portfolios in a liability position |
177,645 | 50 | 177,695 | |||||||
| Net closing balance at June 30, 2023 |
177,592 | 50 | 177,642 | |||||||
| Portfolios in an asset position |
36 | - | 36 | |||||||
| Portfolios in a liability position |
175,681 | 439 | 176,120 | |||||||
| Net ending balance at December 31, 2022 |
175,645 | 439 | 176,083 | |||||||
| Reinsurance contracts held
EUR millions |
Contracts not measured under the PAA |
Contracts under the PAA |
Total | |||||||
| Portfolios in an asset position |
16,460 | 7 | 16,467 | |||||||
| Portfolios in a liability position |
(211) | - | (211) | |||||||
| Net closing balance, at June 30, 2023 |
16,249 | 7 | 16,256 | |||||||
| Portfolios in an asset position |
16,934 | 6 | 16,939 | |||||||
| Portfolios in a liability position |
(270) | - | (270) | |||||||
| Net ending balance, at December 31, 2022 |
16,664 | 6 | 16,669 | |||||||
All groups of investment contracts with discretionary participating features were not measured under PAA and were in a liability position at the reporting and comparative dates.
13.2 Movements in carrying amounts on insurance contracts, investment contracts with discretionary participation features and reinsurance contracts held
The following tables show the movement in the net carrying amounts of insurance contracts issued, investment contracts with discretionary participating features issued and reinsurance contracts held. Two types of tables are presented:
| ◾ | Tables that analyze movements by type of liabilities and reconciles them to the condensed income statement and the condensed statement of comprehensive income |
| ◾ | Tables that analyze movements by measurement component |
|
|
Unaudited | Page 62 of 131 |
Condensed consolidated interim financial information for the period ended June 30, 2023
13.2.1 Movement schedules by type of liability
| Insurance contracts – not measured at PAA | ||||||||||||||||
| Remaining coverage | ||||||||||||||||
| Excluding loss component |
Loss component |
Incurred claims |
Total |
|||||||||||||
| EUR millions | ||||||||||||||||
| Opening assets |
40 | (1) | (2) | 36 | ||||||||||||
| Opening liabilities |
163,637 | 1,455 | 10,589 | 175,681 | ||||||||||||
| Net opening balance at January 1, 2023 |
163,598 | 1,456 | 10,591 | 175,645 | ||||||||||||
| Insurance revenue |
(5,263) | - | - | (5,263) | ||||||||||||
| Incurred claims and other insurance service expenses |
- | (72) | 4,295 | 4,224 | ||||||||||||
| Amortization of insurance acquisition cash flows |
275 | - | - | 275 | ||||||||||||
| Losses (and reversal of losses) on onerous contracts |
- | 635 | - | 635 | ||||||||||||
| Adjustments to liabilities for incurred claims |
- | - | 4 | 4 | ||||||||||||
| Insurance service expenses |
275 | 564 | 4,299 | 5,138 | ||||||||||||
|
Investment components |
(2,125) | - | 2,125 | - | ||||||||||||
| Insurance service result |
(7,113) | 563 | 6,424 | (125) | ||||||||||||
| Insurance finance income / (expenses) (P&L and OCI) |
9,395 | 23 | - | 9,418 | ||||||||||||
| Cash flows |
(2,651) | (63) | (2,275) | (4,989) | ||||||||||||
| Contracts disposed during the period |
(228) | - | - | (228) | ||||||||||||
| Other movements |
(20) | - | - | (20) | ||||||||||||
| Transfer (to)/from other headings |
(375) | (1) | - | (377) | ||||||||||||
|
Net exchange differences |
(1,444) | (25) | (262) | (1,731) | ||||||||||||
| Net closing balance at June 30, 2023 |
161,162 | 1,952 | 14,478 | 177,592 | ||||||||||||
| Closing assets |
1,400 | (960) | (386) | 53 | ||||||||||||
| Closing liabilities |
162,561 | 992 | 14,092 | 177,645 | ||||||||||||
|
|
Unaudited | Page 63 of 131 |
Condensed consolidated interim financial information for the period ended June 30, 2023
| Insurance contracts – not measured at PAA | ||||||||||||||||
| Remaining coverage | ||||||||||||||||
| Excluding loss component |
Loss component |
Incurred claims |
Total |
|||||||||||||
| EUR millions | ||||||||||||||||
| Opening assets |
780 | - | (669) | 110 | ||||||||||||
| Opening liabilities |
286,352 | 343 | 1,407 | 288,102 | ||||||||||||
| Net opening balance at January 1, 2022 |
285,572 | 343 | 2,076 | 287,991 | ||||||||||||
| Insurance revenue |
(13,644) | - | - | (13,644) | ||||||||||||
| Incurred claims and other insurance service expenses |
- | (51) | 11,495 | 11,444 | ||||||||||||
| Amortization of insurance acquisition cash flows |
547 | - | - | 547 | ||||||||||||
| Losses (and reversal of losses) on onerous contracts |
- | 1,335 | - | 1,335 | ||||||||||||
| Adjustments to liabilities for incurred claims |
- | - | 8 | 8 | ||||||||||||
| Insurance service expenses |
547 | 1,284 | 11,503 | 13,335 | ||||||||||||
|
Investment components |
(4,820) | (50) | 4,870 | - | ||||||||||||
| Insurance service result |
(17,917) | 1,234 | 16,374 | (309) | ||||||||||||
| Insurance finance income / (expenses) (P&L and OCI) |
(57,191) | (49) | - | (57,240) | ||||||||||||
| Cash flows |
(4,031) | (33) | (7,866) | (11,930) | ||||||||||||
| Contracts disposed during the period |
(278) | - | - | (278) | ||||||||||||
| Transfers to disposal groups |
(51,983) | (54) | - | (52,037) | ||||||||||||
| Other movements |
(28) | 33 | - | 5 | ||||||||||||
|
Net exchange differences |
9,454 | (19) | 7 | 9,442 | ||||||||||||
| Net closing balance at December 31, 2022 |
163,598 | 1,456 | 10,591 | 175,645 | ||||||||||||
| Closing assets |
40 | (1) | (2) | 36 | ||||||||||||
| Closing liabilities |
163,637 | 1,455 | 10,589 | 175,681 | ||||||||||||
| Insurance contracts – measured at PAA | ||||||||||||||||||||
| Asset for remaining coverage | Asset for Incurred claims | |||||||||||||||||||
| EUR millions | Excluding loss recovery component |
Loss component |
Best estimate liability |
Risk adjustment |
Total | |||||||||||||||
| Opening assets |
- | - | - | - | - | |||||||||||||||
| Opening liabilities |
404 | 2 | 33 | - | 439 | |||||||||||||||
| Net opening balance at January 1, 2023 |
404 | 2 | 33 | - | 439 | |||||||||||||||
| Insurance revenue |
(77) | - | - | - | (77) | |||||||||||||||
| Incurred claims and other insurance service expenses |
- | - | 63 | - | 63 | |||||||||||||||
| Amortization of insurance acquisition cash flows |
10 | - | - | - | 10 | |||||||||||||||
| Losses (and reversals of losses) on onerous contracts |
- | 3 | - | - | 3 | |||||||||||||||
| Adjustments to liabilities for incurred claims |
- | - | 7 | - | 7 | |||||||||||||||
| Insurance service expenses |
10 | 3 | 70 | - | 83 | |||||||||||||||
| Insurance service result |
(67) | 3 | 70 | - | 6 | |||||||||||||||
| Insurance finance income / (expenses) (P&L and OCI) |
12 | - | - | - | 12 | |||||||||||||||
| Cash flows |
64 | - | (72) | - | (9) | |||||||||||||||
| Disposal of a business |
(402) | - | - | - | (402) | |||||||||||||||
| Net exchange differences |
4 | - | - | - | 4 | |||||||||||||||
|
Net closing balance at June 30, 2023 |
15 | 5 | 31 | - | 50 | |||||||||||||||
| Closing assets |
- | - | - | - | - | |||||||||||||||
|
Closing liabilities |
15 | 5 | 31 | - | 50 | |||||||||||||||
|
|
Unaudited | Page 64 of 131 |
Condensed consolidated interim financial information for the period ended June 30, 2023
| Insurance contracts – measured at PAA | ||||||||||||||||||||
| Asset for remaining coverage | Asset for Incurred claims | |||||||||||||||||||
| EUR millions | Excluding loss recovery component |
Loss component |
Best estimate liability |
Risk adjustment |
Total | |||||||||||||||
| Opening assets |
- | - | - | - | - | |||||||||||||||
|
Opening liabilities |
1,242 | - | 712 | 10 | 1,964 | |||||||||||||||
|
Net opening balance at January 1, 2022 |
1,242 | - | 712 | 10 | 1,964 | |||||||||||||||
| Insurance revenue |
(563) | - | - | - | (563) | |||||||||||||||
| Incurred claims and other insurance service expenses |
- | - | 254 | - | 253 | |||||||||||||||
| Amortization of insurance acquisition cash flows |
22 | - | - | - | 22 | |||||||||||||||
| Losses (and reversals of losses) on onerous contracts |
- | 2 | - | - | 2 | |||||||||||||||
| Adjustments to liabilities for incurred claims |
- | - | 259 | (3) | 257 | |||||||||||||||
| Insurance service expenses |
22 | 2 | 513 | (3) | 534 | |||||||||||||||
| Insurance service result |
(542) | 2 | 513 | (3) | (29) | |||||||||||||||
| Insurance finance income / (expenses) (P&L and OCI) |
7 | - | (110) | - | (103) | |||||||||||||||
| Cash flows |
515 | - | (470) | - | 45 | |||||||||||||||
| Disposal of a business |
(729) | - | (75) | - | (804) | |||||||||||||||
| Transfer to disposal groups |
(15) | - | (532) | (7) | (554) | |||||||||||||||
| Net exchange differences |
(75) | - | (5) | - | (80) | |||||||||||||||
|
Net closing balance at December 31, 2022 |
404 | 2 | 33 | - | 439 | |||||||||||||||
| Closing assets |
- | - | - | - | - | |||||||||||||||
|
Closing liabilities |
404 | 2 | 33 | - | 439 | |||||||||||||||
| Reinsurance contracts held – not measured at PAA | ||||||||||||||||
| Asset for remaining coverage | ||||||||||||||||
| EUR millions | Excluding loss recovery component |
Loss recovery component |
Asset for Incurred claims | Total | ||||||||||||
| Opening assets |
14,801 | 1,607 | 526 | 16,934 | ||||||||||||
|
Opening liabilities |
(217) | (57) | 5 | (270) | ||||||||||||
|
Net opening balance at January 1, 2023 |
14,584 | 1,549 | 530 | 16,664 | ||||||||||||
| Net expenses from reinsurance contracts |
597 | (302) | (112) | 184 | ||||||||||||
| Other reinsurance finance income / (expenses) |
540 | 27 | - | 567 | ||||||||||||
| Investment components |
(15) | - | 15 | - | ||||||||||||
| Effect of changes in risk of non-performance of reinsurers |
(5) | - | - | (5) | ||||||||||||
| Total changes in the statements of P&L and OCI |
1,118 | (275) | (96) | 747 | ||||||||||||
| Cash flows |
(775) | (66) | 22 | (820) | ||||||||||||
|
Net exchange differences |
(315) | (21) | (6) | (342) | ||||||||||||
|
Net closing balance at June 30, 2023 |
14,611 | 1,188 | 450 | 16,249 | ||||||||||||
| Closing assets |
16,197 | 253 | 11 | 16,460 | ||||||||||||
|
Closing liabilities |
(1,586) | 935 | 439 | (211) | ||||||||||||
|
|
Unaudited | Page 65 of 131 |
Condensed consolidated interim financial information for the period ended June 30, 2023
| Reinsurance contracts held – not measured at PAA | ||||||||||||||||
| Asset for remaining coverage | ||||||||||||||||
| EUR millions | Excluding loss recovery component |
Loss recovery component |
Asset for Incurred claims | Total | ||||||||||||
| Opening assets |
20,704 | 202 | 383 | 21,288 | ||||||||||||
|
Opening liabilities |
(1,116) | - | 645 | (471) | ||||||||||||
|
Net opening balance at January 1, 2022 |
19,588 | 202 | 1,028 | 20,818 | ||||||||||||
| Net expenses from reinsurance contracts |
(1,028) | 1,380 | (103) | 248 | ||||||||||||
| Other reinsurance finance income / (expenses) |
(3,956) | 10 | - | (3,945) | ||||||||||||
| Investment components |
(6) | (2) | 8 | - | ||||||||||||
| Effect of changes in risk of non-performance of reinsurers |
1 | - | - | 1 | ||||||||||||
| Total changes in the statements of P&L and OCI |
(4,988) | 1,388 | (96) | (3,696) | ||||||||||||
| Cash flows |
(1,021) | (12) | (466) | (1,498) | ||||||||||||
| Transfers to disposal groups |
(327) | (1) | - | (328) | ||||||||||||
| Other movements |
5 | - | - | 5 | ||||||||||||
|
Net exchange differences |
1,327 | (28) | 64 | 1,363 | ||||||||||||
|
Net closing balance at December 31, 2022 |
14,584 | 1,549 | 530 | 16,664 | ||||||||||||
| Closing assets |
14,801 | 1,607 | 526 | 16,934 | ||||||||||||
|
Closing liabilities |
(217) | (57) | 5 | (270) | ||||||||||||
| Investment contracts with discretionary participating features | ||||||||||||||||
| Remaining coverage | ||||||||||||||||
| EUR millions | Excluding loss component |
Loss component | Incurred claims | Total | ||||||||||||
| Opening assets |
- | - | - | - | ||||||||||||
|
Opening liabilities |
21,055 | - | - | 21,055 | ||||||||||||
|
Net opening balance at January 1, 2023 |
21,055 | - | - | 21,055 | ||||||||||||
| Insurance revenue |
(29) | - | - | (29) | ||||||||||||
| Incurred claims and other insurance service expenses |
- | - | 14 | 14 | ||||||||||||
| Insurance service expenses |
- | - | 14 | 14 | ||||||||||||
|
Investment components |
(1,133) | - | 1,134 | - | ||||||||||||
| Insurance service result |
(1,163) | - | 1,148 | (15) | ||||||||||||
| Insurance finance income / (expenses) (P&L and OCI) |
676 | - | - | 676 | ||||||||||||
| Cash flows |
255 | - | (1,148) | (893) | ||||||||||||
|
Net exchange differences |
709 | - | - | 709 | ||||||||||||
|
Net closing balance at June 30, 2023 |
21,533 | - | - | 21,533 | ||||||||||||
| Closing assets |
- | - | - | - | ||||||||||||
|
Closing liabilities |
21,533 | - | - | 21,533 | ||||||||||||
|
|
Unaudited | Page 66 of 131 |
Condensed consolidated interim financial information for the period ended June 30, 2023
| Investment contracts with discretionary participating features | ||||||||||||||||
| Remaining coverage | ||||||||||||||||
| EUR millions | Excluding loss component |
Loss component | Incurred claims | Total | ||||||||||||
| Opening assets |
- | - | - | - | ||||||||||||
|
Opening liabilities |
27,392 | - | - | 27,392 | ||||||||||||
|
Net opening balance at January 1, 2022 |
27,392 | - | - | 27,392 | ||||||||||||
| Insurance revenue |
(74) | - | - | (74) | ||||||||||||
| Incurred claims and other insurance service expenses |
- | - | 58 | 58 | ||||||||||||
| Losses (and reversal of losses) on onerous contracts |
- | (5) | - | (5) | ||||||||||||
| Insurance service expenses |
- | (5) | 58 | 54 | ||||||||||||
|
Investment components |
(2,254) | 5 | 2,250 | - | ||||||||||||
| Insurance service result |
(2,328) | - | 2,308 | (20) | ||||||||||||
| Insurance finance income / (expenses) (P&L and OCI) |
(3,247) | - | - | (3,247) | ||||||||||||
| Cash flows |
511 | - | (2,308) | (1,797) | ||||||||||||
|
Net exchange differences |
(1,273) | - | - | (1,273) | ||||||||||||
|
Net closing balance at December 31, 2022 |
21,055 | - | - | 21,055 | ||||||||||||
| Closing assets |
- | - | - | - | ||||||||||||
|
Closing liabilities |
21,055 | - | - | 21,055 | ||||||||||||
|
|
Unaudited | Page 67 of 131 |
Condensed consolidated interim financial information for the period ended June 30, 2023
13.2.2 Movement schedules by measurement component
| Insurance contracts – not measured at PAA | ||||||||||||||||
| EUR millions | Best estimate liability |
Risk adjustment |
Contractual service margin |
Total | ||||||||||||
| Opening assets |
100 | - | (64) | 36 | ||||||||||||
|
Opening liabilities |
163,381 | 3,436 | 8,865 | 175,681 | ||||||||||||
|
Net opening balance, at January 1, 2023 |
163,280 | 3,435 | 8,929 | 175,645 | ||||||||||||
| Changes in estimates that adjust contractual service margin |
334 | 70 | (404) | - | ||||||||||||
| Changes in estimates that result in (a reversal of) onerous contracts |
609 | (6) | - | 603 | ||||||||||||
| New contracts issued – non-onerous |
(286) | 48 | 237 | - | ||||||||||||
|
New contracts issued – onerous |
22 | 14 | - | 35 | ||||||||||||
| Changes that relate to future service |
679 | 126 | (167) | 638 | ||||||||||||
| Earnings released from contractual service margin |
- | - | (480) | (480) | ||||||||||||
| Release of risk adjustment |
- | (200) | - | (200) | ||||||||||||
| Experience adjustments on current service |
(86) | - | - | (86) | ||||||||||||
|
Revenue recognised for incurred policyholder tax expenses |
(11) | - | - | (11) | ||||||||||||
| Changes that relate to current service |
(96) | (200) | (480) | (776) | ||||||||||||
|
Experience adjustments on claims incurred |
13 | - | - | 13 | ||||||||||||
|
Changes that relate to past service |
13 | - | - | 13 | ||||||||||||
| Insurance service result |
596 | (75) | (646) | (125) | ||||||||||||
| General model |
||||||||||||||||
| Interest accreted to insurance contracts |
1,342 | 107 | 115 | 1,564 | ||||||||||||
| Changes in interest rates and other financial assumptions |
693 | (6) | - | 687 | ||||||||||||
| Revaluation of changes in non-financial assumptions and experience adjustments to current interest rates |
480 | (4) | - | 476 | ||||||||||||
| Variable fee approach |
||||||||||||||||
| Change in fair value of the underlying assets of products with direct participating features |
7,470 | - | - | 7,470 | ||||||||||||
|
Change in fulfilment value of products with direct participating features not recognized in CSM due to risk mitigation option |
(780) | - | - | (780) | ||||||||||||
| Insurance finance income / (expenses) |
9,205 | 97 | 115 | 9,418 | ||||||||||||
| Premiums received |
6,802 | - | - | 6,802 | ||||||||||||
| Claims, benefits and expenses paid |
(11,312) | - | - | (11,312) | ||||||||||||
| Acquisition costs paid |
(463) | - | - | (463) | ||||||||||||
|
Other |
(17) | - | - | (17) | ||||||||||||
| Cash flows |
(4,989) | - | - | (4,989) | ||||||||||||
| Contracts disposed during the period |
(174) | (2) | (52) | (228) | ||||||||||||
| Other |
1 | - | (21) | (20) | ||||||||||||
| Transfer (to)/from other headings |
(378) | - | 1 | (377) | ||||||||||||
| Other movements |
(551) | (2) | (72) | (625) | ||||||||||||
|
Net exchange differences |
(1,580) | (48) | (103) | (1,731) | ||||||||||||
|
Net closing balance, at June 30, 2023 |
165,961 | 3,408 | 8,223 | 177,592 | ||||||||||||
| Closing assets |
342 | (269) | (20) | 53 | ||||||||||||
|
Closing liabilities |
166,303 | 3,139 | 8,203 | 177,645 | ||||||||||||
|
|
Unaudited | Page 68 of 131 |
Condensed consolidated interim financial information for the period ended June 30, 2023
| Insurance contracts – not measured at PAA | ||||||||||||||||
| EUR millions | Best estimate liability |
Risk adjustment |
Contractual service margin |
Total | ||||||||||||
| Opening assets |
1,086 | (510) | (465) | 110 | ||||||||||||
|
Opening liabilities |
271,870 | 4,831 | 11,401 | 288,102 | ||||||||||||
|
Net opening balance, at January 1, 2022 |
270,784 | 5,341 | 11,866 | 287,991 | ||||||||||||
| Changes in estimates that adjust contractual service margin |
909 | (1,232) | 323 | - | ||||||||||||
| Changes in estimates that result in (a reversal of) onerous contracts |
1,408 | (131) | - | 1,277 | ||||||||||||
| New contracts issued – non-onerous |
(595) | 103 | 493 | - | ||||||||||||
|
New contracts issued – onerous |
27 | 29 | - | 56 | ||||||||||||
| Changes that relate to future service |
1,749 | (1,231) | 816 | 1,333 | ||||||||||||
| Earnings released from contractual service margin |
- | - | (1,229) | (1,229) | ||||||||||||
| Release of risk adjustment |
- | (359) | - | (359) | ||||||||||||
| Experience adjustments on current service |
(47) | 1 | - | (46) | ||||||||||||
|
Revenue recognised for incurred policyholder tax expenses |
1 | - | - | 1 | ||||||||||||
| Changes that relate to current service |
(46) | (359) | (1,229) | (1,634) | ||||||||||||
|
Experience adjustments on claims incurred |
(7) | - | - | (8) | ||||||||||||
|
Changes that relate to past service |
(7) | - | - | (8) | ||||||||||||
| Insurance service result |
1,695 | (1,591) | (414) | (309) | ||||||||||||
| General model |
||||||||||||||||
| Interest accreted to insurance contracts |
2,548 | 156 | 221 | 2,925 | ||||||||||||
| Changes in interest rates and other financial assumptions |
(28,114) | (58) | - | (28,172) | ||||||||||||
| Revaluation of changes in non-financial assumptions and experience adjustments to current interest rates |
(862) | 19 | - | (843) | ||||||||||||
| Variable fee approach |
||||||||||||||||
| Change in fair value of the underlying assets of products with direct participating features |
(25,351) | - | - | (25,351) | ||||||||||||
|
Change in fulfilment value of products with direct participating features not recognized in CSM due to risk mitigation option |
(5,799) | - | - | (5,799) | ||||||||||||
| Insurance finance income / (expenses) |
(57,578) | 117 | 221 | (57,240) | ||||||||||||
| Premiums received |
15,444 | - | - | 15,444 | ||||||||||||
| Claims, benefits and expenses paid |
(26,454) | - | - | (26,454) | ||||||||||||
| Acquisition costs paid |
(892) | - | - | (892) | ||||||||||||
|
Other |
(28) | - | - | (28) | ||||||||||||
| Cash flows |
(11,930) | - | - | (11,930) | ||||||||||||
| Contracts disposed during the period |
(177) | (5) | (96) | (278) | ||||||||||||
| Disposal of a business |
- | - | - | - | ||||||||||||
| Transfers to disposal groups |
(48,338) | (659) | (3,040) | (52,037) | ||||||||||||
|
Other |
- | - | 5 | 5 | ||||||||||||
| Other movements |
(48,515) | (663) | (3,131) | (52,310) | ||||||||||||
|
Net exchange differences |
8,825 | 231 | 387 | 9,442 | ||||||||||||
|
Net closing balance, at December 31, 2022 |
163,280 | 3,435 | 8,929 | 175,645 | ||||||||||||
| Closing assets |
100 | - | (64) | 36 | ||||||||||||
|
Closing liabilities |
163,381 | 3,436 | 8,865 | 175,681 | ||||||||||||
|
|
Unaudited | Page 69 of 131 |
Condensed consolidated interim financial information for the period ended June 30, 2023
| Reinsurance contracts held – not measured at PAA | ||||||||||||||||
| EUR millions | Best estimate liability |
Risk adjustment |
Contractual service margin |
Total | ||||||||||||
| Opening assets |
16,233 | 1,010 | (309) | 16,934 | ||||||||||||
|
Opening liabilities |
(371) | (101) | 202 | (270) | ||||||||||||
|
Net opening balance at January 1, 2023 |
15,862 | 909 | (107) | 16,664 | ||||||||||||
| Changes in estimates that adjust the contractual service margin |
(65) | (46) | 111 | - | ||||||||||||
| Changes in estimates that relate to losses and reversals of losses on underlying onerous contracts |
406 | 60 | (9) | 458 | ||||||||||||
| New reinsurance contracts issued / acquired recognized in the year |
(68) | 12 | 56 | - | ||||||||||||
| Initial recognition of onerous underlying contracts |
- | - | (6) | (6) | ||||||||||||
| Changes in contractual service margin due to establishing of loss recovery component from onerous underlying contracts |
- | - | 7 | 7 | ||||||||||||
|
Changes in the contractual service margin due to reversals of a loss-recovery component other than changes in the FCF of reinsurance contracts held |
- | - | (1) | (1) | ||||||||||||
| Changes that relate to future service |
274 | 27 | 158 | 459 | ||||||||||||
| CSM recognized for service received |
- | - | (7) | (7) | ||||||||||||
| Release of risk adjustment |
- | (73) | - | (73) | ||||||||||||
|
Experience adjustments on current service |
(200) | - | - | (200) | ||||||||||||
|
Changes that relate to current service |
(200) | (73) | (7) | (280) | ||||||||||||
|
Changes that relate to past service |
5 | - | - | 5 | ||||||||||||
| Net income/expenses of reinsurance held |
79 | (45) | 150 | 184 | ||||||||||||
| Reinsurance finance income / (expenses) |
547 | 27 | (11) | 563 | ||||||||||||
| Premiums paid, net of received fixed commission |
831 | - | - | 831 | ||||||||||||
|
Amounts received |
(1,651) | - | - | (1,651) | ||||||||||||
|
Cash flows |
(820) | - | - | (820) | ||||||||||||
| Other movements |
- | - | - | - | ||||||||||||
|
Net exchange differences |
(336) | (11) | 5 | (342) | ||||||||||||
|
Net closing balance at June 30, 2023 |
15,332 | 879 | 38 | 16,249 | ||||||||||||
| Closing assets |
15,958 | 571 | (69) | 16,460 | ||||||||||||
|
Closing liabilities |
(626) | 308 | 106 | (211) | ||||||||||||
|
|
Unaudited | Page 70 of 131 |
Condensed consolidated interim financial information for the period ended June 30, 2023
| Reinsurance contracts held – not measured at PAA | ||||||||||||||||
| EUR millions | Best estimate liability |
Risk
|
Contractual service margin |
Total | ||||||||||||
| Opening assets | 20,608 | 1,009 | (328) | 21,288 | ||||||||||||
| Opening liabilities | (1,617) | 585 | 561 | (471) | ||||||||||||
| Net opening balance at January 1, 2022 | 18,991 | 1,594 | 233 | 20,818 | ||||||||||||
| Changes in estimates that adjust the contractual service margin | 244 | (408) | 164 | - | ||||||||||||
| Changes in estimates that relate to losses and reversals of losses on underlying onerous contracts | 655 | (58) | 4 | 602 | ||||||||||||
| New reinsurance contracts issued / acquired recognized in the year | (8) | 21 | (13) | - | ||||||||||||
| Initial recognition of onerous underlying contracts | - | - | 31 | 31 | ||||||||||||
| Changes in contractual service margin due to establishing of loss recovery component from onerous underlying contracts | - | - | 8 | 8 | ||||||||||||
| Changes in the contractual service margin due to reversals of a loss-recovery component other than changes in the FCF of reinsurance contracts held | - | - | (2) | (2) | ||||||||||||
| Changes that relate to future service | 891 | (444) | 192 | 638 | ||||||||||||
| CSM recognized for service received | - | - | 42 | 42 | ||||||||||||
| Release of risk adjustment | - | (147) | - | (147) | ||||||||||||
| Experience adjustments on current service | (274) | - | - | (274) | ||||||||||||
| Changes that relate to current service | (274) | (147) | 42 | (379) | ||||||||||||
| Experience adjustment on claims component | (12) | - | - | (12) | ||||||||||||
| Changes that relate to past service
|
|
(12)
|
|
|
-
|
|
|
-
|
|
|
(12)
|
| ||||
| Net income/expenses of reinsurance held | 605 | (591) | 234 | 248 | ||||||||||||
| Reinsurance finance income / (expenses) | (3,954) | 47 | (37) | (3,944) | ||||||||||||
| Premiums paid, net of received fixed commission | 3,005 | - | - | 3,005 | ||||||||||||
| Amounts received | (4,503) | - | - | (4,503) | ||||||||||||
| Other | - | - | - | - | ||||||||||||
| Cash flows | (1,498) | - | - | (1,498) | ||||||||||||
| Transfers to disposal groups | 404 | (206) | (526) | (328) | ||||||||||||
| Other | (1) | - | 6 | 5 | ||||||||||||
| Other movements | 403 | (206) | (520) | (323) | ||||||||||||
| Net exchange differences | 1,316 | 65 | (17) | 1,363 | ||||||||||||
| Net closing balance at December 31, 2022 | 15,862 | 909 | (107) | 16,664 | ||||||||||||
| Closing assets | 16,233 | 1,010 | (309) | 16,934 | ||||||||||||
| Closing liabilities | (371) | (101) | 202 | (270) | ||||||||||||
|
|
Unaudited | Page 71 of 131 |
Condensed consolidated interim financial information for the period ended June 30, 2023
| Investment contracts with discretionary participating features | ||||||||||||||||
| EUR millions | Best estimate liability |
Risk adjustment
|
Contractual margin |
Total | ||||||||||||
| Opening assets | - | - | - | - | ||||||||||||
| Opening liabilities | 20,874 | 109 | 72 | 21,055 | ||||||||||||
| Net opening balance at January 1, 2023 | 20,874 | 109 | 72 | 21,055 | ||||||||||||
| Changes in estimates that adjust contractual service margin | (37) | 12 | 25 | - | ||||||||||||
| Changes that relate to future service | (37) | 12 | 25 | - | ||||||||||||
| Earnings released from contractual service margin | - | - | (6) | (6) | ||||||||||||
| Release of risk adjustment | - | (7) | - | (7) | ||||||||||||
| Experience adjustments on current service | (3) | - | - | (2) | ||||||||||||
| Changes that relate to current service
|
|
(3)
|
|
|
(7)
|
|
|
(6)
|
|
|
(15)
|
| ||||
| Insurance service result | (39) | 5 | 20 | (15) | ||||||||||||
| General model | ||||||||||||||||
| Variable fee approach | ||||||||||||||||
| Change in fair value of the underlying assets of products with direct participating features | 676 | - | - | 676 | ||||||||||||
| Insurance finance income / (expenses) | 676 | - | - | 676 | ||||||||||||
| Premiums received | 255 | - | - | 255 | ||||||||||||
| Claims, benefits and expenses paid | (1,148) | - | - | (1,148) | ||||||||||||
| Cash flows | (893) | - | - | (893) | ||||||||||||
| Net exchange differences | 702 | 4 | 3 | 709 | ||||||||||||
| Net closing balance at June 30, 2023 | 21,320 | 117 | 95 | 21,533 | ||||||||||||
| Closing assets | - | - | - | - | ||||||||||||
| Closing liabilities | 21,320 | 117 | 95 | 21,533 | ||||||||||||
|
|
Unaudited | Page 72 of 131 |
Condensed consolidated interim financial information for the period ended June 30, 2023
| Investment contracts with discretionary participating features | ||||||||||||||||
| EUR millions | Best estimate liability |
Risk adjustment
|
Contractual service margin |
Total | ||||||||||||
| Opening assets | - | - | - | - | ||||||||||||
| Opening liabilities | 27,064 | 133 | 195 | 27,392 | ||||||||||||
| Net opening balance at January 1, 2022 | 27,064 | 133 | 195 | 27,392 | ||||||||||||
| Changes in estimates that adjust contractual service margin | 110 | (3) | (106) | - | ||||||||||||
| Changes that relate to future service | 110 | (3) | (106) | - | ||||||||||||
| Earnings released from contractual service margin | - | - | (11) | (11) | ||||||||||||
| Release of risk adjustment | - | (14) | - | (14) | ||||||||||||
| Experience adjustments on current service | 5 | - | - | 5 | ||||||||||||
| Changes that relate to current service | 5 | (14) | (11) | (20) | ||||||||||||
| Insurance service result | 114 | (17) | (117) | (20) | ||||||||||||
| General model | ||||||||||||||||
| Variable fee approach | ||||||||||||||||
| Change in fair value of the underlying assets of products with direct participating features | (3,247) | - | - | (3,247) | ||||||||||||
| Insurance finance income / (expenses) | (3,247) | - | - | (3,247) | ||||||||||||
| Premiums received | 511 | - | - | 511 | ||||||||||||
| Claims, benefits and expenses paid | (2,308) | - | - | (2,308) | ||||||||||||
| Cash flows | (1,797) | - | - | (1,797) | ||||||||||||
| Net exchange differences | (1,261) | (6) | (6) | (1,273) | ||||||||||||
| Net closing balance at December 31, 2022 | 20,874 | 109 | 72 | 21,055 | ||||||||||||
| Closing assets | - | - | - | - | ||||||||||||
| Closing liabilities | 20,874 | 109 | 72 | 21,055 | ||||||||||||
13.2.3 Movement schedules contractual service margin by transition method
Contractual service margin recognized on contracts in-force on the transition date to IFRS 17.
| Insurance contracts | Investment contracts with DPF | Reinsurance contracts held | ||||||||||||||||||||||||||||||||||||||||||||||
| EUR millions | MRA1 | FVA2 | Other | Total CSM |
MRA | FVA | Other | Total CSM |
MRA | FVA | Other | Total CSM |
||||||||||||||||||||||||||||||||||||
| At January 1, 2023 | 1,836 | 4,673 | 2,420 | 8,929 | - | 72 | - | 72 | 1 | (129) | 21 | (107) | ||||||||||||||||||||||||||||||||||||
| Changes in estimates that adjust CSM | 125 | (557) | 28 | (404) | - | 25 | - | 25 | - | 113 | (2) | 111 | ||||||||||||||||||||||||||||||||||||
| Changes in estimates that relate to losses and reversals of losses on underlying onerous contracts | - | - | - | - | - | - | - | - | - | (9) | 6 | (3) | ||||||||||||||||||||||||||||||||||||
| New contracts issued: non- onerous | - | - | 237 | 237 | - | - | - | - | - | - | 50 | 50 | ||||||||||||||||||||||||||||||||||||
| Earnings released from contractual service margin | (98) | (257) | (124) | (480) | - | (6) | - | (6) | - | 1 | (8) | (7) | ||||||||||||||||||||||||||||||||||||
| Insurance finance income / (expense) | 4 | 87 | 24 | 115 | - | - | - | - | - | (11) | - | (11) | ||||||||||||||||||||||||||||||||||||
| Cash flow - contracts disposed | - | (52) | - | (52) | - | - | - | - | - | - | - | - | ||||||||||||||||||||||||||||||||||||
| Net exchange differences | (40) | (74) | 12 | (103) | - | 3 | - | 3 | - | 4 | 1 | 5 | ||||||||||||||||||||||||||||||||||||
| Other | 1 | (2) | (18) | (19) | - | - | - | - | - | - | - | - | ||||||||||||||||||||||||||||||||||||
| At June 30, 2023 | 1,828 | 3,817 | 2,578 | 8,223 | - | 95 | - | 95 | - | (30) | 67 | 38 | ||||||||||||||||||||||||||||||||||||
1 MRA – modified retrospective
approach
2 FVA – fair value approach
|
|
Unaudited | Page 73 of 131 |
Condensed consolidated interim financial information for the period ended June 30, 2023
| Insurance contracts |
Investment contracts with DPF | Reinsurance contracts held | ||||||||||||||||||||||||||||||||||||||||||||||
| EUR millions | MRA | FVA | Other | Total CSM |
MRA | FVA | Other | Total CSM |
MRA | FVA | Other | Total CSM |
||||||||||||||||||||||||||||||||||||
| At January 1, 2022 | 2,639 | 4,244 | 2,191 | 9,074 | - | 195 | - | 195 | 0 | (153) | (5) | (158) | ||||||||||||||||||||||||||||||||||||
| Changes in estimates that adjust CSM | (792) | 666 | 12 | (114) | - | (106) | (0) | (106) | 0 | 1 | (3) | (2) | ||||||||||||||||||||||||||||||||||||
| Changes in estimates that relate to losses and reversals of losses on underlying onerous contracts | - | - | - | - | - | - | - | - | - | 2 | 8 | 10 | ||||||||||||||||||||||||||||||||||||
| New contracts issued: non-onerous | - | - | 474 | 474 | - | - | - | - | - | - | 26 | 26 | ||||||||||||||||||||||||||||||||||||
| Earnings released from contractual service margin | (205) | (578) | (246) | (1,029) | - | (11) | - | (11) | - | 67 | (4) | 63 | ||||||||||||||||||||||||||||||||||||
| Insurance finance income / (expense) | 9 | 186 | 33 | 228 | - | - | - | - | - | (35) | - | (35) | ||||||||||||||||||||||||||||||||||||
| Cash flow - contracts disposed | - | (96) | - | (96) | - | - | - | - | - | - | - | - | ||||||||||||||||||||||||||||||||||||
| Net exchange differences | 186 | 246 | (45) | 387 | - | (6) | - | (6) | - | (17) | - | (17) | ||||||||||||||||||||||||||||||||||||
| Other | - | 5 | 0 | 5 | - | - | - | - | - | 6 | - | 6 | ||||||||||||||||||||||||||||||||||||
| At December 31, 2022 | 1,836 | 4,673 | 2,420 | 8,929 | - | 72 | - | 72 | 1 | (129) | 21 | (107) | ||||||||||||||||||||||||||||||||||||
Other contracts comprise contracts transitioned under the full retrospective approach and contracts issued after the transition to IFRS 17.
13.3 Critical judgements and estimates
13.3.1. Fulfilment cash flows
The fulfilment cash flows comprise:
| ◾ | Estimates of future cash flows; |
| ◾ | An adjustment to reflect time value of money and the financial risks related to future cash flows, to the extent that the financial risks are not included in the estimates of future cash flows and |
| ◾ | A risk adjustment for non-financial risk. |
Each measurement element requires the use of significant judgement and estimates.
13.3.1.1 Valuation methods
Aegon’s objective in estimating future cash flows is to determine a range of scenarios that reflects the full range of possible outcomes. Each scenario specifies the amount and timing of the cash flows for a particular outcome, and the estimated probability of that outcome. The cash flows from each scenario are discounted and weighted by the estimated probability of that outcome to derive an expected present value.
When determining the expected value of the full range of possible outcomes, the objective is to incorporate all reasonable and supportable information available without undue cost or effort in an unbiased way, rather than to identify every possible scenario. In some cases, relatively simple modelling provides an answer within an acceptable range of precision. In other cases, more complex valuation methods are required to satisfy the measurement objective. For example, if cash flows reflect a series of interrelated (implicit or explicit) options and respond in a non-linear fashion to changes in economic conditions, then Aegon often uses stochastic modelling techniques to estimate the expected present value. Stochastic modelling involves projecting future cash flows under a large number of possible economic scenarios for market variables such as interest rates and equity returns. Other methods that are used to measure non-linear cash flows include closed form solutions and replicating portfolio techniques.
|
|
Unaudited | Page 74 of 131 |
Condensed consolidated interim financial information for the period ended June 30, 2023
13.3.1.2 Actuarial assumptions
When estimating future cash flows, Aegon sets actuarial assumptions for underwriting risk including policy claims (such as mortality, longevity or morbidity), policyholder behavior (such as lapses, surrender of policies or partial withdrawals), property & casualty loss ratios and expenses. Actuarial assumptions are set annually, with the exception of expense assumptions which might be updated more frequently as a result on the quarterly monitoring of actual expenses.
Underwriting assumptions
Mortality tables applied are generally developed based on a blend of company experience and industry wide studies, taking into consideration product characteristics, own risk selection criteria, target market and past experience. Mortality experience is monitored through regular studies, the results of which are fed into the pricing cycle for new products and reflected in the liability calculation for in-force groups of contracts where appropriate. For contracts insuring survivorship or mortality, allowance is made for further longevity or mortality improvements. Morbidity assumptions are based on own claims severity and frequency experience, adjusted where appropriate for industry information. Industry survey is used for judgement-based assumptions like for example morbidity improvement and cost of long-term care (LTC) inflation.
Surrender and lapse rates depend on product features, policy duration and external circumstances such as the interest rate environment and competitor behavior. For policies where policyholders are expected to have financial incentive to choose a favorable lapse timing based on the market conditions, a dynamic lapse assumption is utilized to reflect expected policyholder behavior when applying multiple scenarios in measurement. Own experience, as well as industry published data, are used to in establishing assumptions. Lapse experience is correlated to mortality and morbidity levels, as higher or lower levels of surrenders may indicate future claims will be higher or lower than anticipated. Such correlations are accounted for in the mortality and morbidity assumptions based on the emerging analysis of experience.
Policyholder benefits that are directly linked to asset performance are projected at rates that are consistent with the discount rates applied. For cash flows like crediting rates, the projected cash flows reflect how the reporting unit would determine crediting rates in a given scenario based on the Group’s crediting policies. Other management actions are taken into account to the extent that they are part of Aegon’s regular policies and procedures.
Given that Aegon applies the premium allocation approach to most of its non-life insurance business, actuarial assumptions related to (ultimate) loss ratio assumptions only impact the fulfilment cash flows for onerous groups of contracts with remaining coverage and for contracts with incurred claims. Aegon uses a range of loss reserving techniques to estimate (ultimate) claims ratios, using historical claims development data as well as market observable inputs. Large ticket reported claims are assessed on an individual basis.
Expense assumptions
Expenses that are attributable to the fulfilment of cash flows include acquisition expenses, maintenance expenses and claims settlement costs, as well as overhead costs that Aegon considers to be unavoidable when fulfilling the in-force contracts. Investment expenses are included in the fulfilment cash flows for contracts that provide investment-related or investment-return services, as well as for contracts where Aegon performs investment activities that enhance the policyholders’ benefits from insurance coverage. Aegon’s expense assumptions are based on the current level of expenses, adjusted for future expense inflation and the impact of known one-off projects (such as planned cost saving initiatives or projects to implement additional regulatory reporting requirements). In not-at-scale units, further adjustment is made to reflect a long-term scale of business.
|
|
Unaudited | Page 75 of 131 |
Condensed consolidated interim financial information for the period ended June 30, 2023
When allocating the attributable expenses to groups of contracts, Aegon leverages allocation approaches used for pricing or regulatory reporting. Where IFRS requires a greater level of granularity, additional allocation keys are applied that have been defined based on, for example, further expense studies. The expense inflation assumption is split into a financial component that is calibrated to market observables and a non-financial component that is set as an actuarial assumption. The non-financial component of the expense inflation assumption represents the estimated difference between general market inflation implied by the market and expense inflation that is specific to Aegon’s product characteristics. Some inflation assumptions (such as LTC utilization and health medical inflation in the Americas) do not include a financial component but are entirely set as an actuarial assumption, given that they are weakly correlated with general inflation indices and there is no hedge market for such rates.
Discount rates and other financial assumptions
Aegon adjusts the estimated future cash flows of a group of contracts to reflect the time value of money and the financial risks related to those cash flows, to the extent that the financial risks are not included in the estimates of cash flows. The discount rates applied to the estimates of the future cash flows:
| ◾ | Reflect the time value of money, the characteristics of the cash flows and the liquidity characteristics of the insurance contracts; |
| ◾ | Are consistent with observable current market prices (if any) for financial instruments with cash flows whose characteristics are consistent with those of the insurance contracts, in terms of, for example, timing, currency and liquidity; and |
| ◾ | Exclude the effect of factors that influence observable market prices but do not affect the future cash flows of the insurance contracts. |
No implicit adjustments for non-financial risk are included in the discount rates, as the risk adjustment for non-financial risks is explicitly included in the fulfilment cash flows.
When determining the discount rates at the date of initial recognition of a group of contracts, Aegon uses weighted-average discount rates over the period that contracts in that group are issued (i.e. six months).
IFRS explicitly mentions two calibration options for the discount rate, namely the ‘top-down approach’ and ‘bottom-up’ approach. Aegon has generalized both approaches into a direct discounting technique in which discount rates are determined as the sum of the risk-free rate plus a percentage of the illiquidity premium (ILP). The ILP is an extra spread that an investor can earn by investing in a security that offers limited or no ability for the investor to exit the investment prior to its maturity. If an insurance liability is illiquid (meaning that the policyholder has limited or no ability to cash it in prior to maturity or contingency-base payment), the liability is discounted at a rate that includes an ILP because illiquid assets (earning an illiquidity premium) may be purchased to back or replicate that liability.
Risk-free yield curve
Aegon has identified various rates available in the EUR, GBP and USD markets that can be used as a basis for the risk-free yield curve, including EURIBOR swap rates for EUR, reformed Sterling Overnight Index Average (SONIA) for GBP, and Secured Overnight Funding Rates (SOFR) and US Treasury rates for USD. EURIBOR rates are adjusted for credit risk by subtracting a credit risk allowance. No adjustment is made to overnight swap rates and US Treasury rates, as the credit risk of these instruments is deemed negligible.
A full risk-free yield curve is derived by first interpolating between tenors for which market data is available, and then extrapolating the yield curve beyond market observable maturities. Discount rates converge linearly in 10 years to an ultimate forward rate. A uniform last liquid point for EUR and USD is set at 30 years, GBP is set at 50 years. The ultimate forward rates reflect a long-term view on nominal interest rates and is set by management per currency, considering expected real interest rates and long-term inflation together with the current market environment. The ultimate forward rates have been reviewed as part of the annual Group economic assumptions update and revised to a common level of 3.45% effective June 30, 2023. (December 31, 2022: 3.50%, 3.65% and 3.45% for the USD, EUR and GBP respectively.)
Aegon reviews the risk-free last liquid point and ultimate forward rates quarterly which, although expected to be infrequent, may lead to assumption updates if there are significant changes in market conditions.
|
|
Unaudited | Page 76 of 131 |
Condensed consolidated interim financial information for the period ended June 30, 2023
| Yield curves (zero coupon rates excluding ILP) June 30, 2023 | 1 year | 5 years | 10 years | 15 years | 20 years | |||||
| EUR | 3.99% | 3.14% | 2.88% | 2.82% | 2.67% | |||||
| GBP | 6.06% | 5.03% | 4.25% | 4.03% | 3.88% | |||||
| USD | 5.44% | 4.16% | 3.81% | 3.85% | 4.22% | |||||
| Yield curves (zero coupon rates excluding ILP) December 31, 2022 | 1 year | 5 years | 10 years | 15 years | 20 years | |||||
| EUR | 3.18% | 3.10% | 3.05% | 2.98% | 2.73% | |||||
| GBP | 4.46% | 4.06% | 3.71% | 3.62% | 3.54% | |||||
| USD | 4.97% | 4.03% | 3.83% | 3.94% | 4.31% | |||||
Illiquidity premium
Aegon sets ILPs at the level of the reporting unit or major business unit, reflecting how it manages the investments and ALM risk for the given block of liabilities. For example, in the US Aegon has set ILPs by lines of business which has resulted in 9 ILP curves. For each unit, an ILP curve is constructed that is based on the market-observables returns on a reference portfolio of assets. The reference portfolio is based on the unit’s investment policy target mix of fixed interest securities and excludes alternative investments (such as equities and real estate investments).
To derive the ILP curve for respective lines of business, market observable spreads are sourced and adjusted for expected and unexpected default losses. The ILP is based on the line of business reference portfolio and investment strategy.
The full ILP curve is derived by interpolating between the observable tenors and then extrapolating the yield linearly beyond the ILP last liquid point to the ultimate forward ILP. The last liquid point can be set separately for each duration bucket, or as a practical simplification, as a single point in time for the entire reference portfolio. The ultimate forward spread is set based on historical average spread adjusted for differences between the current and long-term asset mix and default risk.
Aegon updates the reference portfolio quarterly, and the ILP last liquid point and ILP ultimate forward rate are revised accordingly. The most significant products of Aegon N.V. are presented below.
| ILP by portfolio
June 30, 2023 |
1 year | 5 years | 10 years | 15 years | 20 years | 30 years | ||||||
| Fixed Deferred Annuity | 1.41% | 1.46% | 1.29% | 1.12% | 1.12% | 1.11% | ||||||
| Indexed Universal Life | 1.48% | 1.43% | 1.33% | 1.22% | 1.22% | 1.22% | ||||||
| Long Term Care | 1.30% | 1.31% | 1.30% | 1.29% | 1.30% | 1.32% | ||||||
| Traditional Life | 1.32% | 1.34% | 1.34% | 1.27% | 1.28% | 1.29% | ||||||
| Universal Life | 1.36% | 1.37% | 1.33% | 1.26% | 1.26% | 1.28% | ||||||
| Variable Annuities | 0.70% | 0.70% | 0.69% | 0.69% | 0.68% | 0.69% | ||||||
| Annuities | 1.09% | 1.09% | 1.09% | 1.09% | 1.09% | 0.98% | ||||||
| Individual Protection | 0.50% | 0.50% | 0.50% | 0.50% | 0.50% | 0.41% | ||||||
|
|
Unaudited | Page 77 of 131 |
Condensed consolidated interim financial information for the period ended June 30, 2023
| ILP by portfolio
December 31, 2022 |
1 year | 5 years | 10 years | 15 years | 20 years | 30 years | ||||||
| Fixed Deferred Annuity | 1.44% | 1.46% | 1.40% | 1.31% | 1.26% | 1.21% | ||||||
| Indexed Universal Life | 1.48% | 1.47% | 1.41% | 1.35% | 1.32% | 1.29% | ||||||
| Long Term Care | 1.37% | 1.38% | 1.38% | 1.36% | 1.35% | 1.34% | ||||||
| Traditional Life | 1.41% | 1.41% | 1.41% | 1.38% | 1.36% | 1.35% | ||||||
| Universal Life | 1.43% | 1.43% | 1.41% | 1.38% | 1.35% | 1.33% | ||||||
| Variable Annuities | 0.67% | 0.67% | 0.67% | 0.67% | 0.67% | 0.67% | ||||||
| Annuities | 1.08% | 1.08% | 1.08% | 1.08% | 1.08% | 1.03% | ||||||
| Individual Protection | 0.50% | 0.50% | 0.50% | 0.50% | 0.50% | 0.42% | ||||||
Illiquidity factor
The illiquidity factor reflects the liquidity characteristics of a certain group of insurance contracts. Groups of contracts whose cash flows are not dependent on the underlying assets are assigned an illiquidity factor of 100%. Groups of contracts for which the cash flows predominantly vary with the underlying assets are assigned an illiquidity factor of 0%. For example, Aegon UK does not apply an illiquidity factor to the Unit Linked products. For a few products that include both types of cash flows, such as US variable annuity products with guaranteed minimum withdrawal benefits, a combination of 100% and 0% ILP is used.
Other significant financial assumptions
Interest rate volatilities are modelled based on swaption prices, in line with current market pricing.
Risk adjustment for non-financial risk
The risk adjustment for non-financial risk is included explicitly as a separate component of the fulfilment cash flows. It reflects the compensation that Aegon requires for bearing the uncertainty about the amount and timing of the cash flows that arises from non-financial risk as it fulfils insurance contracts.
The non-financial risks considered include mortality, morbidity, policyholder behavior, expense, and product specific operational risk. Non-financial risks that do not arise from the insurance contracts, such as general operational risk, are not reflected in the risk adjustment. The risk adjustment reflects both the risk that actual experience differs from the best estimate assumption used to project future cash flows due to mis-estimation (parameter risk), as well as the risk of random fluctuations around the true estimates (contagion risk).
Diversification benefits are recognized at the Group level. To align with market practice, Aegon only reflects the degree of diversification between non-financial risks, and contrary to its pricing methodology, ignores diversification benefits between financial and non-financial risks. Diversification effects include the impact of reinsurance ceded, as well insurance contracts classified as held for sale.
Aegon generally applies a simplified confidence interval technique which estimates the risk adjustment for non-financial risk using a confidence level (probability of sufficiency) approach at the 80th percentile. Under this approach, a probability distribution is assumed for each particular risk and the amount above the expected present value of future cash flows determined (using a shock factor). The impacts for each risk are then aggregated using a correlation matrix, reflecting diversification between the various non-financial risk types. For some products, Aegon measures contagion risk using the Conditional Tail Expectation technique at the 75th percentile. Regardless of the technique applied, the confidence interval is computed across the entire product lifetime in order to fully reflect the risk.
|
|
Unaudited | Page 78 of 131 |
Condensed consolidated interim financial information for the period ended June 30, 2023
Changes in methods and inputs used to measure fulfilment cash flows
Actuarial assumptions are reviewed periodically in the second quarter for the US and in the fourth quarter for Europe and Asia, based on historical experience, observable market data, including market transactions such as acquisitions and reinsurance transactions, anticipated trends and legislative changes. Similarly, the models and systems used for determining our liabilities and reinsurance assets are reviewed periodically, and if deemed necessary, updated based on emerging best practice and available technology.
During 2Q 2023, Aegon implemented actuarial assumption and model updates which are mainly related to Aegon’s business in the Americas.
Outside the Netherlands, experience assumption updates (non-financial assumptions) are absorbed in the CSM where there are sufficient balances. The change in CSM will impact the amount amortized in the current period and all prospective periods. The total pre-tax impact of non-financial assumption changes at 1H 2023 is a EUR 257 million increase to liabilities. Most of the impact was driven by the model update on policyholder behavior mainly on Individual Life and Variable Annuities lines of business. Main assumption updates are all on morbidity but they are offset by a change in CSM so this change has limited impact on total liabilities.
Aegon did not make any significant changes to the contract boundaries in the current reporting period, nor did it update the approaches used to determine the discount rate or estimate the risk adjustment for non-financial risk.
13.3.2. Relevant other significant judgements
In addition to the judgments and estimates made in measuring the fulfilment cash flows that are described above, other significant judgments are applied in determining:
| ◾ | The relative weighting of coverage units when multiple services are provided; |
| ◾ | The non-distinct investment component, which is excluded from insurance revenue; and |
| ◾ | The adjustment for non-performance risk that is applied to reinsurance contracts held. |
13.3.2.1 Weighting of coverage units
Often one single metric can be defined that captures multiple services provided under one contract. Different approaches are used by Aegon when assessing the relative weighting of the benefits of different services. In some cases, the weighting is done in a way that directly flows from the composition of the benefits under the contract. For example, for a life insurance product with an account value that can be surrendered, coverage units can be based on the total death benefit as this amount comprises both the account value (investment service) and the excess death benefits (insurance service). In other cases, significant judgement is required. For example, for US long-term care products, multiple drivers impact the maximum daily benefit to which a policyholder could be entitled. To reflect this, the coverage unit is computed using a combination of the initial allowed benefit, the benefit period, as well as adjustments for any inflation protection and if the policy is paid-up on the contingent non-forfeiture option.
13.3.2.2. Investment component
Aegon reports insurance revenue and insurance service expenses excluding non-distinct investment components. An investment component is defined as the amount that an insurance contract requires Aegon to repay to a policyholder, even if the insured event does not occur.
Aegon determines the investment component, when a claim is incurred as an amount is released from the liability for remaining coverage. When doing so it considers which payments would have been possible immediately prior to the claims date. For example, a payment might have needed to be made to the policyholder in light of policy surrender, the uptake of a policy loan or the partial withdrawal, or the transfer of an insurance policy to another insurer. The investment component is defined net of any penalty or similar charges.
|
|
Unaudited | Page 79 of 131 |
Condensed consolidated interim financial information for the period ended June 30, 2023
13.3.2.3 Adjustment to reinsurance contracts held for non-performance risk
The non-performance risk by the reinsurer is based on Aegon’s credit exposure, net of collateral, and the perceived counterparty default risk. In assessing the credit exposure, Aegon takes into account treaty provisions for non-performance, such as the automatic recapture of the reinsured business on default of the reinsurer.
When estimating a reinsurer’s default risk, Aegon considers the current financial condition and credit standing of the reinsurer, expert judgment specific to the local reinsurance market and historical data (such as Moody’s Loss Given Default rates). The ultimate adjustment reflects the risk of potential reinsurance counterparty failure due to default (i.e. credit events), as well as disputes resulting in reduced payments and the potential for current conditions to change over time.
13.4 Risk mitigation
Aegon has chosen to apply the risk mitigation option and recognize changes in fulfilment value of products with direct participating features in the P&L and OCI, instead of adjusting the CSM. The adjustment to the CSM that would otherwise have been made in 1H 2023 is EUR 772 million.
14. Investment contracts without discretionary participating features
| June 30 | December 31 | |||||||
| EUR millions | 2023 | 2022 | ||||||
| Investment contracts without DPF where Aegon bears the risk | 10,113 | 9,597 | ||||||
| Investment contracts without DPF where policyholder bears the risk | 61,847 | 55,630 | ||||||
| Total investment contracts without DPF | 71,960 | 65,227 | ||||||
Investment contracts without discretionary participation features where Aegon bears the risk
| EUR millions | Total | |||
| At January 1, 2023 | 9,597 | |||
| Deposits | 791 | |||
| Withdrawals | (553) | |||
| Interest credited | 100 | |||
| Net exchange differences | (215) | |||
| Transfer to/from other headings | 406 | |||
| Other | (12) | |||
| At June 30, 2023 | 10,113 | |||
| EUR millions | Total | |||
| At January 1, 2022 | 20,674 | |||
| Deposits | 22,638 | |||
| Withdrawals | (23,118) | |||
| Interest credited | 232 | |||
| Net exchange differences | 582 | |||
| Transfer to/from other headings | 797 | |||
| Transfer to disposal groups | (12,179) | |||
| Other | (29) | |||
| At December 31, 2022 | 9,597 | |||
|
|
Unaudited | Page 80 of 131 |
Condensed consolidated interim financial information for the period ended June 30, 2023
Investment contracts without discretionary participation features where policyholder bears the risk
| EUR millions | Total | |||
| At January 1, 2023 | 55,631 | |||
| Gross premium and deposits – existing and new business | 5,941 | |||
| Withdrawals | (3,615) | |||
| Interest credited | 3,570 | |||
| Fund charges released | (153) | |||
| Net exchange differences | 657 | |||
| Transfer to/from other headings | (184) | |||
| Other | 2 | |||
| At June 30, 2023 | 61,847 | |||
| EUR millions | Total | |||
| At January 1, 2022 | 71,690 | |||
| Gross premium and deposits – existing and new business | 11,261 | |||
| Disposal of a business | (182) | |||
| Withdrawals | (15,051) | |||
| Interest credited | (9,864) | |||
| Fund charges released | (324) | |||
| Net exchange differences | 437 | |||
| Transfer to/from other headings | (943) | |||
| Transfer to disposal groups | (1,396) | |||
| Other | 2 | |||
| At December 31, 2022 | 55,631 | |||
15. Borrowings
| EUR millions | June 30, 2023 | December 31, 2022 | ||||
| Capital funding | 1,270 | 1,245 | ||||
| Operational funding | 1,750 | 2,806 | ||||
| Total borrowings | 3,020 | 4,051 | ||||
During the first six-month period of 2023, the operational funding decreased by EUR 1.0 billion mainly due to the paydown of Federal Home Loan Bank (FHLB) borrowings. This borrowing program is part of the asset – liability management strategy.
16. Financial risks
16.1 Credit risk
Credit risk is the risk of financial loss to the Group if a counterparty to a reinsurance contract or financial instrument fails to meet its contractual obligations; the risk of economic loss due to the deterioration in the financial condition of counterparties, either through fair value losses on traded securities or through defaults on traded securities, loans, and mortgages.
|
|
Unaudited | Page 81 of 131 |
Condensed consolidated interim financial information for the period ended June 30, 2023
16.1.1 Credit risk management
The Group implemented policies and procedures to govern credit limits and processes to manage credit risk, concentration risk and counterparty risk with regards to all the Group’s material businesses with credit exposures in scope, including bonds, loans, cash and equivalents, collateralized assets, reinsurance assets, and assets measured at fair value. The Group uses risk gradings aligned with the major credit rating agencies, and in case of specific asset portfolios like residential mortgage loans implements internal risk gradings that reflect its assessment of the probability of default of individual counterparties.
The credit grades are calibrated such that the risk of default increases exponentially at each higher risk grade. For example, this means that the difference in the Probability of Default (PD) between AAA and A grade is lower than the difference in the PD between BBB and B rating grade.
16.1.2 Recognition and measurement of expected credit losses
The estimation of credit exposure for risk management purposes is complex and requires the use of models, as the exposure varies with changes in market conditions, expected cash flows and the passage of time. The assessment of credit risk of a portfolio of assets entails further estimations as to the likelihood of defaults occurring, of the associated loss ratios and of default correlations between counterparties. Aegon measures credit risk using Probability of Default (PD), Exposure at Default (EAD) and Loss Given Default (LGD). Refer to note 16.1.3 Information about amounts arising from ECL for more details.
Losses as a result of credit risk are a natural part of investing in fixed-income securities. The amount of and compensation for this risk are related. A significant management measure to avoid excessive credit risk is to diversify and limit exposure to individual issuers.
16.1.2.1 Recognition of expected credit losses
IFRS 9 outlines a ‘three-stage’ model for impairment based on relative changes in credit quality since initial recognition:
| ◾ | A financial instrument that is not credit-impaired on initial recognition is classified in ‘Stage 1’. |
| ◾ | If a significant increase in credit risk (‘SICR’) since initial recognition is identified, the financial instrument is moved to ‘Stage 2’ but is not yet deemed to be credit-impaired (refer to “Significant increase in credit risk” for further details). |
| ◾ | If the financial instrument is credit-impaired, the financial instrument is then moved to ‘Stage 3’. |
Credit risk is continuously monitored by the Group in all the above stages.
Financial instruments in Stage 1 have their Expected Credit Loss (ECL) measured at an amount equal to the portion of lifetime expected credit losses that result from default events possible within the next 12 months. Financial instruments in Stages 2 or 3 have their ECL measured based on expected credit losses on a lifetime basis. Purchased or originated credit-impaired financial assets are those financial assets that are credit-impaired on initial recognition. Their ECL is always measured on a lifetime basis.
| Stage 1 Performing | Stage 2 Under-Performing | Stage 3 Non-Performing | Purchased or Originated Credit | |||||
| Impaired (POCI) | ||||||||
| ECL | 12 month ECL | Lifetime ECL | Lifetime ECL | Lifetime ECL | ||||
| Provision Trigger | N/A | Quantitative and Qualitative Triggers | Qualitative Triggers | Qualitative Triggers | ||||
| Days Past Due (‘DPD’) Backstop | Up to date and early arrears (< 30 DPD) | > 30 DPD (rebuttable presumption) | > 90 DPD (rebuttable presumption) | N/A | ||||
| Interest Income | Interest calculated on gross carrying amount | Interest calculated on gross carrying amount | Interest calculated on net carrying amount | Interest calculated on net carrying amount using a credit-adjusted effective interest rate | ||||
|
|
Unaudited | Page 82 of 131 |
Condensed consolidated interim financial information for the period ended June 30, 2023
Following this assessment, IFRS 9 requires the incorporation of multiple, forward looking macro- scenarios to derive the ECL provision.
IFRS 9 requires that the measurement of ECL represents an unbiased probability-weighted amount that is to be determined by:
| ◾ | evaluating a range of possible outcomes; |
| ◾ | use reasonable and supportable information available without undue cost and effort about past events; |
| ◾ | current conditions; and |
| ◾ | forecasts of future economic conditions |
When incorporating forward looking information, consideration should be given to the relevance of the information (and the availability of more relevant information) for each specific financial instrument or group of financial instruments. Forward looking information that is relevant for one financial instrument may not be relevant or as relevant for other financial instruments depending on the specific drivers of credit risk. To the extent relevant, forward-looking information used for the measurement of ECLs it needs to be consistent with that used for the assessment of a significant increase in credit risk. The models used by the Group generally employ a Probability of Default (PD) / Loss Given Default (LGD) / Exposure at Default (EAD) methodology; each model consists of multiple sub-models that are used to generate the measurement of expected credit loss. Credit losses are calculated as the product of projected PD, LGD and EAD and are discounted using an appropriate discount rate. The ECL is determined as the probability weighted discounted credit losses that are determined for different scenarios (i.e., base, positive, adverse).
Given the need to adapt the models to the different portfolio characteristics, all ECL models have different key judgements and assumptions. As such, the below paragraphs outline the key judgements and assumptions made by the Group in addressing the key requirements on a model-by-model basis.
The Group employs separate models to calculate ECL on each category of financial assets.
For bonds and private placements, the Group applies a global correlation model. It provides correlations of credit quality movements across different asset classes, linked with movements in the macro economy. Global correlation model is therefore used for determining the conditional PD and LGD, given a macroeconomic scenario. Unconditional PD and LGD curves are modelled with use of different methods for sovereign debt, corporate bonds and private placements. For commercial mortgage loans and mortgage-backed securities the parameters are estimated with commercial mortgage metrics which uses corporate bond PD and LGD estimates further adjusted with other assumptions based on debt service coverage and loan-to-value ratios.
The Group applies a separate model for asset-backed securities, which pools the instruments based on the underlying collateral and estimates credit loss parameters collectively. Collateralized debt (loan) obligations (CDOs and CLOs) are special types of asset-backed securities to which a different set of models are applied depending on region of the exposure.
|
|
Unaudited | Page 83 of 131 |
Condensed consolidated interim financial information for the period ended June 30, 2023
16.1.2.2 Significant increase in credit risk
Aegon considers a financial instrument to have experienced a significant increase in credit risk when one or more of the following quantitative, qualitative or backstop criteria have been met:
| Asset Class | Quantitative criteria | Qualitative criteria | Backstop criteria | |||
| Commercial mortgages | Relative change in Forward-in-Time Probability of Default | None | 60 days past due backstop | |||
| Private loans | Relative changes in rating | Watchlist approach | No other backstop applied | |||
| Debt securities | Relative changes in rating | Watchlist approach | No other backstop applied | |||
| Structured finance | Relative changes in rating | Watchlist approach | 30 days past due backstop | |||
| Deposits with financial institutions | Relative changes in rating | Watchlist approach | No other backstop applied | |||
| Loan commitments | Defined as for the respective loans to which the commitment relates | |||||
| Financial guarantees | Defined as for the respective loans to which the commitment relates | |||||
Depending on the original credit rating, a decline in rating by 6 notches from AAA; 5 from AA+ - A+; 4 from A – BB; 3 from BB- - B-; 2 from CCC+ and 1 from CCC is deemed significant increase in credit risk.
Quantitative criteria
For debt securities, private loans, structured finance securities and deposits with financial institutions the relative change of the credit rating is used as primary indicator to assess significant increase in credit risk, for this purpose external credit ratings are used.
Qualitative criteria
For debt securities, private loans, structured finance securities and deposits with financial institutions the watch-list approach is applied as an additional qualitative criterion.
The watch-list approach means exposure of instruments on the watch list are intensively monitored. Financial assets are added to the watch-list based on if their relative change in fair value has surpassed a predetermined threshold:
| ◾ | The fair value either drops to 80% and below the (amortized) cost price and stays there for six months; or |
| ◾ | The fair value falls by 20% over 3 months; or |
| ◾ | The fair value falls to 60% and below the (amortized) cost price. |
In relation to debt securities and private loans, where a watchlist is used to monitor credit risk, this assessment is performed at the counterparty level and on a periodic basis. The criteria used to identify SICR are monitored and reviewed periodically for appropriateness by the Group.
Backstop
A backstop is applied to exposures considered to have experienced a significant increase in credit risk if the borrower is more than 30 days past due on its contractual payments in case of structured finance and 60 days in case commercial mortgage loans. No backstop is applied to the other asset classes. Aegon has used the low credit risk exemption for debt instruments. Debt instruments that have a credit rating which responds with ‘investment grade’ (rating ‘BBB’ or higher) are considered as having low credit risk. As such, external and internal credit ratings are used respectively for these assets to assess whether a significant increase in credit risk has occurred.
Low credit risk exemption is applied for staging purposes on instruments rated BBB and higher. (IFRS 9 provides an exception for financial instruments that have low credit risk at the reporting date, commonly referred to as the “low credit risk exemption” or LCRE, it is an exception to the general model where entities have an option not to assess whether credit risk has increased significantly since initial recognition if the credit risk is considered low.)
|
|
Unaudited | Page 84 of 131 |
Condensed consolidated interim financial information for the period ended June 30, 2023
Loan commitments and financial guarantees
For loan commitments and financial guarantees, Aegon defines default in the same way as for the respective loan or financial instrument to which a commitment relates or a guarantee is issued for (considering the factors described above).
16.1.2.3 Definition of default and credit-impaired assets
Aegon assesses a financial instrument to be in default or credit-impaired using the following criteria:
| Asset Class | Quantitative criteria | Qualitative criteria | ||
| Commercial mortgages | 90 days past due backstop | Foreclosure
Sale at material credit-rated economic loss | ||
| Debt securities and private loans | 5 days past due backstop |
Rating falling to “D” (external or internal)
Breach of significant covenants without reasonably supportable waiver obtained
Distressed restructuring taking place
Bankruptcy or an equivalent of an injunction for the obligor was filed
Obligor was classified as default internally | ||
| Deposits with financial institution | 5 days past due backstop |
Rating falling to “D” (external or internal)
Breach of significant covenants without reasonably supportable waiver obtained
Distressed restructuring taking place
Bankruptcy or an equivalent of an injunction for the obligor was filed
Obligor was classified as default internally | ||
| Structured securities | 90 days past due backstop | Rating falling to “D” (external or internal)
Loss coverage ratio (Ratio of credit-related losses to the par value of a debt security) is below 1 | ||
| Receivables | 90 days past due backstop | |||
| Loan commitments | Defined as for the respective loans to which the commitment relates | Defined as for the respective loans to which the commitment relates | ||
| Financial guarantee contracts | Defined as for the respective exposures to which the financial guarantee relates | Defined as for the respective exposures to which the financial guarantee relates | ||
Distressed restructuring means material forgiveness, or postponements of principal, interest, or where relevant, fees which is likely to result in a diminished financial obligation.
In addition to the criteria included in the table above, Aegon identifies other indicators of unlikeliness to pay, which include but are not limited to the following:
| ◾ | a borrower’s sources of recurring income are no longer available to meet the payments of instalments; |
| ◾ | there are justified concerns about a borrower’s future ability to generate stable and sufficient cash flows; |
| ◾ | the borrower’s overall leverage level has significantly increased beyond applicable limits or there are justified expectations of such changes to leverage; |
| ◾ | for the exposures to an individual: default of a company fully owned by a single individual where this individual provided the institution with a personal guarantee for all obligations of a company; |
| ◾ | material fraud; or |
| ◾ | death of a client. |
All the criteria above have been applied to the financial instruments held by Aegon and are consistent with the definition of default used for internal credit risk management purposes. The definition of default has been applied consistently to model the Probability of Default (PD), Exposure at Default (EAD) throughout the Aegon’s expected loss calculations.
An instrument is considered to no longer be in default (i.e. to have ‘cured’) when it no longer meets any of the default criteria for a consecutive period of six months and an assessment has shown the obligor is no longer unlikely to pay. This period of six months considers the likelihood of a financial instrument returning to default status after cure using different possible cure definitions.
|
|
Unaudited | Page 85 of 131 |
Condensed consolidated interim financial information for the period ended June 30, 2023
16.1.2.4 Measuring ECL – inputs, assumptions and estimation techniques
The ECL is measured on either a ‘12-month basis’ (Stage 1) or ‘lifetime basis’ (Stages 2 and 3), depending on whether a significant increase in credit risk has occurred since initial recognition or whether an asset is considered to be credit-impaired.
The expected credit losses are the discounted product of the Probability of Default (PD), Exposure at Default (EAD), and Loss Given Default (LGD), defined as follows:
| ◾ | The PD represents the likelihood of a borrower defaulting on its financial obligation (as per “Definition of default and credit-impaired” above), either over the next 12 months (12M PD), or over the remaining lifetime (Lifetime PD) of the obligation. |
| ◾ | EAD is based on the amounts the Group expects to be owed at the time of default. |
| ◾ | Loss Given Default (LGD) represents Aegon’s expectation of the extent of loss on a defaulted exposure. LGD varies by type of counterparty, type and seniority of claim and availability of collateral or other credit support. LGD is expressed as a percentage loss per unit of exposure at the time of default (EAD). |
The discount rate used in the ECL calculation is the original effective interest rate or an approximation thereof. The lifetime PD is calculated for a financial instrument that results in default by summing the probabilities of all future developments which end-up in the ECL. All possible future developments are enumerated and for each future development a probability is calculated. The possibility of full prepayment is included among all possible future developments. For each possible future development the probability is estimated using statistical modelling techniques.
Forward-looking economic information is included in determining the 12-month and lifetime ECL, and lifetime PD by using a set of variables describing the state of the macro economy as input in the calculation of the probability of default and prepayment. As described above, and subject to using a maximum of a 12-month PD for financial assets for which credit risk has not significantly increased, the Group measures ECL considering the risk of default over the maximum contractual period (including any borrower’s extension options) over which Aegon is exposed to credit risk, even if the Group considers a longer period.
There have been no significant changes in estimation techniques or significant assumptions made during the reporting period.
16.1.2.5 Forward-looking information incorporated in the ECL models
The assessment of significant increase in credit risk (SICR) and the calculation of ECL both incorporate forward-looking information. Aegon has performed historical analysis and identified the key economic variables impacting credit risk and expected credit losses for each portfolio.
These economic variables and their associated impact on the ECL and Lifetime PD vary by financial instrument. Expert judgment has also been applied in this process. Forecasts of these economic variables (the “base economic scenario”) give the best estimate view of the economy over the next five years. After five years, to project the economic variables out for the full remaining lifetime of each instrument, a mean reversion approach has been used, which means that economic variables tend to either a long run average rate (e.g. for unemployment) or a long run average growth rate (e.g. GDP) over a period of three years. Statistical regression analysis has been performed to understand the impact changes in these macro-economic variables have had historically on default and prepayment rates.
Using the base scenario as a starting point, three macro-economic scenarios are generated by applying shocks to the macro-economic variables in a positive and negative direction, taking into account their correlation as historically observed, resulting in a positive, neutral and negative scenario. The shocks applied correspond to the historical average deviance from the long term mean observed in the best/worst 10% of the historically observed quarters. The ECL is calculated for each of the three scenarios, multiplied by the scenario weighting, and summed. The use of multiple economic scenarios ensures that the ECL represents the best estimate of expected credit loss and is not merely the credit loss in the most likely scenario.
|
|
Unaudited | Page 86 of 131 |
Condensed consolidated interim financial information for the period ended June 30, 2023
As with any economic forecasts, the projections and likelihoods of occurrence are subject to a high degree of inherent uncertainty, and therefore, the actual outcomes may be significantly different to those projected. The Group considers these forecasts to represent its best estimate of the possible outcomes.
Economic variable assumptions
The most significant period-end assumptions used for the ECL estimate are set out below. The scenarios “base”, “upside” and “downside” were used for all portfolios.
| June 30, 2023 | 2023 | 2024 | 2025 | 2026 | 2027 | Units | ||||||||
| Interest rates |
Base
|
3.94 | 3.86 | 3.86 | 3.99 | 4.03 | Interest Rates: 10-Year Treasury Constant Maturities, (% p.a., NSA) | |||||||
|
Upside
|
4.04 | 3.96 | 3.86 | 3.98 | 4.03 | Interest Rates: 10-Year Treasury Constant Maturities, (% p.a., NSA) | ||||||||
|
Downside
|
2.13 | 2.59 | 3.34 | 3.78 | 3.97 | Interest Rates: 10-Year Treasury Constant Maturities, (% p.a., NSA) | ||||||||
| Unemployment rate |
Base
|
3.82 | 4.22 | 4.19 | 4.15 | 4.13 | (%, SA) | |||||||
|
Upside
|
3.04 | 3.33 | 3.59 | 3.53 | 3.58 | (%, SA) | ||||||||
|
Downside
|
6.52 | 7.64 | 6.34 | 5.48 | 4.68 | (%, SA) | ||||||||
| House Price Index |
Base
|
385.74 | 372.68 | 371.61 | 379.79 | 391.66 | Existing Single-Family Home Price: Median, (Ths. USD, SA) | |||||||
|
Upside
|
396.53 | 400.29 | 399.99 | 413.28 | 428.25 | Existing Single-Family Home Price: Median, (Ths. USD, SA) | ||||||||
|
Downside
|
341.01 | 331.35 | 339.24 | 347.82 | 357.93 | Existing Single-Family Home Price: Median, (Ths. USD, SA) | ||||||||
| Domestic GDP |
Base
|
20,410.05 | 20,741.30 | 21,301.03 | 21,891.77 | 22,463.93 | Bil. Ch. 2012 USD, SAAR | |||||||
|
Upside
|
20,705.70 | 21,265.32 | 21,796.25 | 22,379.68 | 22,937.14 | Bil. Ch. 2012 USD, SAAR | ||||||||
|
Downside
|
20,009.19 | 19,956.30 | 20,566.77 | 21,238.89 | 21,809.39 | Bil. Ch. 2012 USD, SAAR | ||||||||
| Equity |
Base
|
4,343.49 | 4,498.93 | 4,655.70 | 4,905.28 | 5,206.60 | Standard & Poor’s (S&P); Moody’s Analytics Forecasted | |||||||
|
Upside
|
4,690.53 | 4,727.85 | 4,923.08 | 5,047.37 | 5,311.44 | Standard & Poor’s (S&P); Moody’s Analytics Forecasted | ||||||||
|
Downside
|
3,062.99 | 2,836.89 | 3,326.54 | 4,000.34 | 4,509.36 | Standard & Poor’s (S&P); Moody’s Analytics Forecasted | ||||||||
| December 31, 2022 |
2022 | 2023 | 2024 | 2025 | 2026 | Units | ||||||||
| Interest rates |
Base
|
3.83 | 3.94 | 3.86 | 3.86 | 3.99 | Interest Rates: 10-Year Treasury Constant Maturities, (% p.a., NSA) | |||||||
|
Upside
|
3.83 | 4.04 | 3.96 | 3.86 | 3.98 | Interest Rates: 10-Year Treasury Constant Maturities, (% p.a., NSA) | ||||||||
|
Downside
|
3.83 | 2.13 | 2.59 | 3.34 | 3.78 | Interest Rates: 10-Year Treasury Constant Maturities, (% p.a., NSA) | ||||||||
| Unemployment rate |
Base
|
3.60 | 3.82 | 4.22 | 4.19 | 4.15 | (%, SA) | |||||||
|
Upside
|
3.60 | 3.04 | 3.33 | 3.59 | 3.53 | (%, SA) | ||||||||
|
Downside
|
3.60 | 6.52 | 7.64 | 6.34 | 5.48 | (%, SA) | ||||||||
| House Price Index |
Base
|
385.24 | 385.74 | 372.68 | 371.61 | 379.79 | Existing Single-Family Home Price: Median, (Ths. USD, SA) | |||||||
|
Upside
|
385.24 | 396.53 | 400.29 | 399.99 | 413.28 | Existing Single-Family Home Price: Median, (Ths. USD, SA) | ||||||||
|
Downside
|
385.24 | 341.01 | 331.35 | 339.24 | 347.82 | Existing Single-Family Home Price: Median, (Ths. USD, SA) | ||||||||
| Domestic GDP |
Base
|
20,182.49 | 20,410.05 | 20,741.30 | 21,301.03 | 21,891.77 | Bil. Ch. 2012 USD, SAAR | |||||||
|
Upside
|
20,182.49 | 20,705.70 | 21,265.32 | 21,796.25 | 22,379.68 | Bil. Ch. 2012 USD, SAAR | ||||||||
|
Downside
|
20,182.49 | 20,009.19 | 19,956.30 | 20,566.77 | 21,238.89 | Bil. Ch. 2012 USD, SAAR | ||||||||
| Equity |
Base
|
3,851.97 | 4,343.49 | 4,498.93 | 4,655.70 | 4,905.28 | Standard & Poor’s (S&P); Moody’s Analytics Forecasted | |||||||
|
Upside
|
3,851.97 | 4,690.53 | 4,727.85 | 4,923.08 | 5,047.37 | Standard & Poor’s (S&P); Moody’s Analytics Forecasted | ||||||||
|
Downside
|
3,851.97 | 3,062.99 | 2,836.89 | 3,326.54 | 4,000.34 | Standard & Poor’s (S&P); Moody’s Analytics Forecasted | ||||||||
The weightings assigned to each economic scenario were as follows:
| Base | Upside | Downside | ||||||||||
| At June 30, 2023 | 40 | 30 | 30 | |||||||||
| At December 31, 2022 | 40 | 30 | 30 | |||||||||
|
|
Unaudited | Page 87 of 131 |
Condensed consolidated interim financial information for the period ended June 30, 2023
Other forward-looking considerations not otherwise incorporated within the above scenarios, such as the impact of any regulatory, legislative or political changes, have also been considered, but are not deemed to have a material impact, and therefore, no adjustment has been made to the ECL for such factors. This process is reviewed and monitored for appropriateness on a quarterly basis.
16.1.2.6 Write-off policy
The Group writes-off financial assets, in whole or in part, when it has exhausted all practical recovery efforts and has concluded there is no reasonable expectation of recovery. Indicators that there is no reasonable expectation of recovery include (i) ceasing enforcement activity; and (ii) where Aegon’s recovery method is foreclosing on collateral and the value of the collateral is such that there is no reasonable expectation of recovering in full.
The Group may write-off financial assets that are still subject to enforcement activity. The outstanding contractual amounts of such assets written-off during the first half year in 2023 is not material. The Group still seeks to recover amounts it is legally owed in full, but which have been partially written off due to no reasonable expectation of full recovery.
16.1.2.7 Modification of financial assets
The Group has the option to modify the terms of loans provided to customers due to commercial renegotiations, or for distressed loans, with a view to maximizing recovery. Such restructuring activities include extended payment term and penalty interest arrangements. Restructuring policies and practices are based on indicators or criteria which, in the judgement of management, indicate that payment will most likely continue. These policies are kept under continuous review. The risk of default of such assets after modification is assessed at the reporting date and compared with the risk under the original terms at initial recognition, when the modification is not substantial and so does not result in derecognition of the original asset. The Group monitors the subsequent performance of modified assets. Aegon may determine that the credit risk has significantly improved after restructuring, so that the assets are moved from Stage 3 or Stage 2 (Lifetime ECL) to Stage 1 (12-month ECL). This is only the case for assets which have performed in accordance with the new terms for three consecutive months or more.
16.1.3 Information about amounts arising from ECL
Aegon regularly monitors industry sectors and individual debt securities for sources of changes in the ECL allowance. These sources may include one or more of the following:
| ◾ | Transfers between Stages 1, 2 and 3 due to financial instruments experiencing significant increases (or decreases) of credit risk or becoming credit-impaired in the period, and the consequent “step up” (or “step down”) between 12-month and lifetime ECL; |
| ◾ | Additional allowances for new financial instruments recognized during the period, as well as releases for financial instruments de-recognized in the period; |
| ◾ | Impact on the measurement of ECL due to changes in PDs, EADs and LGDs in the period, arising from regular refreshing of inputs to models; |
| ◾ | Impacts on the measurement of ECL due to changes made to models and assumptions; |
| ◾ | Discount unwind within ECL due to the passage of time, as ECL is measured on a present value basis; |
| ◾ | Foreign exchange retranslations for assets denominated in foreign currencies and other movements; and, |
| ◾ | Financial assets derecognized during the period and write-offs of allowances related to assets that were written off during the period. |
Additionally, for asset-backed securities, cash flow trends and underlying levels of collateral are monitored. Furthermore, quality ratings of investment portfolios are based on a composite of the main rating agencies (S&P, Moody’s and Fitch) and Aegon’s internal rating of the counterparty. The following tables explain the changes in the loss allowance changes between the beginning and the end of the annual period due to these factors:
|
|
Unaudited | Page 88 of 131 |
Condensed consolidated interim financial information for the period ended June 30, 2023
| EUR millions | 2023 | |||||||||||||||||||||||||||||||||||
| First
Half year |
||||||||||||||||||||||||||||||||||||
| Gross amount | ECL | |||||||||||||||||||||||||||||||||||
| Loans
|
Stage 1
(12- month ECL)
|
Stage 2
(Lifetime ECL)
|
Stage 3
(Lifetime
|
Total gross amount
|
Stage 1
(12- month ECL)
|
Stage 2
(Lifetime ECL)
|
Stage 3
(Lifetime ECL) ¹
|
Total ECL
|
Net carrying amount
|
|||||||||||||||||||||||||||
| Balance at December 31, prior year |
10,417 | 2 | - | 10,419 | (12) | (0) | - | (12) | 10,407 | |||||||||||||||||||||||||||
|
Acquis/addition/acquired/deposits-Operating |
371 | - | - | 371 | 0 | - | - | 0 | 371 | |||||||||||||||||||||||||||
|
Disposal/redemption/repayment/withdrawal/sale- Operating |
(303) | (0) | - | (303) | - | - | - | - | (303) | |||||||||||||||||||||||||||
| Transfers: |
(4) | 4 | - | - | 0 | (0) | - | - | - | |||||||||||||||||||||||||||
| ECL transfer from stage 1 to stage 2 |
(4) | 4 | - | - | 0 | (0) | - | - | - | |||||||||||||||||||||||||||
| ECL transfer from stage 1 to stage 3 |
- | - | - | - | - | - | - | - | - | |||||||||||||||||||||||||||
| ECL transfer from stage 2 to stage 1 |
- | - | - | - | - | - | - | - | - | |||||||||||||||||||||||||||
| ECL transfer from stage 2 to stage 3 |
- | - | - | - | - | - | - | - | - | |||||||||||||||||||||||||||
| ECL transfer from stage 3 to stage 2 |
- | - | - | - | - | - | - | - | - | |||||||||||||||||||||||||||
| ECL transfer from stage 3 to stage 1 |
- | - | - | - | - | - | - | - | - | |||||||||||||||||||||||||||
| Amortizations through income statement |
(0) | - | - | (0) | - | - | - | - | (0) | |||||||||||||||||||||||||||
| Realized gains and losses through income statement |
1 | - | - | 1 | - | - | - | - | 1 | |||||||||||||||||||||||||||
| Change in models |
- | - | - | - | 0 | 0 | - | 0 | 0 | |||||||||||||||||||||||||||
| Other movements |
(0) | - | - | (0) | - | - | - | - | (0) | |||||||||||||||||||||||||||
| CTA on opening balance |
(226) | (0) | - | (226) | 0 | 0 | - | 0 | (226) | |||||||||||||||||||||||||||
| CTA on movements |
(1) | (0) | - | (1) | (0) | - | - | (0) | (1) | |||||||||||||||||||||||||||
| Ending balance |
10,255 | 6 | - | 10,261 | (11) | (0) | - | (11) | 10,250 | |||||||||||||||||||||||||||
1 Also includes purchased credit impaired items.
|
|
Unaudited | Page 89 of 131 |
Condensed consolidated interim financial information for the period ended June 30, 2023
| EUR millions | 2022 | |||||||||||||||||||||||||||||||||||
| Full
year |
||||||||||||||||||||||||||||||||||||
| Gross amount | ECL | |||||||||||||||||||||||||||||||||||
| Loans
|
Stage 1
(12-month ECL)
|
Stage 2
(Lifetime ECL)
|
Stage 3
(Lifetime
|
Total gross amount
|
Stage 1
(12- month ECL)
|
Stage 2
(Lifetime ECL)
|
Stage 3
(Lifetime ECL) ¹
|
Total ECL
|
Net carrying amount
|
|||||||||||||||||||||||||||
| Balance at December 31, prior year |
24,878 | 526 | 137 | 25,541 | (30) | (26) | (93) | (150) | 25,392 | |||||||||||||||||||||||||||
| Corrections opening balance |
(27) | - | - | (27) | - | - | - | - | (27) | |||||||||||||||||||||||||||
|
Acquis/addition/acquired/deposits-Operating |
3,803 | 118 | 2 | 3,922 | 0 | 0 | - | 0 | 3,923 | |||||||||||||||||||||||||||
|
Disposal/redemption/repayment/withdrawal/sale- Operating |
(2,893) | (113) | (57) | (3,064) | 11 | 4 | 30 | 44 | (3,019) | |||||||||||||||||||||||||||
| Transfers: |
(556) | 540 | 16 | - | (0) | 0 | - | - | - | |||||||||||||||||||||||||||
| ECL transfer from stage 1 to stage 2 |
(569) | 569 | - | - | - | - | - | - | - | |||||||||||||||||||||||||||
| ECL transfer from stage 1 to stage 3 |
(16) | - | 16 | - | - | - | - | - | - | |||||||||||||||||||||||||||
| ECL transfer from stage 2 to stage 1 |
29 | (29) | - | - | (0) | 0 | - | - | - | |||||||||||||||||||||||||||
| ECL transfer from stage 2 to stage 3 |
- | - | - | - | - | - | - | - | - | |||||||||||||||||||||||||||
| ECL transfer from stage 3 to stage 2 |
- | - | - | - | - | - | - | - | - | |||||||||||||||||||||||||||
| ECL transfer from stage 3 to stage 1 |
- | - | - | - | - | - | - | - | - | |||||||||||||||||||||||||||
| Impact on year end ECL |
- | - | - | - | (7) | 12 | (2) | 3 | 3 | |||||||||||||||||||||||||||
| Amortizations through income statement |
(2) | (0) | (0) | (2) | - | - | - | - | (2) | |||||||||||||||||||||||||||
| Realized gains and losses through income statement |
36 | - | - | 36 | - | - | - | - | 36 | |||||||||||||||||||||||||||
| Change in models |
- | - | - | - | 10 | 0 | - | 10 | 10 | |||||||||||||||||||||||||||
| Other movements |
(1,474) | - | - | (1,474) | - | - | - | - | (1,474) | |||||||||||||||||||||||||||
| Transfer to/from other headings |
(2) | - | - | (2) | - | - | - | - | (2) | |||||||||||||||||||||||||||
| Transfers to disposal groups |
(13,945) | (1,062) | (94) | (15,102) | 6 | 11 | 66 | 82 | (15,019) | |||||||||||||||||||||||||||
| Net exchange differences |
(15) | (8) | (4) | (27) | - | - | - | - | (27) | |||||||||||||||||||||||||||
| CTA on opening balance |
619 | 2 | - | 621 | (1) | (0) | - | (1) | 620 | |||||||||||||||||||||||||||
| CTA on movements |
(5) | 0 | - | (4) | (0) | (0) | - | (0) | (4) | |||||||||||||||||||||||||||
| Ending balance |
10,417 | 2 | - | 10,419 | (12) | (0) | - | (12) | 10,407 | |||||||||||||||||||||||||||
1 Also includes purchased credit impaired items.
|
|
Unaudited | Page 90 of 131 |
Condensed consolidated interim financial information for the period ended June 30, 2023
| EUR millions | 2023 | |||||||||||||||||||||||||||||||
| First
Half year |
||||||||||||||||||||||||||||||||
| Gross amount | ECL | |||||||||||||||||||||||||||||||
| Debt securities
|
Stage 1
(12- month ECL)
|
Stage 2
(Lifetime ECL)
|
Stage 3
(Lifetime
|
Total gross amount
|
Stage 1
(12- month ECL)
|
Stage 2
(Lifetime ECL)
|
Stage 3
(Lifetime ECL) ¹
|
Total ECL
|
||||||||||||||||||||||||
| Balance at December 31, prior year |
50,666 | 413 | 528 | 51,607 | (156) | (32) | (87) | (276) | ||||||||||||||||||||||||
|
Acquis/addition/acquired/deposits-Operating |
2,068 | 4 | 16 | 2,089 | (12) | (1) | (8) | (21) | ||||||||||||||||||||||||
|
Disposal/redemption/repayment/withdrawal/sale-Operating |
(2,734) | (35) | (98) | (2,866) | 7 | 2 | 24 | 33 | ||||||||||||||||||||||||
| Disposal of a business |
(226) | - | - | (226) | - | - | - | - | ||||||||||||||||||||||||
| Transfers: |
(1) | (20) | 21 | - | (19) | 3 | 17 | - | ||||||||||||||||||||||||
| ECL transfer from stage 1 to stage 2 |
(34) | 34 | - | - | 1 | (1) | - | - | ||||||||||||||||||||||||
| ECL transfer from stage 1 to stage 3 |
(21) | - | 21 | - | 1 | - | (1) | - | ||||||||||||||||||||||||
| ECL transfer from stage 2 to stage 1 |
31 | (31) | - | - | (1) | 1 | - | - | ||||||||||||||||||||||||
| ECL transfer from stage 2 to stage 3 |
- | (23) | 23 | - | - | 2 | (2) | - | ||||||||||||||||||||||||
| ECL transfer from stage 3 to stage 2 |
- | - | - | - | - | - | - | - | ||||||||||||||||||||||||
| ECL transfer from stage 3 to stage 1 |
23 | - | (23) | - | (20) | - | 20 | - | ||||||||||||||||||||||||
| Impact on year end ECL |
- | - | - | - | 18 | (2) | (30) | (14) | ||||||||||||||||||||||||
| Amortizations through income statement |
75 | (1) | 17 | 91 | - | - | - | - | ||||||||||||||||||||||||
| Unrealized gains/losses through equity |
556 | 24 | 15 | 595 | - | - | - | - | ||||||||||||||||||||||||
| Movements related to fair value hedges |
- | - | - | - | - | - | - | - | ||||||||||||||||||||||||
| Change in models |
- | - | - | - | (33) | (1) | 3 | (31) | ||||||||||||||||||||||||
| Other movements |
(10) | - | - | (10) | - | - | - | - | ||||||||||||||||||||||||
| Transfer to/from other headings |
(43) | - | - | (43) | - | - | - | - | ||||||||||||||||||||||||
| CTA on opening balance |
(1,079) | (9) | (11) | (1,100) | 3 | 1 | 2 | 6 | ||||||||||||||||||||||||
| CTA on movements |
(3) | - | - | (2) | - | - | - | - | ||||||||||||||||||||||||
| Ending balance |
49,270 | 377 | 488 | 50,134 | (191) | (30) | (81) | (301) | ||||||||||||||||||||||||
1 Also includes purchased credit impaired items.
|
|
Unaudited | Page 91 of 131 |
Condensed consolidated interim financial information for the period ended June 30, 2023
| EUR millions | 2022 | |||||||||||||||||||||||||||||||
| Full
year |
||||||||||||||||||||||||||||||||
| Gross amount | ECL | |||||||||||||||||||||||||||||||
| Debt securities
|
Stage 1
(12-month ECL)
|
Stage 2
(Lifetime ECL)
|
Stage 3
(Lifetime
|
Total gross amount
|
Stage 1
(12- month ECL)
|
Stage 2
(Lifetime ECL)
|
Stage 3
(Lifetime ECL) ¹
|
Total ECL
|
||||||||||||||||||||||||
| Balance at December 31, prior year |
70,132 | 259 | 583 | 70,974 | (161) | (13) | (40) | (214) | ||||||||||||||||||||||||
|
Acquis/addition/acquired/deposits-Operating |
6,412 | 45 | 45 | 6,502 | (29) | (2) | (24) | (56) | ||||||||||||||||||||||||
| Acquisitions through business combinations |
(1) | - | - | (1) | - | - | - | - | ||||||||||||||||||||||||
|
Disposal/redemption/repayment/withdrawal/sale-Operating |
(11,191) | (47) | (142) | (11,379) | 33 | 6 | 20 | 58 | ||||||||||||||||||||||||
| Disposal of a business |
(664) | - | - | (664) | - | - | - | - | ||||||||||||||||||||||||
| Transfers: |
(266) | 182 | 83 | - | (21) | (4) | 25 | - | ||||||||||||||||||||||||
| ECL transfer from stage 1 to stage 2 |
(228) | 228 | - | - | 7 | (7) | - | - | ||||||||||||||||||||||||
| ECL transfer from stage 1 to stage 3 |
(77) | - | 77 | - | 3 | - | (3) | - | ||||||||||||||||||||||||
| ECL transfer from stage 2 to stage 1 |
33 | (33) | - | - | (10) | 10 | - | - | ||||||||||||||||||||||||
| ECL transfer from stage 2 to stage 3 |
- | (15) | 15 | - | - | 1 | (1) | - | ||||||||||||||||||||||||
| ECL transfer from stage 3 to stage 2 |
- | 2 | (2) | - | - | (8) | 8 | - | ||||||||||||||||||||||||
| ECL transfer from stage 3 to stage 1 |
6 | - | (6) | - | (21) | - | 21 | - | ||||||||||||||||||||||||
| Impact on year end ECL |
- | - | - | - | 26 | (16) | (82) | (72) | ||||||||||||||||||||||||
| Amortizations through income statement |
267 | 2 | 58 | 327 | - | - | - | - | ||||||||||||||||||||||||
| Unrealized gains/losses through equity |
(16,599) | (94) | (149) | (16,842) | - | - | - | - | ||||||||||||||||||||||||
| Movements related to fair value hedges |
(12) | - | - | (12) | - | - | - | - | ||||||||||||||||||||||||
| Change in models |
- | - | - | - | 5 | (2) | 16 | 20 | ||||||||||||||||||||||||
| Other movements |
(52) | 50 | 10 | 7 | (0) | - | - | (0) | ||||||||||||||||||||||||
| Transfers to disposal groups |
(1,884) | - | - | (1,884) | 1 | - | - | 1 | ||||||||||||||||||||||||
| Net exchange differences |
36 | - | - | 36 | - | - | - | - | ||||||||||||||||||||||||
| CTA on opening balance |
4,182 | 17 | 38 | 4,238 | (10) | (1) | (3) | (14) | ||||||||||||||||||||||||
| CTA on movements |
307 | (2) | 1 | 306 | (0) | 0 | 1 | 1 | ||||||||||||||||||||||||
| Ending balance |
50,666 | 413 | 528 | 51,607 | (156) | (32) | (87) | (276) | ||||||||||||||||||||||||
1 Also includes purchased credit impaired items.
The total amount of undiscounted ECL at June 30, 2023 for purchased or originated credit-impaired financial assets recognized during the period was EUR 2 million (December 31, 2022: EUR 1 million).
16.1.4 Collateral and other credit enhancements
Aegon employs a range of policies and practices to mitigate credit risk and the most common of these is accepting collateral for funds advanced. The Group has internal policies on the acceptability of specific classes of collateral or credit risk mitigation.
17. Capital management and solvency
| EUR millions
|
June 30, 2023 ¹
|
December 31, 2022
|
||||||
| Group Own Funds |
16,401 | 16,332 | ||||||
| Group SCR |
8,117 | 7,844 | ||||||
|
Group Solvency II ratio |
202% | 208% | ||||||
¹ The Solvency II ratios are estimates, are not final until filed with the respective supervisory authority.
|
|
Unaudited | Page 92 of 131 |
Condensed consolidated interim financial information for the period ended June 30, 2023
The Group Solvency II ratio decreased by 6%-points. Eligible Own Funds increased with EUR 69 million mainly resulting from strong operating capital generation partly offset by the impact from foreseeable interim dividend 2023 of 14 cents per share and the impact on Eligible Own Funds from an increased DTA haircut. The SCR increased with EUR 273 million mainly as a result of the impact on the SCR of the New Business strain (being higher than the release of required from the existing business), assumption changes and market impacts. The 1H 2023 Group Solvency II ratio does not reflect the EUR 1.5 billion share buyback, which has commenced in July 2023, soon after closing the a.s.r. transaction.
The table below provides the composition of Aegon’s Eligible Own Funds across Tiers:
| EUR millions | June 30, 2023 | December 31, 2022 | ||||||
| Tier 1 - unrestricted |
11,852 | 11,762 | ||||||
| Tier 1 - restricted |
1,816 | 1,822 | ||||||
| Tier 2 |
2,155 | 2,195 | ||||||
| Tier 3 |
578 | 552 | ||||||
|
Total Eligible Own Funds |
16,401 | 16,332 | ||||||
18. Commitments and contingencies
The information given in this section is limited to the material changes that have taken place on the cases listed in Aegon’s 2022 Integrated Annual Report, and any new material cases that have commenced after the Aegon’s 2022 Integrated Annual Report was published.
Aegon Levensverzekering N.V. offers the product Uitkerend Beleggingspensioen (‘UBP’), a product that offers variable pension benefits, to its clients who are in the pay-out phase of their pension. During the first six months of 2023, UBP policyholders were informed on the decline of their pension capital and future benefits, which resulted in three customers filing complaint with KiFiD against Aegon Levensverzekering N.V. The complaints relate to the performance of these clients’ respective investment portfolios as well as the decline in their pension payment as a consequence.
In 2019 Optas N.V., a life insurance company owned by Aegon merged with Aegon Levensverzekering N.V. following approval of the merger by DNB. A number of policyholders filed complaints against DNB’s decision to approve the merger and appealed this decision at the administrative Court after DNB persisted in its approval. On February 13, 2023, the administrative Court annulled DNB’s decision to approve the merger as the court is of the opinion that in the interest of policyholders, among other things, DNB should have required Aegon to individually inform all policyholders in writing regarding the merger and the possibility to oppose the merger. In the first six-month period of 2023, Aegon and a group of policyholders have filed appeals. The appeals are pending at the Dutch Trade and Industry Appeals Tribunal (CBb). The Financial Markets Supervision act provides that the annulment of DNB’s approval from an administrative law perspective in itself does not affect the legality of the merger from a civil law perspective. This has been confirmed by a ruling of the civil Court in a civil case opposing the merger brought against Aegon by three policyholders. The policyholders were unsuccessful in first instance and the case is now under appeal. Although Aegon does not expect the pending litigation at the administrative Court and the civil Court to have a material, if any, impact there can be no assurances that these matters will not ultimately result in a material adverse effect on Aegon’s business, results of operations and financial position.
19. Companies and businesses acquired and divested
On June 1, 2023 Aegon announced the completion of the divestment of its businesses in Poland and Romania to Vienna Insurance Group AG Wiener Versicherung Gruppe (VIG) for EUR 125 million. The book loss on the transaction is EUR 78 million and is recorded in Aegon’s 2023 results. This was the final step to complete the full sale of Aegon’s insurance, pension and asset management business in Central and Eastern Europe to VIG, following the closings of the divestments of the Hungarian and Turkish businesses.
|
|
Unaudited | Page 93 of 131 |
Condensed consolidated interim financial information for the period ended June 30, 2023
On April 4, 2023 Aegon announced the sale of its UK individual protection book to Royal London. Under the terms of the agreement, Aegon UK will initially reinsure the portfolio to Royal London, followed by a Part VII transfer of the legal ownership of the individual protection book in 2024. The transfer is subject to court approval. Aegon UK’s individual protection business is a portfolio of life, critical illness, and income protection policies for 400,000 high-net worth individual customers, that was sold via independent financial advisers. The portfolio closed to new business on April 4, 2023. The sale does not have a material impact on Aegon’s capital position or results.
20. Discontinued operations
On October 27, 2022, Aegon announced it has reached an agreement with a.s.r. to combine its Dutch pension, life and non-life insurance, banking, and mortgage origination activities with ASR Nederland N.V. (‘a.s.r’). On July 4, 2023, Aegon announced the completion of this transaction and as a result Aegon received EUR 2.2 billion in gross cash proceeds, and a 29.99% strategic stake in a.s.r., with associated governance rights.
Aegon the Netherlands has been reported as held for sale and discontinued operations. This note includes the disclosures related to Aegon the Netherlands qualified as held for sale and discontinued operations as per June 30, 2023.
|
Income statement of discontinued operations |
||||||||
| EUR millions | 1H 2023 |
1H 2022 |
||||||
| Discontinued operations |
||||||||
| Insurance revenue |
1,400 | 1,482 | ||||||
| Insurance service expenses |
(1,327) | (1,419) | ||||||
| Net expenses on reinsurance held |
(20) | 1 | ||||||
| Insurance service result |
52 | 64 | ||||||
| Interest revenue on financial instruments - effective interest method |
42 | (5) | ||||||
| Interest revenue on financial instruments measured at FVPL |
582 | 633 | ||||||
| Other investment income |
168 | 161 | ||||||
| Results from financial transactions |
614 | (15,968) | ||||||
| Impairment losses / (reversals) |
- | 1 | ||||||
| Insurance finance income / (expenses) |
(1,110) | 13,975 | ||||||
| Net reinsurance finance income / (expenses) on reinsurance held |
(6) | 103 | ||||||
| Insurance net investment result |
289 | (1,100) | ||||||
| Interest revenue on financial instruments - effective interest method |
273 | 252 | ||||||
| Interest revenue on financial instruments measured at FVPL |
137 | (128) | ||||||
| Other investment income |
11 | 8 | ||||||
| Results from financial transactions |
(148) | (36) | ||||||
| Impairment losses / (reversals) |
3 | 6 | ||||||
| Investment contract income / (expenses) |
(25) | 148 | ||||||
| Interest expenses |
(10) | - | ||||||
| Other net investment result |
240 | 250 | ||||||
| Interest charges |
(55) | (39) | ||||||
| Financing net investment result |
(55) | (39) | ||||||
| Total net investment result |
474 | (888) | ||||||
| Fee and commission income |
165 | 157 | ||||||
| Other operating expenses |
(288) | (227) | ||||||
| Other income / (charges) |
3 | 20 | ||||||
| Other result |
(121) | (48) | ||||||
| Result before share in profit / (loss) of joint ventures, associates and tax |
405 | (873) | ||||||
| Share in profit / (loss) of joint ventures |
4 | 24 | ||||||
| Share in profit / (loss) of associates |
15 | 86 | ||||||
| Result before tax from discontinued operations |
425 | (762) | ||||||
| Income tax (expense) / benefit |
(77) | 228 | ||||||
| Result from discontinued operations |
348 | (533) | ||||||
|
Impairment loss on remeasurement of the disposal group |
(430) | - | ||||||
|
Net result from discontinued operations after remeasurement |
(82) | (533) | ||||||
|
|
Unaudited | Page 94 of 131 |
Condensed consolidated interim financial information for the period ended June 30, 2023
20.1 Impairment loss
Upon classification as held for sale, as per December 31, 2022, the carrying amount of Aegon the Netherlands was compared to the fair value less cost to sell, which is estimated by reference to the fair value of the consideration to which Aegon N.V. is entitled under the terms and conditions of the sales agreement. The fair value less cost to sell is lower than the carrying value and this impairment loss is recognized through a reduction of the carrying value of Aegon the Netherlands.
Aegon the Netherlands’s carrying amount has been impacted by the adoption of IFRS 9 “Financial instruments” and IFRS 17 “Insurance contracts” per January 1, 2023. The measurement category and the carrying amount of financial assets and liabilities in accordance with IAS 39 and IFRS 9 on January 1, 2023 are detailed in the table below, together with a reconciliation of the carrying amounts of financial assets, from their previous measurement category in accordance with IAS 39 to their new measurement categories upon transition:
| IAS 39 | Remeasurement | IFRS 9 | ||||||||||||||||||||||||||
| Reclassification | ||||||||||||||||||||||||||||
| January 1, 2023 | Category | Amount | ECL | Other | Category | Amount | ||||||||||||||||||||||
| Financial assets: |
||||||||||||||||||||||||||||
| Shares |
FVPL | 8,256 | 37 | - | - | FVPL (mandatorily) | 8,293 | |||||||||||||||||||||
| Shares |
AFS | 21 | (21) | - | - | FVOCI (designated) | - | |||||||||||||||||||||
| Debt securities |
AFS | 14,109 | (12,225) | - | - | FVOCI | 1,884 | |||||||||||||||||||||
| Debt securities |
FVPL | 9,609 | 12,209 | - | - | FVPL (designated) | 21,819 | |||||||||||||||||||||
| Loans |
L&R | 35,066 | (20,004) | (82) | 39 | AC | 15,019 | |||||||||||||||||||||
| Loans |
FVPL | 20,068 | - | (1,892) | FVPL (designated) | 18,175 | ||||||||||||||||||||||
| Deposits with financial institutions |
L&R | 1,527 | - | - | - | AC | 1,527 | |||||||||||||||||||||
| Unconsolidated investment funds |
FVPL | 631 | - | - | - | FVPL (mandatorily) | 631 | |||||||||||||||||||||
| Other investments |
FVPL | 3,464 | (64) | - | - | FVPL (designated) | 3,400 | |||||||||||||||||||||
| Other investments |
AFS | 13 | (13) | - | - | FVOCI | - | |||||||||||||||||||||
| Cash and cash equivalents |
L&R | 3,557 | - | - | - | AC | 3,557 | |||||||||||||||||||||
| Other financial assets and receivables |
L&R | 1,520 | 114 | - | - | AC | 1,634 | |||||||||||||||||||||
| Derivatives |
FVPL | 8,395 | - | - | - | FVPL (mandatorily) | 8,395 | |||||||||||||||||||||
|
Total |
86,169 | 103 | (82) | (1,853) | 84,336 | |||||||||||||||||||||||
| Financial liabilities: |
||||||||||||||||||||||||||||
| Investment contracts |
AC | (12,179) | - | - | - | AC | (12,179) | |||||||||||||||||||||
| Investment contracts |
FVPL | (1,396) | - | - | - | FVPL (designated) | (1,396) | |||||||||||||||||||||
| Long-term borrowings and group loans |
AC | (5,227) | - | - | - | AC | (5,227) | |||||||||||||||||||||
| Derivatives |
FVPL | (9,239) | 753 | - | - | FVPL (mandatorily) | (8,486) | |||||||||||||||||||||
| Other liabilities |
AC | (1,663) | 378 | - | - | AC | (1,285) | |||||||||||||||||||||
|
Total |
(29,704) | 1,131 | - | - | (28,573) | |||||||||||||||||||||||
As of January 1, 2023, EUR 103 million has been reclassified out of financial assets, and EUR 1,131 million has been reclassified out of financial liabilities which moved in scope of IFRS 17 and classified and measured as (re)insurance contracts from January 1, 2022. Remeasurement impacts included the reversal of impairments of financial assets recognized under IAS 39 in amount of EUR 39 million and the recognition of expected credit losses of EUR 82 million in line with the impairment requirements of IFRS 9. An additional remeasurement loss of EUR 1,892 was the result of the designation of loans and receivables in (previously measured at amortized cost) to measurement at fair value through profit or loss.
As a consequence, the impairment loss that was recognized as per December 31, 2022 under IFRS 4 has changed. The table below shows the calculated impairment loss under IAS 39 and IFRS 4 per December 31, 2022, as disclosed in the 2022 Integrated Annual Report, and the calculated impairment loss under IFRS 9 and IFRS 17 as per December 31, 2022.
|
|
Unaudited | Page 95 of 131 |
Condensed consolidated interim financial information for the period ended June 30, 2023
The impairment loss has been recalculated at each reporting date until closing date of the transaction, as both the fair value of the consideration to be received and the carrying value of Aegon the Netherlands where subject to change. The consideration to be received includes a 29.99% stake in a.s.r. and was therefore contingent on the development of the a.s.r. share price. The carrying amount of Aegon the Netherlands has been updated for assets and liabilities which are not included in the measurement scope of IFRS 5. In the table below the additional impairment loss per June 30, 2023 is included.
| EUR millions | June 30, 2023 (IFRS 9/17) |
December 31, 2022 (IFRS 9/17) |
December 31, 2022 (IAS 39/IFRS 4) |
|||||||||
| Net cash receivable after costs to sell |
2,190 | 2,175 | 2,175 | |||||||||
| Fair value of 29.99% share in a.s.r. |
2,610 | 2,700 | 2,700 | |||||||||
| Fair value less costs to sell |
4,800 | 4,875 | 4,875 | |||||||||
| Carrying amount of Aegon the Netherlands |
5,230 | 5,324 | 6,960 | |||||||||
| Fair value less costs to sell minus carrying amount |
(430) | (449) | (2,085) | |||||||||
| Assets in scope for impairment |
1,775 | 1,775 | 1,775 | |||||||||
| Cumulative impairment loss recognized |
879 | 449 | 1,775 | |||||||||
| Impairment to be recognized upon the completion of the sale |
- | - | 310 | |||||||||
The impairment loss takes into account contingent payables and receivables between Aegon N.V. and Aegon the Netherlands that are recognized prior to the closing date. These are included in the carrying amount of Aegon the Netherlands.
The fair value less costs to sell is level 1 of the fair value hierarchy, as it includes the share price of a.s.r. and the cash consideration.
20.2 Fair value
| EUR millions | January 1, 2023 | Total gains / losses in income statement 1 |
Purchases | Sales | June 30, 2023 | Total unrealized gains and losses for the period recorded in the P&L for instruments held at June 30, 2023 ³
|
||||||||||||||||||
| Financial assets measured at fair value through profit or loss |
||||||||||||||||||||||||
| Shares |
1,378 | (17) | 190 | (120) | 1,431 | (17) | ||||||||||||||||||
| Debt securities |
98 | 1 | - | (45) | 53 | 1 | ||||||||||||||||||
| Loans |
18,175 | 26 | 965 | (617) | 18,549 | 26 | ||||||||||||||||||
| Other investments at fair value |
- | - | - | - | - | - | ||||||||||||||||||
| Investments where the policyholder bears the risk |
932 | 2 | 157 | (451) | 639 | 2 | ||||||||||||||||||
|
|
20,583
|
|
|
11
|
|
|
1,312
|
|
|
(1,234)
|
|
|
20,672
|
|
|
11
|
| |||||||
| Total assets at fair value |
20,583 | 11 | 1,312 | (1,234) | 20,672 | 11 | ||||||||||||||||||
| Financial liabilities carried at fair value |
||||||||||||||||||||||||
| Investment contracts without DPF where the policyholder bears the risk |
105 | 0 | 3 | (19) | 90 | 0 | ||||||||||||||||||
| Derivatives |
1 | (1) | - | - | - | (1) | ||||||||||||||||||
| Total financial liabilities measured at fair value |
106 | - | 3 | (19) | 90 | - | ||||||||||||||||||
There were no transfers to or from level I and level II in the first half year of 2023.
|
|
Unaudited | Page 96 of 131 |
Condensed consolidated interim financial information for the period ended June 30, 2023
| EUR millions | January 1, 2022 |
Total gains / losses in income statement 1 |
Purchases | Sales | Transfers from Level I and Level II |
Transfers to Level I and Level II |
December 31, 2022 |
Total unrealized gains and losses for the period recorded in the P&L for instruments held at December 31, 2022 ³ |
||||||||||||||||||||||||
| Financial assets measured at fair value through profit or loss |
||||||||||||||||||||||||||||||||
| Shares |
1,364 | 175 | 190 | (350) | - | - | 1,378 | 123 | ||||||||||||||||||||||||
| Debt securities |
196 | 0 | 44 | (3) | - | (140) | 98 | (7) | ||||||||||||||||||||||||
| Loans |
22,727 | (4,529) | 1,802 | (1,825) | - | - | 18,175 | (4,529) | ||||||||||||||||||||||||
| Derivatives |
0 | - | - | (0) | - | - | - | - | ||||||||||||||||||||||||
| Investments where the policyholder bears the risk |
572 | (62) | (562) | 982 | 2 | - | 932 | (53) | ||||||||||||||||||||||||
| 24,859 | (4,415) | 1,473 | (1,196) | 2 | (140) | 20,583 | (4,466) | |||||||||||||||||||||||||
|
|
||||||||||||||||||||||||||||||||
| Total assets at fair value |
24,859 | (4,415) | 1,473 | (1,196) | 2 | (140) | 20,583 | (4,466) | ||||||||||||||||||||||||
| Financial liabilities carried at fair value |
||||||||||||||||||||||||||||||||
| Investment contracts without DPF where the policyholder bears the risk |
(33) | (23) | (559) | 721 | 1 | - | 105 | (18) | ||||||||||||||||||||||||
|
Derivatives |
3 | (2) | 0 | - | - | - | 1 | (2) | ||||||||||||||||||||||||
| Total financial liabilities measured at fair value |
(31) | (25) | (559) | 721 | 1 | - | 106 | (19) | ||||||||||||||||||||||||
| Carrying amount |
Total estimated fair value |
Carrying amount |
Total estimated fair value |
|||||||||||||
| EUR millions | June 30, 2023 | December 31, 2022 | ||||||||||||||
| Assets |
||||||||||||||||
| Mortgage loans - held at amortized cost |
15,042 | 13,544 | 14,516 | 13,000 | ||||||||||||
| Private loans - held at amortized cost |
389 | 393 | 500 | 446 | ||||||||||||
| Other loans - held at amortized cost |
12 | 12 | 3 | 3 | ||||||||||||
| Liabilities |
||||||||||||||||
| Borrowings – held at amortized cost |
5,333 | 5,059 | 5,227 | 4,920 | ||||||||||||
| Investment contracts - held at amortized cost |
11,736 | 11,448 | 12,179 | 11,826 | ||||||||||||
20.3 Credit risk
For specific asset portfolios, which include mortgage and consumer loans in the Netherlands the Group applies LGN (Loss Given No-cure) in the estimation of expected credit losses which represents the expectation of the extent of the loss on an exposure that defaults without cure. The LGN varies by type and amount of exposure, and type and amount of collateral available, the presence of other credit support, the duration of default, and the macro-economic forecast. The LGN is expressed as a percentage loss per unit of exposure at the time of default. The LGN is calculated for each future quarter.
For the residential mortgage loans and consumer loans in the Netherlands, the relative change in Forward-in-Time (FiT) Probability of Default (PD) will be used as primary indicator to assess significant increase in credit risk. Forward-in-Time (FiT) represents a hybrid Point-in-Time (PiT) where the PD is appropriately adjusted for forward-looking information. This method incorporates forward-looking information and determines the PD using all available supportive information. The changes in the probability of default will be evaluated by the relative change in the credit score rating of the financial asset. The credit score rating is an output of the credit score sub-model – which considers qualitative factors (e.g., LTV) for each loan and assigns a rating (i.e., 1, 2, 3, 4) which reflects the credit quality of the loan. The average credit score of the underlying pooled loans would equate to the credit score for the financial asset. A relative change in the score greater than 0.5 would indicate a shift in credit quality (i.e. 1 to 2) and could indicate increase in credit risk.
|
|
Unaudited | Page 97 of 131 |
Condensed consolidated interim financial information for the period ended June 30, 2023
No secondary indicator is applied to residential mortgage loans and consumer loans, given that the Probability of Default variation approach has been applied.
A backstop is applied in the mortgage loans and consumer loans portfolios to exposures considered to have experienced a significant increase in credit risk if the borrower is more than 30 days past due on its contractual payments.
21. Post reporting date events
On July 4, 2023, Aegon announced the completion of the combination of its Dutch pension, life and non-life insurance, banking, and mortgage origination activities with a.s.r., and the beginning of its asset management partnership with a.s.r. As part of the transaction, Aegon received EUR 2.2 billion cash proceeds and a 29.99% stake in a.s.r., refer to note 20 Discontinued operations for more information.
On July 6, 2023, Aegon announced the beginning of a EUR 1.5 billion share buyback program. This follows the completion of the combination of its Dutch pension, life and non-life insurance, banking, and mortgage origination activities with a.s.r. on July 4, 2023. The share buyback program is expected to be completed on or before June 30, 2024, barring unforeseen circumstances. Aegon will engage a third party to execute the buyback transactions on its behalf. The common shares will be repurchased at a maximum of the average of the daily volume-weighted average prices during the repurchase period. Aegon intends to cancel these shares subject to the relevant board, shareholder and regulatory approvals. The share buyback program, which was contingent to the completion of the transaction with a.s.r. will have a significant impact on Aegon’s
3Q 2023 capital position (reduction of own funds) which will be partially offset by the derecognition of Aegon the Netherlands and the recognition of a 29.99% stake in a.s.r.
On July 21, 2023 Aegon announced the sale of its 56% stake in its associate in India, Aegon Life Insurance Company, to Bandhan Financial Holdings Limited, an Indian financial services company. The completion of the proposed transaction is subject to customary regulatory approvals. The divestment does not have a material impact on Aegon’s capital position or results.
|
|
Unaudited | Page 98 of 131 |
Condensed consolidated interim financial information for the period ended June 30, 2023
This page is intentionally left blank.
|
|
Unaudited | Page 99 of 131 |
Condensed consolidated interim financial information for the period ended June 30, 2023
This page is intentionally left blank.
|
|
Unaudited | Page 100 of 131 |
Condensed consolidated interim financial information for the period ended June 30, 2023
Disclaimer (1/2)
Cautionary note regarding non-EU-IFRS measures
This document includes the following non-EU-IFRS financial measures: operating result and addressable expenses. These non-EU-IFRS measures, except for addressable expenses, are calculated by consolidating on a proportionate basis Aegon’s joint ventures and associated companies. Operating result reflects Aegon’s profit before tax from underlying business operations and mainly excludes components that relate to accounting mismatches that are dependent on market volatility, updates to best estimate actuarial and economic assumptions and model updates or events that are considered outside the normal course of business. Operating expenses are all expenses associated with selling and administrative activities (excluding commissions). This includes certain expenses recorded in other charges for segment reporting, including restructuring charges. Addressable expenses are calculated by excluding the following items from operating expenses: direct variable acquisition expenses, restructuring expenses (including expenses related to the operational improvement plan), expenses in joint ventures and associates and expenses related to acquisitions and disposals. Addressable expenses are reported on a constant currency basis. Aegon believes that these non-EU-IFRS measures, together with the EU-IFRS information, provide meaningful supplemental information about the operating results of Aegon’s business including insight into the financial measures that senior management uses in managing the business.
Forward-looking statements
The statements contained in this document that are not historical facts are forward-looking statements as defined in the US Private Securities Litigation Reform Act of 1995. The following are words that identify such forward-looking statements: aim, believe, estimate, target, intend, may, expect, anticipate, predict, project, counting on, plan, continue, want, forecast, goal, should, would, could, is confident, will, and similar expressions as they relate to Aegon. These statements may contain information about financial prospects, economic conditions and trends and involve risks and uncertainties. In addition, any statements that refer to sustainability, environmental and social targets, commitments, goals, efforts and expectations and other events or circumstances that are partially dependent on future events are forward-looking statements. These statements are not guarantees of future performance and involve risks, uncertainties and assumptions that are difficult to predict. Aegon undertakes no obligation, and expressly disclaims any duty, to publicly update or revise any forward-looking statements. Readers are cautioned not to place undue reliance on these forward-looking statements, which merely reflect company expectations at the time of writing. Actual results may differ materially and adversely from expectations conveyed in forward-looking statements due to changes caused by various risks and uncertainties. Such risks and uncertainties include but are not limited to the following:
| ○ | Unexpected delays, difficulties, and expenses in executing against Aegon’s environmental, climate, diversity and inclusion or other “ESG” targets, goals and commitments, and changes in laws or regulations affecting us, such as changes in data privacy, environmental, safety and health laws; |
| ○ | Changes in general economic and/or governmental conditions, particularly in the United States, the Netherlands and the United Kingdom; |
| ○ | Civil unrest, (geo-) political tensions, military action or other instability in a country or geographic region; |
| ○ | Changes in the performance of financial markets, including emerging markets, such as with regard to: |
| • | The frequency and severity of defaults by issuers in Aegon’s fixed income investment portfolios; |
| • | The effects of corporate bankruptcies and/or accounting restatements on the financial markets and the resulting decline in the value of equity and debt securities Aegon holds; |
| • | The effects of declining creditworthiness of certain public sector securities and the resulting decline in the value of government exposure that Aegon holds; |
| • | The impact from volatility in credit, equity, and interest rates; |
| ○ | Changes in the performance of Aegon’s investment portfolio and decline in ratings of Aegon’s counterparties; |
| ○ | Lowering of one or more of Aegon’s debt ratings issued by recognized rating organizations and the adverse impact such action may have on Aegon’s ability to raise capital and on its liquidity and financial condition; |
| ○ | Lowering of one or more of insurer financial strength ratings of Aegon’s insurance subsidiaries and the adverse impact such action may have on the written premium, policy retention, profitability and liquidity of its insurance subsidiaries; |
| ○ | The effect of the European Union’s Solvency II requirements, applicable equivalent solvency requirements and other regulations in other jurisdictions affecting the capital Aegon is required to maintain; |
| ○ | Changes affecting interest rate levels and low or rapidly changing interest rate levels; |
| ○ | Changes affecting currency exchange rates, in particular the EUR/USD and EUR/GBP exchange rates; |
| ○ | Changes affecting inflation levels, particularly in the United States, the Netherlands and the United Kingdom; |
| ○ | Changes in the availability of, and costs associated with, liquidity sources such as bank and capital markets funding, as well as conditions in the credit markets in general such as changes in borrower and counterparty creditworthiness; |
| ○ | Increasing levels of competition, particularly in the United States, the Netherlands, the United Kingdom and emerging markets; |
| ○ | Catastrophic events, either manmade or by nature, including by way of example acts of God, acts of terrorism, acts of war and pandemics, could result in material losses and significantly interrupt Aegon’s business; |
| ○ | The frequency and severity of insured loss events; |
| ○ | Changes affecting longevity, mortality, morbidity, persistence and other factors that may impact the profitability of Aegon’s insurance products; |
| ○ | Aegon’s projected results are highly sensitive to complex mathematical models of financial markets, mortality, longevity, and other dynamic systems subject to shocks and unpredictable volatility. Should assumptions to these models later prove incorrect, or should errors in those models escape the controls in place to detect them, future performance will vary from projected results; |
| ○ | Reinsurers to whom Aegon has ceded significant underwriting risks may fail to meet their obligations; |
| ○ | Changes in customer behavior and public opinion in general related to, among other things, the type of products Aegon sells, including legal, regulatory or commercial necessity to meet changing customer expectations; |
| ○ | Customer responsiveness to both new products and distribution channels; |
| ○ | Third-party information used by us may prove to be inaccurate and change over time as methodologies and data availability and quality continue to evolve impacting our results and disclosures; |
| ○ | As Aegon’s operations support complex transactions and are highly dependent on the proper functioning of information technology, operational risks such as system disruptions or failures, security or data privacy breaches, cyberattacks, human error, failure to safeguard personally identifiable information, changes in operational practices or inadequate controls including with respect to third parties with which Aegon does business may disrupt Aegon’s business, damage its reputation and adversely affect its results of operations, financial condition and cash flows; |
| ○ | The impact of acquisitions and divestitures, restructurings, product withdrawals and other unusual items, including Aegon’s ability to complete, or obtain regulatory approval for, acquisitions and divestitures, integrate acquisitions, and realize anticipated results, and its ability to separate businesses as part of divestitures; |
| ○ | Aegon’s failure to achieve anticipated levels of earnings or operational efficiencies, as well as other management initiatives related to cost savings, Cash Capital at Holding, gross financial leverage and free cash flow; |
| ○ | Changes in the policies of central banks and/or governments; |
| ○ | Litigation or regulatory action that could require Aegon to pay significant damages or change the way Aegon does business; |
| ○ | Competitive, legal, regulatory, or tax changes that affect profitability, the distribution cost of or demand for Aegon’s products; |
| ○ | Consequences of an actual or potential break-up of the European monetary union in whole or in part, or the exit of the United Kingdom from the European Union and potential consequences if other European Union countries leave the European Union; |
|
|
Unaudited | Page 101 of 131 |
Condensed consolidated interim financial information for the period ended June 30, 2023
Disclaimer (1/2)
| ○ | Changes in laws and regulations, particularly those affecting Aegon’s operations’ ability to hire and retain key personnel, taxation of Aegon companies, the products Aegon sells, and the attractiveness of certain products to its consumers; |
| ○ | Regulatory changes relating to the pensions, investment, and insurance industries in the jurisdictions in which Aegon operates; |
| ○ | Standard setting initiatives of supranational standard setting bodies such as the Financial Stability Board and the International Association of Insurance Supervisors or changes to such standards that may have an impact on regional (such as EU), national or US federal or state level financial regulation or the application thereof to Aegon, including the designation of Aegon by the Financial Stability Board as a Global Systemically Important Insurer (G-SII); |
| ○ | Changes in accounting regulations and policies or a change by Aegon in applying such regulations and policies, voluntarily or otherwise, which may affect Aegon’s reported results, shareholders’ equity or regulatory capital adequacy levels; |
| ○ | Changes in ESG standards and requirements, including assumptions, methodology and materiality, or a change by Aegon in applying such standards and requirements, voluntarily or otherwise, may affect Aegon’s ability to meet evolving standards and requirements, or Aegon’s ability to meet its sustainability and ESG-related goals, or related public expectations. |
| ○ | Changes in ESG standards and requirements, including assumptions or Aegon’s ability to meet its sustainability and ESG-related goals, or related public expectations; and |
| ○ | Reliance on third-party information in certain of Aegon’s disclosures, which may change over time as methodologies and data availability and quality continue to evolve. These factors, as well as any inaccuracies in third-party information used by Aegon, including in estimates or assumptions, may cause results to differ materially and adversely from statements, estimates, and beliefs made by Aegon or third-parties. Moreover, Aegon’s disclosures based on any standards may change due to revisions in framework requirements, availability of information, changes in its business or applicable governmental policies, or other factors, some of which may be beyond Aegon’s control. Additionally, Aegon may provide information that is not necessarily material for SEC reporting purposes but that is informed by various ESG standards and frameworks (including standards for the measurement of underlying data), internal controls, and assumptions or third-party information that are still evolving and subject to change. |
This document contains information that qualifies, or may qualify, as inside information within the meaning of Article 7(1) of the EU Market Abuse Regulation (596/2014). Further details of potential risks and uncertainties affecting Aegon are described in its filings with the Netherlands Authority for the Financial Markets and the US Securities and Exchange Commission, including the 2022 Integrated Annual Report. These forward-looking statements speak only as of the date of this document. Except as required by any applicable law or regulation, Aegon expressly disclaims any obligation or undertaking to release publicly any updates or revisions to any forward-looking statements contained herein to reflect any change in Aegon’s expectations with regard thereto or any change in events, conditions or circumstances on which any such statement is based.
|
|
Unaudited | Page 102 of 131 |
Condensed consolidated interim financial information for the period ended June 30, 2023
About Aegon
Aegon is an international financial services holding company. Aegon’s ambition is to build leading businesses that offer their customers investment, protection and retirement solutions. Its portfolio of businesses includes fully owned subsidiaries in the US, UK and a global asset manager. In addition, Aegon has partnerships in Spain & Portugal, Brazil, and China, which create value by combining strong local partners with Aegon’s international expertise. In the Netherlands, Aegon generates value via a strategic shareholding in a market leading insurance and pensions company.
Aegon’s purpose of helping people live their best lives runs through all its activities. As a leading global investor and employer, Aegon seeks to have a positive impact by addressing critical environmental and societal issues, with a focus on climate change and inclusion & diversity. Aegon is headquartered in The Hague, the Netherlands, and listed on Euronext Amsterdam and the New York Stock Exchange. More information can be found at aegon.com.
Contacts
Media relations
Carolien van der Giessen
+31(0) 6 11953367
carolien.vandergiessen@aegon.com
Investor relations
Hielke Hielkema
+31(0) 70 344 7697
hielke.hielkema@aegon.com
|
|
Unaudited | Page 103 of 131 |
Condensed consolidated interim financial information for the period ended June 30, 2023
Appendix A: Material accounting policy information of Aegon N.V. in accordance with IFRS 9 and IFRS 17 (as per January 1, 2023)
A.1 Insurance contracts
A.1.1 Scope
Insurance contracts are contracts under which the Group accepts a significant risk – other than a financial risk – from a policyholder by agreeing to compensate the beneficiary on the occurrence of an uncertain future event by which he or she will be adversely affected. Significant insurance risk is determined on a present-value basis, where at least one scenario with commercial substance can be identified in which the Group has to pay significant additional benefits to the policyholder or his or her beneficiaries.
Contracts that do not meet the definition of insurance contracts are accounted for as financial instruments or as service contracts, depending on the nature of the agreement.
Insurance contracts include products that provide policyholders with the option to take out insurance coverage at predetermined prices, provided this option is shown to have commercial substance.
A.1.2 Combining a set or series of insurance contracts
Aegon accounts for a set or series of insurance contracts together as if they were issued as one contract, where this reflects the substance of the transaction. This may, for example, be the case if the insurance contracts are negotiated as a package with a single commercial objective and the measurement of the contracts is highly interrelated.
A.1.3 Separating components from insurance contracts
At inception, the following components are separated from an insurance contract and accounted for as if they were stand-alone financial instruments:
| ◾ | Embedded derivatives whose economic characteristics and risks are not closely related to those of the host contract, and whose terms would not meet the definition of an insurance contract as a stand-alone instrument; and |
| ◾ | Investment components (i.e. amounts that an insurance contract requires Aegon to repay to a policyholder, even if the insured event does not occur) that are distinct. In other words, investment components that: |
| - | Do not meet the definition of an investment contract with discretionary participation features; |
| - | Are not highly inter-related with the insurance component; and |
| - | For which contracts with equivalent terms are sold, or could be sold, separately in the same market or jurisdiction. |
Promises to transfer to a policyholder distinct goods or services other than insurance contract services, are also separated from the host contract and accounted for as a service contract.
Aegon has currently not identified any components of the insurance contracts recognized at the balance sheet date, that require separation.
A.1.4 Level of aggregation
Insurance contracts are grouped together for measurement and income recognition purposes. The groups are established at initial recognition and are not reassessed subsequently.
|
|
Unaudited | Page 104 of 131 |
Condensed consolidated interim financial information for the period ended June 30, 2023
A.1.4.1 Portfolios
Aegon classifies contracts as belonging to one portfolio when they are subject to similar risks and are managed together.
When identifying similar risks, Aegon considers all insurance and financial risks that are transferred from the policyholder to the Group. This does not include lapse risk or expense risk, as these are not risks that a policyholder transfers to an insurer. Generally, contracts in the same product line are included within the same portfolio if they are managed together, and contracts in different product lines with dissimilar risks are included in different portfolios.
To be grouped together, contracts must be managed together from the perspective of either the management board of Aegon N.V or the management of its operating segments. Information that is used to assess how risks are managed includes Aegon’s internal management reporting, as well as asset-liability management and asset allocation strategies.
A.1.4.2 Groups
Contracts within a portfolio are segregated into:
| ◾ | Groups of insurance contracts that are onerous at initial recognition. |
| ◾ | Groups of insurance contracts that are not onerous at initial recognition, subdivided into: |
| - | Groups of insurance contracts that have no significant possibility of becoming onerous subsequently; and |
| - | A group of remaining contracts in the portfolio, if any. |
Aegon uses two approaches to identify groups of contracts. The first approach consists of a bottom-up assessment, in which contracts are grouped together on a contract-by-contract basis by considering the expected profitability of each contract. Alternatively, the grouping assessment can be completed at a higher level of aggregation if, based on reasonable and supportable information, Aegon concludes that a set of contracts will – by definition - all be in the same group.
Both approaches involve qualitative factors, quantitative factors, or a combination of both, for example product pricing, assumption setting reviews, key performance indicators (such as market-consistent value of the new business and expected loss ratios) and asset liability management and hedging strategies.
In assessing whether a profitable group of contracts could subsequently become onerous, Aegon considers the size of the estimated profit at inception and its sensitivity to changes in the underlying assumptions. Typically, Aegon would expect that any insurance contract could become lossmaking if the insured event occurs. Nonetheless, there may be indicators based on which Aegon concludes that a group of contracts has no significant possibility of subsequently becoming onerous. For example, there may be pricing information demonstrating that products are sold at very favorable premiums due to specific market conditions (e.g. niche markets) or a product may contain embedded guarantees that are strongly out of the money.
If contracts within a portfolio would fall into different groups only because law or regulation specifically constrains Aegon’s practical ability to set a different price or level of benefits for policyholders with different characteristics, the contracts are included in the same group.
A.1.4.3 Cohorts
Aegon follows a quarterly reporting frequency on a locked-in period-to-date basis, as opposed to a year-to-date basis, and therefore groups contracts into quarterly cohorts. New contracts issued in the same quarter and belonging to the same group will be measured together. After the quarter end, the cohort is closed, and the cohort will be treated as ‘in force’ in the subsequent quarterly reporting periods.
|
|
Unaudited | Page 105 of 131 |
Condensed consolidated interim financial information for the period ended June 30, 2023
A.1.5 Recognition
A group of insurance contracts is recognized from the earliest of the following dates: the beginning of the coverage period, the date when the first payment from a policyholder in the group becomes due, and the date when the group of insurance contracts becomes onerous.
A.1.6 Insurance acquisition cashflows
Insurance acquisition cash flows arise from selling, underwriting and starting a group of insurance contracts. They comprise not only the incremental costs of originating insurance contracts but also other (in)direct costs and include cash flows relating to both successful and unsuccessful acquisition efforts.
Insurance acquisition cash flows must be directly attributable to a portfolio of contracts. At initial recognition, Aegon allocates them to groups of contracts as follows:
| ◾ | Insurance acquisition cash flows that can be directly attributable to a specific group of insurance contracts (e.g. acquisition commissions) are allocated to that group, as well as to groups that are expected to include the renewals of those contracts. |
| ◾ | Insurance acquisition cash flows that are directly attributable to a portfolio of insurance contracts, other than those in described in the above bullet, are allocated to the groups of contracts in the portfolio on a systematic and rational basis. |
A.1.7 Insurance contract types
For presentation and analysis purposes, Aegon distinguishes between life and non-life insurance contracts. Life insurance contracts comprise insurance contracts for which the primary insured risk is life contingent, as well as long term care products in the Americas. Non-life insurance contracts include fire insurance, motor insurance, general liability insurance, and disability and sickness insurance.
For measurement and income recognition purposes, Aegon distinguishes between insurance contracts with and without direct participating features. Contracts are classified at the initial recognition date and not subsequently reassessed. Aegon’s non-life business consists entirely of insurance contracts without direct participating features, whilst Aegon’s life insurance business includes both types of insurance contracts.
Whilst the initial measurement of both types of insurance contracts is the same, the subsequent accounting differs. The Variable Fee Approach is applied to life insurance contracts with direct participating features. Other life and non-life insurance contracts are accounted for under the General Measurement Model, unless Aegon has elected to apply the Premium Allocation Approach to groups of these contracts (see note A.1.11).
A.1.7.1 Insurance contracts with direct participating features
Insurance contracts with direct participating features are defined as life insurance contracts for which, at inception:
| ◾ | The contractual terms specify that the policyholder participates in a share of a clearly identified pool of underlying items; |
| ◾ | Aegon expects to pay to the policyholder an amount equal to a substantial share of the fair value returns on the underlying items, and |
| ◾ | Aegon expects a substantial proportion of any change in the amounts to be paid to the policyholder to vary with the change in fair value of the underlying items. |
Insurance contracts with direct participating features provide both insurance services and investment-related services. They are viewed as creating an obligation to pay policyholders an amount that is equal to the fair value of the underlying items, less a variable fee for future services. The variable fee reflects the unrealized gain or loss that Aegon expects to make on the contract. It comprises Aegon’s share in the fair value of the underlying items less the fulfilment cash flows that do not vary based on the returns on underlying items, such as expense cash flows and the cost of financial guarantees.
|
|
Unaudited | Page 106 of 131 |
Condensed consolidated interim financial information for the period ended June 30, 2023
A pool of underlying items can comprise any items, for example a reference portfolio of assets, a pool of funds, the net assets of an Aegon group company or a specified subset of the net assets of the entity. In determining whether the pool has been clearly identified to the policyholder, Aegon considers all contractual terms and conditions as well as other policyholder communications. Aegon does not need to hold the identified pool of underlying items for a product to qualify as an insurance contract with direct participating features, nor does the existence of Aegon’s discretion to vary the amounts paid to the policyholder preclude qualification. However, the link between policyholder benefits and underlying items must be enforceable and Aegon must not have the ability to change the underlying items with retrospective effect.
Once the presence of a clearly identified pool of underlying items has been established, Aegon uses a methodology for product classification that builds on a two-step approach with an initial assessment based on product characteristics, followed by a quantitative assessment where the former is not conclusive.
| ◾ | The initial assessment based on product characteristics is performed using multiple qualitative indicators. For example, Aegon considers whether a contract includes substantial contractual profit-sharing rates and the degree to which these can subsequently be reset. It also considers the extent to which asset management fees and other charges are commensurate with the services provided and in line with market terms, and whether a product guarantees a minimum return on investment. |
| ◾ | If the qualitative step is not conclusive on its own, the product undergoes quantitative analysis. Different calculation methods are used, depending on the product characteristics and the market conditions at the inception of the contract. |
| - | The policyholder’s share in the fair value returns is assessed by comparing the expected total return on the underlying items, net of the asset management fees, with the expected payments to the policyholder that are based on those underlying items. Variable fees and charges that cover multiple services are split into an insurance component and investment management component, with only the latter being deducted from total returns. As a guideline, the threshold for a substantial share of the fair value returns is in the range of 50% (or higher). |
| - | The assessment of the variability in policyholder benefits often requires the use of probability-weighted models, factoring all scenarios where returns are impacted by the allocation of clearly identifiable assets, variable fees and guarantees. The determination of one scenario where there is no variability does not automatically disqualify a product for the variable fee approach but is assessed together with the scenarios in which the guarantee is not in-the-money at the expected termination date of the contract. |
Examples of insurance contracts with direct participating features include unit-linked contracts issued by Aegon in Europe, and variable annuities issued in the Americas and Asia.
A.1.7.2 Insurance contracts without direct participating features
Insurance contracts without direct participating features provide insurance services, and in some cases, investment-return services. Identification of the services provided is relevant when, for example, determining the appropriate profit emergence pattern.
A product is considered to provide an investment-return service if, and only if, the following apply:
| ◾ | The contract contains a non-distinct investment component or the policyholder has a right to withdraw an amount under the policy; |
| ◾ | Aegon expects that this amount will include an investment return; and |
| ◾ | Aegon expects to perform investment activity to generate that investment return. |
Insurance contracts without direct participating features include all non-life insurance products issued by Aegon, as well as term insurance, fixed annuities, long term care contracts, and US-style universal life products issued in the Americas and Asia.
|
|
Unaudited | Page 107 of 131 |
Condensed consolidated interim financial information for the period ended June 30, 2023
A.1.8. Initial measurement
On initial recognition, Aegon measures a group of contracts at a risk-adjusted, current and probability-weighted estimate of the present value of the future cash flows (‘fulfilment cash flows’) plus or minus the unearned profit on the group of contracts (‘contractual service margin’).
A.1.8.1 Fulfilment cash flows
The fulfilment cash flows comprise:
| ◾ | Estimates of future cash flows that are within the contract boundary; |
| ◾ | An adjustment to reflect time value of money and the financial risks related to future cash flows, to the extent that the financial risks are not included in the estimates of future cash flows and |
| ◾ | A risk adjustment for non-financial risk. |
They reflect Aegon’s view of the current condition at the reporting date, consistent with observable market prices and considering all contractual terms and conditions with commercial substance that are within the contract boundary. Future changes in legislation that would change or discharge a present obligation or create new obligations under existing contracts, are only considered when the legislation is substantively enacted.
A.1.8.2 Contract boundary
Cash flows are within the boundary of an insurance contract if they arise from rights and obligations that exist during the period in which Aegon can either compel the policyholder to pay premiums or has a substantive obligation to provide insurance contract services to the policyholder.
A substantive obligation to provide insurance contract services ends when:
| ◾ | Aegon has the practical ability to reassess the risks of a particular policyholder, and as a result, can set a price or level of benefits that fully reflects those risks; or |
| ◾ | Both of the following apply: |
| - | Aegon has the practical ability to reassess the risks of the portfolio that contains the contract and can set a price or level of benefits that fully reflects the risks of that portfolio; and |
| - | The pricing of the premiums up to the date when the risks are reassessed, does not take into account any risks that relate to periods after the reassessment date. |
In determining whether a contract can be repriced, all insurance and financial risks that are transferred from the policyholder to Aegon are considered. Risks that result from the contract itself, such as expense risk or lapse risk, are ignored. If Aegon provides investment-related services to insurance policyholders, the ability to reprice the fees or charges for these services to prevailing rates is also considered in setting the contract boundary.
In some jurisdictions, regulatory requirements limit Aegon’s ability to fully reprice contracts on renewal and are therefore relevant when setting the contract boundary. Regulatory price caps that apply equally to existing and new policyholders do not extend the contract boundary, because they do not result in a valuable policyholder renewal option.
Some contracts that have a long contract boundary based on long-term guaranteed benefits, also include policyholder options that can be repriced. For example, the contract may allow the policyholder to take out additional insurance cover at current market rates at the time of uptake. Whilst the policyholder option can be repriced, Aegon cannot reprice or reassess the benefits of the entire policy. Therefore, the policyholder option is considered within the long contract boundary of the host contract, provided it can reasonably be expected to be utilized.
Contract boundaries are based on current facts and circumstances and may therefore change over time.
|
|
Unaudited | Page 108 of 131 |
Condensed consolidated interim financial information for the period ended June 30, 2023
A.1.8.3 Contractual service margin
The contractual service margin represents the unearned profit Aegon will recognize as it provides insurance contract services in future. On initial recognition of a group of non-onerous insurance contracts it is measured at an amount that ensures that no income arises from:
| ◾ | The initial recognition of the fulfilment cash flows, |
| ◾ | Any cash flows arising from the contracts in the group at that date and |
| ◾ | The derecognition of any asset for insurance acquisition cash flows and any other asset or liability previously recognized for cash flows related to the group of contracts. |
For onerous insurance contracts, the calculation above results in a loss that is recognized in the income statement immediately and for which a corresponding loss component is established as part of the insurance liabilities. More information on the loss component is provided in A.1.10.
A.1.9 Subsequent measurement
The carrying amount of a group of insurance contracts at the end of each reporting period is the sum of the liability for remaining coverage and the liability for incurred claims. The liability for remaining coverage comprises the fulfilment cash flows related to future service allocated to that group and the contractual service margin of the group. The liability for incurred claims comprises the fulfilment cash flows related to past service allocated to the group. Cash flows that remain subject to insurance risk after the occurrence of the insured event, are included in the liability for remaining coverage.
The fulfilment cash flows are remeasured at each reporting date to reflect current estimates. The treatment of accounting estimates made in the previous interim financial statements is not changed in subsequent interim and the annual financial statements. The measurement of the contractual service margin differs for contracts with and without direct participating features and is described below.
Some changes in the contractual service margin are offset by changes in the fulfilment cash flows, resulting in no change in the total carrying amount of the liability for remaining coverage. To the extent that changes in the contractual service margin and changes in the fulfilment cash flows do not offset, income and expenses are recognized.
A.1.9.1 Insurance contracts without direct participating features (general measurement model)
For a group of insurance contracts without direct participating features, the carrying amount of the contractual service margin at the end of each reporting period is the carrying amount at the start of the period, adjusted for:
| ◾ | The effect of any new contracts added to the group; |
| ◾ | Interest accreted on the carrying amount of the contractual service margin during the period; |
| ◾ | Changes in the fulfillment cash flows that relate to future services, except for to the extent that: |
| - | Such increases in the fulfillment cash flows exceed the carrying amount of the contractual service margin, giving rise to a loss, or |
| - | Such decreases in the fulfillment cash flows are allocated to the loss component; |
| ◾ | The effect of any currency exchange differences on the contractual service margin; and |
| ◾ | The amounts recognized as insurance revenue because of the transfer of insurance contract services in the period. |
Interest accretion
Aegon accretes interest to the contractual service margin based on either the one-year forward rate or one-year spot-rate, derived from the discount rate curve used to estimate the present value of future cash flows that do not vary based on the returns on any underlying items on initial recognition of the group of contracts.
The amount of interest is calculated on a time-weighted basis, allowing for the timing of the movements in the contractual service margin over the reporting period.
|
|
Unaudited | Page 109 of 131 |
Condensed consolidated interim financial information for the period ended June 30, 2023
Changes in fulfilment cash flows relating to future services
Changes in the fulfilment cash flows that relate to future services comprise:
| ◾ | Experience adjustments arising from premiums received in the period that relate to future services and related cash flows, measured at the discount rates determined on initial recognition; |
| ◾ | Changes in estimates of the present value of future cash flows in the liability for remaining coverage (other than those that relate to the effects of the time value of the money and changes in financial risks), measured at the discount rates determined on initial recognition; |
| ◾ | Differences between any non-distinct investment component expected to become payable in the period and the actual non-distinct investment component that becomes payable in the period; |
| ◾ | Differences between any loan to a policyholder expected to become repayable in the period and the actual loan to a policyholder that becomes repayable in the period; and |
| ◾ | Changes in the risk adjustment for non-financial risk that relate to future services. |
The change in fulfilment cash flows that relates to future service is calculated using discount rates derived from the discount rate curve used to determine the contractual service margin on initial recognition of the group of contracts.
Changes in discretionary cash flows are regarded as relating to future services, and accordingly, adjust the contractual service margin.
Changes in the contractual service margin recognized as insurance revenue
The contractual service margin of a group of contracts is recognized as insurance revenue in each period to reflect the insurance contract services provided under the group of insurance contracts in that period. The amount of revenue is determined by allocating the contractual service margin remaining at the end of the reporting period equally to each coverage unit provided in the current period and expected to be provided in the future.
The numbers of coverage units in a group of contracts is determined by considering, for each contract, the quantity of the benefits provided and its expected coverage period. If a contract provides coverage for more than one insured event or if it provides additional investment-return services, the coverage unit reflects all material benefits.
The coverage period is defined as the period during which Aegon provides insurance coverage and/or investment services. The expected coverage period takes account of the expected survivorship of contracts and so considers expected lapses and deaths.
Aegon has defined coverage units that differ per product type to best reflect a product’s characteristics and the nature of the services provided to the policyholder. Insurance services are typically depicted by a metric that is based on the maximum amount that a policyholder would receive if the insured event were to occur, such as the total benefits amount or the death benefit amount. For investment-type services, coverage units are based on the total return that Aegon expects to provide the policyholder over the lifetime of the contract.
Aegon applies the following formula to determine the amount of contractual service margin to release in each reporting period:
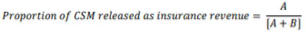
Where:
A = coverage units provided in the period
B = present value of coverage units to be provided in the future
The coverage units provided in the period are determined as an average of the coverage units at the beginning and end of the quarterly reporting period. Future coverage units are discounted using rates locked-in at the initial recognition of the group of contracts.
|
|
Unaudited | Page 110 of 131 |
Condensed consolidated interim financial information for the period ended June 30, 2023
A.1.9.2 Insurance contracts with direct participating features (variable fee approach)
For the measurement of direct participating contracts, Aegon adjusts the fulfilment cash flows for changes in the obligation to pay policyholders an amount equal to the fair value of the underlying items. These changes do not relate to future services and are recognized in the profit or loss.
Aegon adjusts the carrying amount of the contractual service margin for each group of contracts to equal the carrying amount at the start of the reporting period adjusted for:
| ◾ | The effect of any new contracts added to the group of contracts; |
| ◾ | The change in the amount of Aegon’s share of the fair value of the underlying items and changes in fulfilment cash flows relating to future services, except to the extent that: |
| - | For groups of contracts it is chosen to exclude from the contractual service margin changes in the effect of financial risk on its share of the underlying items (‘risk mitigation’); |
| - | The decrease in the amount of the group of contracts share of the fair value of the underlying items, or an increase in the fulfilment cash flows relating to future services, exceeds the carrying amount of the contractual service margin, giving rise to a loss in the income statement; or |
| - | The increase in the amount of the group of contracts share of the fair value of the underlying items, or a decrease in the fulfilment cash flows relating to future services, is allocated to a loss component, reversing losses previously recognized in the income statement; |
| ◾ | The effect of any currency exchange differences on the contractual service margin; and |
| ◾ | The amount recognized as insurance revenue because of the insurance contract services provided in the period. |
Changes in fulfilment cash flows relating to future services
Changes in Aegon’s share in the fair value of the underlying items, by definition, relates to future service and therefore adjusted the contractual service margin.
In addition to the fulfilment cash flows movements that have been defined in the general measurement model as relating to future services, the variable fee approach requires changes in fulfilment cash flows to be booked to the contractual service margin if they are the result of a change in the effect of the time value of money or financial risks not arising from the underlying items. Examples include the interest accrued to projected fixed benefits and expense cash flows, and the change in the value of financial guarantees.
Changes in the contractual service margin recognized as insurance revenue
The policy on the recognition of revenue for insurance contracts with direct participating features is the same as under the general measurement model, except that references to “investment-return services” should be read as “investment-related services”.
Risk mitigation
For certain groups of contracts, Aegon has a documented risk management objective and strategy for mitigating financial risk arising from insurance contracts with participating features, using derivatives, reinsurance contracts held and other FVPL financial instruments. Risk mitigation involves the hedging of one or a combination of financial risks (e.g. interest rate, financial instrument price, currency exchange rate, index of prices or rates, inflation rate) and can cover multiple groups of contracts in different portfolios.
For these contracts, Aegon does not recognize the entire change in the amount of Aegon’s share of the fair value of the underlying items and changes in fulfilment cash flows relating to future services in the contractual service margin. Instead, the change in the hedged position is recognized as part of insurance finance expense in the income statement or in other comprehensive income.
Prior to the reporting period, Aegon demonstrates that an economic offset exists between the insurance contracts and the risk mitigating items (i.e. the values of both are generally expected to move in opposite directions because they respond in a similar way to the changes in the risk being mitigated), which is not dominated by credit risk. If these conditions cease to be met, risk mitigation accounting is discontinued. In this instance, any amounts previously recognized as insurance finance expense in the income statement or in other comprehensive income, are not adjusted.
|
|
Unaudited | Page 111 of 131 |
Condensed consolidated interim financial information for the period ended June 30, 2023
A.1.10 Loss component
A group of insurance contracts can be onerous at inception, namely when the fulfilment cash flows allocated to the contract, any previously recognised insurance acquisition cash flows and any cash flows arising from the contract at the date of initial recognition in total are a net outflow. It can also become onerous at subsequent measurement due to unfavorable changes relating to future service in the fulfilment cash flows arising from changes in estimates of future cash flows and the risk adjustment for non-financial risk allocated to the contractual service margin, or for contracts with direct participating features, due to a decrease in the amount of Aegon’s share of fair value of the underlying items.
When a group of insurance contracts becomes onerous, a loss component of the liability for remaining coverage for that group is established. Except for changes in non-financial assumptions that are fully allocated to a loss component, all subsequent changes in the fulfilment cash flows of the liability for remaining coverage are allocated on a systematic basis between the loss component and the remaining liability for remaining coverage. No revenue is recognized for services allocated to the loss component, as Aegon has never received compensation from the policyholder for these.
Additional unfavorable changes in the fulfilment cash flows that exceed the contractual service margin are recognized in the income statement immediately. Favorable changes in the fulfilment cash flows are recognized in the income statement to the extent that they reserve the loss component, after which the contractual service margin is re-established.
A.1.11 Premium allocation approach
Aegon applies the premium allocation approach to certain groups of, predominantly non-life, insurance contracts. These groups of contracts mostly include products with a coverage period of one year or less. The premium allocation approach is only applied to contracts with a longer coverage period if the Group expects that the resulting measurement would not differ materially from the result of applying the general measurement model.
A.1.11.1 Level of aggregation
Contracts to which the premium allocation approach is applied are grouped together using the same principles as described in paragraph (c) above, with the following modifications:
| ◾ | Contracts to the premium allocation approach is applied, are assumed not to be onerous at inception, unless facts and circumstances indicate otherwise. |
| ◾ | Contracts to which the premium allocation approach are grouped together in annual cohorts, which is more aligned with the nature of the products. |
A.1.11.2 Acquisition costs
Insurance acquisition cashflows that relate to some (but not all) groups of contracts to which Aegon applies the premium allocation approach are expensed when incurred, provided the coverage period does not exceed 12 months.
A.1.11.3 Initial recognition and measurement
On initial recognition, Aegon measures the carrying amount of the liability for remaining coverage as premiums received at initial recognition, if any, plus or minus any amounts arising from the derecognition of other assets or liabilities previously recognized for cash flows related to the group of contracts.
A.1.11.4 Subsequent measurement, including loss component
The carrying amount of a group of insurance contracts at the end of each reporting period is the sum of the liability for remaining coverage and the liability for incurred claims.
|
|
Unaudited | Page 112 of 131 |
Condensed consolidated interim financial information for the period ended June 30, 2023
The liability for remaining coverage is increased by any premiums received in the period and decreased by the amount recognized as insurance revenue for insurance contract service provided and any non-distinct investment component paid or transferred to the liability for incurred claims. Given the time between providing each part of the coverage and the related premium, Aegon has chosen not to adjust the liability for remaining coverage to reflect the time-value of money and the effect of financial risk.
If at any time during the coverage period facts and circumstances indicate that a group of insurance contracts is onerous, Aegon calculates the difference between the carrying amount of the liability for remaining coverage and the fulfilment cash flow that relate to the remaining coverage of the group. In case this difference is negative, Aegon recognizes a loss in the income statement and increases the liability for remaining coverage.
Aegon recognizes the liability for incurred claims of a group of insurance contracts at the amount of the fulfilment cash flows relating to incurred claims. The fulfilment cash flows are discounted at current rates unless the cash flows are expected to be paid in one year or less from the date the claims are incurred.
A.1.12 Derecognition and contract modification
Aegon derecognizes a contract when it is extinguished (i.e. when the specified obligations in the contract expire or are discharged or cancelled).
On the derecognition of a contract from within a group of contracts:
| ◾ | The fulfilment cash flows allocated to the group are adjusted to eliminate those that relate to the rights and obligations derecognized; |
| ◾ | The contractual service margin of the group is adjusted for the change in the fulfilment cash flows, except where such changes are allocated to a loss component; and |
| ◾ | The number of coverage units for the expected remaining insurance contract services is adjusted to reflect the coverage units derecognized from the group. |
If a contract is derecognized because it is transferred to a third party, then the contractual service margin is also adjusted for the premium charged by the third party, unless the group is onerous.
A contract is also derecognized if its terms are modified in a such way that would have changed the accounting for the contract significantly had the new terms always existed, in which case a new contract based on the modified terms is recognized. In this instance, the contractual service margin of the group is adjusted for the premium that would have been charged had the Group entered into a contract with the new contract’s terms at the date of modification, less any additional premium charged for the modification. The new contract recognized is measured assuming that, at the end of modification, the issuer received the premium that it would have charged less any additional premium charged for the modification.
If a contract modification does not result in derecognition, Aegon treats the changes in cash flows caused by the modification as changes in estimates of fulfilment cash flows.
A.1.13 Insurance contracts acquired in a portfolio transfer or business combination
Insurance contracts acquired in a business combination or portfolio transfer after the transition to IFRS 17 (January 1, 2022) are accounted for in accordance with Aegon’s accounting policy on insurance contracts, with the exception that both the inception date and the initial recognition date should be taken to refer to the acquisition date of the contracts.
When determining the initial measurement of a transferred portfolio, the consideration paid or received for the insurance contracts is taken as a proxy for the premiums paid. For insurance contracts acquired in a business combination, the fair value of the contracts is used as a proxy instead.
If a group of contracts acquired in a portfolio transfer is onerous, the loss is recognized in profit or loss at the acquisition date. If an onerous group of contracts is acquired in a business combination, the loss first adjusts the amount of goodwill and is recognized in profit or loss to the extent that the loss exceeds the amount of goodwill.
|
|
Unaudited | Page 113 of 131 |
Condensed consolidated interim financial information for the period ended June 30, 2023
At the acquisition date, Aegon recognizes a separate asset for insurance acquisition cash flows at fair value for the rights to obtain:
| ◾ | future renewals of contracts recognized at the acquisition date; and |
| ◾ | other future insurance contracts without paying again insurance acquisition cash flows that the acquiree has already paid. |
A.2 Reinsurance contracts
Reinsurance contracts held are contracts entered into by Aegon in order to receive compensation for claims arising from one or more insurance contracts issued by the Group. Reinsurance contracts that do not transfer insurance risk are accounted for as financial instruments or as service contracts, depending on the nature of the agreement.
Aegon is not relieved of its legal liabilities when entering into reinsurance transactions. Therefore, the liabilities relating to the underlying insurance contracts will continue to be reported on the consolidated statement of financial position during the contractual term of the underlying contracts.
To the extent possible, the accounting model applied to reinsurance contracts held is consistent with that of the underlying insurance contracts. Differences will arise when underlying contracts have direct participating features, as the variable fee approach cannot be applied to reinsurance contracts held. Furthermore, reinsurance contracts with a coverage period exceeding 12 months may not be eligible for the premium allocation approach.
A.2.1 Separating components from insurance contracts
Similarly to the analysis for insurance contracts (see note 2.2), Aegon has assessed that its reinsurance contracts held do not include components that need to be separated for accounting purposes.
A.2.2 Level of aggregation
Reinsurance contracts are grouped for measurement and income recognition purposes, based on the similarity of risk, the manner in which the contracts are managed, the expected profitability of the contracts at inception, and the period in which the contracts are issued.
The process for dividing reinsurance contracts into groups is similar to that used for insurance contracts (note A.1), except that references to ‘onerous contracts’ should be replaced with a reference to ‘contracts on which there is a net gain on initial recognition’.
When grouping reinsurance contracts, Aegon considers the type of reinsurance cover received (e.g. yearly renewable term, stop loss, or coinsurance).
A group of reinsurance contracts can comprise a single contract, for example when the contracts are managed on an individual treaty basis.
A.2.3 Reinsurance contracts measured under the general measurement model
The Group applies the accounting policies disclosed in note A.1 for insurance contracts without direct participating features to measure a group of reinsurance contracts held, albeit with the following modifications:
|
|
Unaudited | Page 114 of 131 |
Condensed consolidated interim financial information for the period ended June 30, 2023
A.2.3.1 Recognition
Aegon recognizes reinsurance contracts held at the earlier of the following:
| ◾ | The beginning of the coverage period; or |
| ◾ | The date that an onerous group of underlying insurance contracts is recognized, if Aegon entered into the related reinsurance contract held at or before that date. |
Notwithstanding the foregoing, Aegon delays the recognition of a group of reinsurance contracts held that provide proportionate coverage (e.g. coinsurance, modified coinsurance and yearly renewable treaties) until the date that any underlying insurance contract is initially recognized, if that date is later than the beginning of the coverage period of the group of reinsurance contracts held.
A.2.3.2 Initial measurement
Aegon estimates the present value of the future cash flows of the group of reinsurance contracts held, using assumptions that are consistent with those used to measure the underlying insurance contracts. The estimate includes an adjustment for the risk of non-performance by the reinsurer, which is based on Aegon’s credit exposure, net of collateral, and the perceived counterparty default risk. More information on the methods used to calculate the fulfilment cash flows and the process to estimate the inputs to those methods is provided in notes A.1 and 11.3.
The risk adjustment for non-financial risk is the amount of risk transferred by the Group to the reinsurer.
On initial recognition, the contractual service margin of a group of reinsurance contracts held represents a net cost or a net gain on purchasing reinsurance. It is measured as the equal and opposite amount of the total of the fulfilment cash flows, any derecognized assets for cash flows occurring before the recognition of the group, any cash flows arising from the contracts in the group at that date, and any income recognized in profit or loss for the recovery of losses recorded on initial recognition of onerous underlying contracts.
If the net cost on purchasing reinsurance coverage relates to insured events that occurred before the purchase of the group of reinsurance contracts, it is immediately expensed in the income statement.
Contract boundary
Cash flows are within the contract boundary of a reinsurance contract held if they arise from substantive rights and obligations that exist during the period in which Aegon is either compelled to pay amounts to the reinsurer or in which it has a substantive right to receive services from that reinsurer. A substantive right to receive services from a reinsurer ends when the reinsurer has the right to terminate coverage or when he has the practical ability to reassess the risks transferred by Aegon and can set a price or level of benefits that fully reflects those reassessed risks.
For treaties with open attaching periods, the cessions within the termination window (typically 90 days) are treated as a separate contract for accounting purposes. Cessions that take place after the termination window are treated as a new contract.
A.2.3.3 Contractual service margin
On initial recognition, the contractual service margin of a group of reinsurance contracts held represents a net cost or a net gain on purchasing reinsurance. It is measured as the equal and opposite amount of the total of the fulfilment cash flows, any derecognized assets for cash flows occurring before the recognition of the group, any cash flows arising from the contracts in the group at that date, and any income recognized in profit or loss for the recovery of losses recorded on initial recognition of onerous underlying contracts.
If the net cost on purchasing reinsurance coverage relates to insured events that occurred before the purchase of the group of reinsurance contracts, it is immediately expensed in the income statement.
|
|
Unaudited | Page 115 of 131 |
Condensed consolidated interim financial information for the period ended June 30, 2023
A.2.3.4 Subsequent measurement
The carrying amount of a group of reinsurance contracts held at each reporting date is the sum of the asset for remaining coverage and the asset for incurred claims. The asset for remaining coverage comprises: (i) the fulfilment cash flows that relate to services that will be received under the contracts in future periods; plus (ii) any remaining contractual service margin at that date. The asset for incurred claims comprises the fulfilment cash flows that relate to services received in the current and past period.
The fulfilment cash flows are remeasured at each reporting date to reflect current estimates.
The carrying amount of the contractual service margin at the end of each period is the carrying amount at the start of the period, adjusted for:
| ◾ | The contractual service margin of any new contracts that are added to the group in the period; |
| ◾ | Interest accreted on the carrying amount of the contractual service margin during the period; |
| ◾ | Income recognized in profit or loss in the reporting period to coincide with the initial recognition of an onerous group of underlying insurance contracts or on addition of onerous contracts to that group; |
| ◾ | Reversals of a loss-recovery component to the extent those reversals are not changes in the fulfilment cash flows of the group of reinsurance contracts held; |
| ◾ | Changes in fulfilment cash flows, measured at discount rates at initial recognition, to the extent that the change relates to future services, except for the extent that: |
| - | The change results from a change in fulfilment cash flows allocated to a group of underlying insurance contracts that does not adjust the contractual service margin of the group of underlying contracts; |
| - | The change results from the remeasurement of the liability for remaining coverage of an onerous group of underlying contracts to which the premium allocation approach is applied; |
| ◾ | The effect of any currency exchange differences on the contractual service margin; and |
| ◾ | The amount recognized in the profit or loss because of the services received in the period. |
The rate at which interest in accreted to the contractual service margin is determined at the initial inception date of the group of reinsurance contracts, in the same way as the interest accretion rates for insurance contracts without direct participating features.
Some changes in the contractual service margin are offset by changes in the fulfilment cash flows, resulting in no change in the total carrying amount of the asset for remaining coverage. To the extent that changes in the contractual service margin and changes in the fulfilment cash flows do not offset, income and expenses are recognized.
Changes in the fulfilment cash flows that result from changes in the risk of non-performance by the issuer do not relate to future service and are recognized in the income statement immediately.
A.2.3.5 Loss recovery component
Aegon establishes a loss recovery component for a group of reinsurance contracts, when a change in the fulfillment cash flows that relates to future services does not adjust the contractual service margin. It reflects the income recognized in the income statement to offsets the reinsured loss reported on the underlying insurance contracts.
The adjusted amount, and resulting income, is determined by multiplying:
| ◾ | The loss recognized on the group of underlying insurance contracts; and |
| ◾ | The recovery percentage, which is the percentage of claims on the group of underlying insurance contracts that Aegon expects to recover from the reinsurance contracts held. |
The calculation of the recovery percentage is based on discounted claims and recovery amounts, using current discount rates. No allowance is made for reinsurance non-performance risk, and any risk adjustment for non-financial risks is excluded from the calculation.
If an onerous group of insurance contracts is only partially reinsured, systematic and rational allocation methods are used to determine the portion of subsequent movements in the loss component that relates to insurance contracts covered by the group of reinsurance contracts held.
|
|
Unaudited | Page 116 of 131 |
Condensed consolidated interim financial information for the period ended June 30, 2023
A.2.4 Reinsurance contracts held measured under the premium allocation approach
Aegon applies the premium allocation approach to a group of reinsurance contracts held, if the approach is also applied to the underlying insurance contracts and:
| ◾ | The coverage period of each reinsurance contract in the group is one year or less; or |
| ◾ | Aegon reasonably expects the resulting measurement will not differ materially from the results when applying the general measurement model. |
If a loss recovery component is created for a group of reinsurance contracts measured under the premium allocation approach, Aegon adjusts the carrying amount of the asset for remaining coverage instead of adjusting the contractual service margin.
Please refer to note A.1.11 for a description of the accounting policies concerning the premium allocation approach.
A.2.5 Derecognition and contract modification
Aegon applies the same accounting policies for derecognition and contract modifications to reinsurance contract held as to insurance contracts. Please refer to note A.1.
A.3 Insurance revenue
Aegon recognizes insurance revenue as it provides services under groups of insurance contracts and under groups of contracts with discretionary participating features.
The total insurance revenue recognized over the duration of a group of contracts is equal to the amount of premiums received, adjusted for a financing effect and excluding any non-distinct investment components. For contracts with direct participating features, it includes the variable fees that Aegon expects to receive. Reinstatement premiums are included in insurance revenue, when reinstatement is not mandatory under the terms of the contract but at the discretion of the policyholder. Ceding commissions paid by Aegon on inward reinsurance are deducted from insurance revenue, unless they are contingent on future claims.
The revenue recognized in the period represents the total of the changes in the liability for remaining coverage that relate to services for which the Group expects to receive compensation and includes:
| ◾ | The release of contractual service margin for services provided in the period; |
| ◾ | Changes in the risk adjustments for non-financial risk that do not relate to future service, excluding amounts allocated to the loss component; |
| ◾ | The claims and other insurance service expenses expected to be incurred in the period, excluding amounts allocated to the loss component; |
| ◾ | Other amounts, such as experience adjustments for premium receipts that do not relate to future service and income tax that is specifically chargeable to the policyholder. |
In addition, the insurance revenue recognized in the period includes an allocation of the portion of the premiums that are related to recovering insurance acquisition cash flows. The allocation is based on the passage of time, without interest accumulation. The same amount is also recognized as insurance service expenses (see note A.4).
For insurance contracts to which the premium allocation approach is applied, insurance revenue is equal to the total premiums that are expected to be received for the services provided, excluding any non-distinct investment component and adjusted to reflect the time value of money and the effect of financial risk, where applicable. Revenues are allocated to the periods of insurance contract services based on the passage of time.
|
|
Unaudited | Page 117 of 131 |
Condensed consolidated interim financial information for the period ended June 30, 2023
A.4 Insurance service expenses
Insurance service expenses arise as Aegon provides coverage and other services under issued insurance contracts and investment contracts with discretionary participating features. It comprises
| ◾ | The incurred claims, excluding repayments of non-distinct investment components, and other incurred insurance service expenses; |
| ◾ | Adjustments to the liabilities for incurred claims that do not arise from the effects of the time value of money, financial risk and changes therein; |
| ◾ | Amortization of insurance acquisition cash flows; |
| ◾ | Losses on onerous contracts and the reversals of such losses; and |
| ◾ | Impairment losses on assets for insurance acquisition cash flows and reversals of such impairment losses. |
A.5 Net expenses on reinsurance held
With the exception of reinsurance finance income, all other income and expenses from a group of reinsurance contracts are presented as a single amount.
Aegon recognizes an allocation of reinsurance premiums paid in profit or loss as it receives services under groups of reinsurance contracts. For contracts not measured under the premium allocation approach (PAA), the allocation of reinsurance premiums paid relating to services received for each period represents the total of the changes in the asset for remaining coverage that relate to services for which Aegon expects to pay consideration.
For contracts measured under the PAA, the allocation of reinsurance premiums paid for each period is the amount of expected premium payments for receiving services in that period.
A.6 Insurance finance expenses
Insurance finance expenses comprise the change in the carrying amount of the group of insurance contracts or reinsurance contracts arising from the effect of the time value of money and changes in the time value of money, as well as the effect of financial risk and changes in financial risk. It also includes the changes in the measurement of group of insurance contracts that are caused by changes in the value of underlying items (excluding additions and withdrawals).
For groups of contracts with direct participating features, insurance finance expenses exclude any changes that adjust the contractual service margin (See note A.1). If a group of contracts with direct participating features becomes onerous due to changes in the time value of money or financial risk, the loss is recognized as insurance service expense rather than insurance finance expenses.
A.6.1 Defining financial risk
Financial risk can relate to one or more of a
| ◾ | specified interest rate, |
| ◾ | financial instrument price, |
| ◾ | commodity price, currency exchange rate, |
| ◾ | index of prices or rates, |
| ◾ | credit rating or credit index or |
| ◾ | other variable, provided in the case of a non-financial variable that the variable is not specific to a party to the contract. |
As an example of variables not specific to a party to the contract, assumptions about inflation are considered to relate to financial risk, to the extent that they are based on an index of prices or on prices of assets with inflation-linked returns. Assumptions about inflation that are based on Aegon’s own expectations of specific price changes, do not relate to financial risk and are considered to be actuarial assumptions.
|
|
Unaudited | Page 118 of 131 |
Condensed consolidated interim financial information for the period ended June 30, 2023
For contracts with discretionary participating features, Aegon uses the basis on which, at inception, it expected to determine its commitment under the contract to distinguish between the effect of changes in assumptions that relate to financial risk on that commitment and the effect of discretionary changes to that commitment (which adjust the contractual service margin).
Aegon considers, per portfolio, whether the risk adjustment for financial risks should be disaggregated in an insurance service component and an insurance finance component, taking into account the extent to which the carrying amount of the is affected by changes in interest rate and other financial risks. At the current reporting date, the changes in the risk adjustment for non-financial risk are fully attributed to insurance services.
A.6.2 Disaggregation of insurance finance expenses
Insurance finance expenses for the period are included in profit or loss, unless Aegon has chosen to apply the option to disaggregate these expenses between profit or loss and other comprehensive income. This option is set by insurance portfolio and applied consistently for all underlying groups of contracts. In assessing the appropriate accounting policy for a portfolio of insurance contracts, Aegon considers the investments and other assets that it holds for each portfolio and how it accounts for those assets.
Aegon disaggregates insurance finance expenses for insurance contracts without direct participating features issued in the US, insurance contracts issued in Asia that are internally reinsured in the US and certain life insurance products in Spain.
The amount of insurance finance expenses included in profit or loss is determined by a systematic allocation of the expected total insurance finance income and expenses over the duration of the group of contracts, using the following rates:
| ◾ | Discount rates determined at the date of initial recognition of the group of contracts; |
| ◾ | A rate that allocates the remaining revised expected finance income or expenses over the remaining duration of the group of contracts at a constant rate (expected yield approach); or |
| ◾ | For contracts that use a crediting rate to determine amounts due to the policyholders using an allocation that is based on the amounts credited in the period and expected to be credited in future periods (projected crediting rate approach). |
The expected yield approach and projected crediting rate approach are applied to designated groups of contracts for which changes in financial assumptions have a substantial effect on the amounts paid by the policyholder (‘indirect participating products’). Indirect participating products include variable annuity products that do not qualify for the variable fee approach due to minimum guarantees. US-style universal life contracts are not classified as indirect participating products because Aegon considers policyholder benefits to be insufficiently impacted by changes in financial assumptions.
In the US, Aegon has elected to apply the projected crediting rate approach to indexed universal life and fixed indexed annuities. Other indirect participating contracts, such as variable universal life and fixed annuities, are accounted for under the expected yield approach.
A.7 Reinsurance finance income
Finance income related to reinsurance contracts held is presented separately in the income statement and OCI. They are not netted with the finance expenses related to insurance contracts issued.
A.8 Investment contracts
Contracts issued by the Group that do not transfer significant insurance risk but do transfer financial risk from the policyholder to the Group are accounted for as investment contracts. Investment contract liabilities are recognized when the contract is entered into and are derecognized when the contract expires, is discharged or is cancelled.
|
|
Unaudited | Page 119 of 131 |
Condensed consolidated interim financial information for the period ended June 30, 2023
A.8.1 Investment contracts with discretionary participation features
Some investment contracts have participation features whereby the policyholder has the right to receive potentially significant additional benefits which are based on the performance of a specified pool of investment contracts, specific investments held by the Group or on the issuer’s net result. If the Group has discretion over the amount or timing of the distribution of the returns to policyholders, the investment contract liability is measured based on the accounting principles that apply to insurance contracts with similar features.
Some unitized investment contracts provide policyholders with the option to switch between funds with and without discretionary participation features. The entire contract is accounted for as an investment contract with discretionary participation features if there is evidence of actual switching resulting in discretionary participation benefits that are a significant part of the total contractual benefits.
A.8.2 Recognition and measurement
The accounting for investment contracts with discretionary participating features is the same as insurance contracts, with the following exceptions:
| ◾ | The date of initial recognition is the date that Aegon becomes party to the contract; |
| ◾ | Cash flows are within the contract boundary if they result from a substantive obligation of the entity to deliver cash at a present or future date. Aegon has no substantive obligation to deliver cash if it has the practical ability to set a price for the promise to deliver the cash that fully reflects the amount of cash promised and related risks; and |
| ◾ | The contractual service margin is recognized over the duration of the group of contracts in a systematic way that reflects the transfer of investment services under the contract. |
A.9 Financial assets and liabilities
A.9.1 Initial recognition and measurement
Financial assets and financial liabilities are recognized when Aegon becomes a party to the contractual provisions of the instrument and are classified for accounting purposes depending on the characteristics and the business model under which they were purchased.
At initial recognition, Aegon measures a financial asset at its fair value plus or minus, in the case of a financial asset not at fair value through profit or loss (FVPL), transaction costs that are incremental and directly attributable to the acquisition or issue of the financial asset or financial liability, such as fees and commissions. Immediately after initial recognition, an expected credit loss allowance (ECL) is recognized for financial assets measured at amortized cost and investments in debt instruments measured at fair value through other comprehensive income (FVOCI), as described in note 1.1.3 Information about amounts arising from ECL, which results in an accounting loss being recognized in profit or loss when an asset is newly originated.
When the fair value of financial assets and liabilities differs from the transaction price on initial recognition, Aegon recognizes the difference as follows:
| ◾ | When the fair value is evidenced by a quoted price in an active market for an identical asset or liability (i.e. a Level 1 input) or based on a valuation technique that uses only data from observable markets, the difference is recognized as a gain or loss. |
| ◾ | In all other cases, the difference is deferred and the timing of recognition of deferred day one profit or loss is determined individually. It is either amortized over the life of the instrument, deferred until the instrument’s fair value can be determined using market observable inputs, or realized through settlement. |
|
|
Unaudited | Page 120 of 131 |
Condensed consolidated interim financial information for the period ended June 30, 2023
A.9.2 Classification and subsequent measurement of financial assets
Under IFRS 9, Aegon classifies its financial assets in the following measurement categories:
| ◾ | Fair value through profit or loss (‘FVPL’); |
| ◾ | Fair value through other comprehensive income (‘FVOCI’); or |
| ◾ | Amortized cost (‘AC’). |
Aegon has classified the majority of its mortgage, consumer and private loan portfolios as measured at amortized cost, given that the cash flows on these contracts represent solely payment of principal and interest, and they fit the business model hold-to-collect. Similarly, the majority of debt instruments held by most Aegon’s insurance entities are classified as FVOCI because they fit the business model of hold-to-collect and sell, and their cash flows represent solely payment of principal and interest. However, the majority of financial assets within Aegon’s European insurance entities are designated on FVPL to minimize accounting mismatches. For a detailed breakdown of asset classes in measurement categories refer to note
10 Investments, excluding derivatives.
A.9.2.1 Equity instruments
Equity instruments are instruments that meet the definition of equity from the issuer’s perspective; that is, instruments that do not contain a contractual obligation to pay and that evidence a residual interest in the issuer’s net assets. Examples of equity instruments include basic ordinary shares.
Under IFRS 9, equity investments do not qualify for amortized cost or FVOCI treatment because they would fail the contractual cash flow characteristics assessment (cash flows are typically declared dividends at the discretion of the issuer, instead of interest). Thus, equity investments would generally only qualify for FVTPL treatment and not be subject to impairment under the expected credit loss model.
However, IFRS 9 allows the entity to make an irrevocable election at initial recognition to present changes in the fair value of equity investment in OCI rather than profit or loss. The equity investments designated as FVOCI are not subject to impairment under the expected credit loss model.
When equity investments measured at FVOCI are disposed, the unrealized gains or losses, including the OCI resulting from foreign currency translation, will stay as a part of the equity and cannot be “recycled” into profit and loss. If applicable, dividends should be recognised in profit or loss with or without such election.
Gains and losses on equity investments at FVPL are included in the ‘Results from financial transactions’ line in the consolidated income statement.
A.9.2.2 Debt instruments
Debt instruments are those instruments that meet the definition of a financial liability from the issuer’s perspective, such as mortgage loans, private loans, and government and corporate bonds.
Classification and subsequent measurement of debt instruments depend on:
| ◾ | Aegon’s business model for managing the asset; |
| ◾ | The cash flow characteristics of the asset; and |
| ◾ | The designation at FVPL to eliminate or significantly reduce an accounting mismatch or recognition inconsistency. |
|
|
Unaudited | Page 121 of 131 |
Condensed consolidated interim financial information for the period ended June 30, 2023
Based on these factors, Aegon classifies its debt instruments into one of the following three measurement categories:
| ◾ | Amortized cost: Assets that are held for collection of contractual cash flows where those cash flows represent solely payments of principal and interest (‘SPPI’), and that are not designated at FVPL, are measured at amortized cost. The carrying amount of these assets is adjusted by any expected credit loss allowance recognized (refer to note 16.1.3 Information about amounts arising from ECL). Interest revenue from these financial assets is included in ‘Interest revenue on financial instruments calculated using the effective interest rate method’. |
| ◾ | Fair value through other comprehensive income (‘FVOCI’): Financial assets that are held for collection of contractual cash flows and for selling the assets, where the assets’ cash flows represent solely payments of principal and interest, and that are not designated at FVPL, are measured at FVOCI. |
| ◾ | Movements in the carrying amount are taken through OCI, except for the recognition of impairment gains or losses, interest revenue and foreign exchange gains and losses on the instrument’s amortized cost which are recognized in profit or loss. When the financial asset is derecognized, the cumulative gain or loss previously recognized in OCI is reclassified from equity to profit or loss and recognized in ‘Net Investment result’. Interest revenue from these financial assets is included in ‘Interest revenue on financial instruments calculated using the effective interest rate method’. |
| ◾ | Fair value through profit or loss (‘FVPL’): Assets that do not meet the criteria for amortized cost or FVOCI are measured mandatorily at fair value through profit or loss. |
| ◾ | The Group has designated certain debt instruments as measured at FVPL because they relate to insurance contracts that are measured in a way that incorporates current information and all related insurance finance income and expenses are recognized in profit or loss, by which designation the Group eliminates accounting mismatches. |
A gain or loss on a debt investment that is subsequently measured at FVPL and is not part of a hedging relationship is recognized in profit or loss and presented in the profit or loss statement within ‘Net trading income’ in the period in which it arises, unless it arises from debt instruments that were designated at fair value or which are not held for trading, in which case they are presented separately in ‘Net investment result’. Interest revenue from these financial assets is included in ‘Interest revenue from financial instruments measured at FV’.
Business model
The Group determines its business model at the level that best reflects how it manages groups of financial assets to achieve its business objective. The Group’s business model is not assessed on an instrument-by-instrument basis, but at a higher level of aggregated portfolios and is based on observable factors, such as:
| ◾ | How the performance of the business model and the financial assets held within that business model are evaluated and reported to the Group’s senior management; |
| ◾ | The risks that affect the performance of the business model and the financial assets held within it. In particular, the way those risks are managed; |
| ◾ | How the Group management is compensated, i.e. whether the compensation is based on the fair value of the assets managed or on the contractual cash flows collected; |
| ◾ | The expected frequency, value and timing of sales are also important aspects of the Group’s assessment. |
The business model assessment is based on reasonably expected scenarios without taking ‘worst case’ or ‘stress case’ scenarios into account. If cash flows after initial recognition are realized in a way that is different from the Group’s original expectations, the Group does not change the classification of the remaining financial assets held in that business model, but incorporates such information when assessing newly originated or newly purchased financial assets going forward.
Sales in themselves do not determine the business model and therefore cannot be considered in isolation. An entity must consider information about sales within the context of the reasons for those sales and the conditions that existed at that time as compared to current conditions.
|
|
Unaudited | Page 122 of 131 |
Condensed consolidated interim financial information for the period ended June 30, 2023
Solely payment of principal and interest (‘SPPI’)
Where the business model is to hold assets to collect contractual cash flows or to collect contractual cash flows and cash flows from the sale of the asset, Aegon assesses whether the financial instruments’ cash flows represent solely payments of principal and interest (the ‘SPPI test’). In making this assessment, Aegon considers whether the contractual cash flows are consistent with a basic lending arrangement i.e. interest includes only consideration for the time value of money, credit risk, other basic lending risks and a profit margin that is consistent with a basic lending arrangement. Where the contractual terms introduce exposure to risk or volatility that are inconsistent with a basic lending arrangement, the related financial asset is classified and measured at fair value through profit or loss.
Financial assets with embedded derivatives are considered in their entirety when determining whether their cash flows are solely payment of principal and interest. Aegon reclassifies debt investments when and only when its business model for managing those assets changes. The reclassification takes place from the start of the first reporting period following the change. Such changes are expected to be very infrequent and none occurred during the period.
A.9.2.3 Amortized cost and effective interest rate
The amortized cost of a debt instrument is the amount at which it is measured at initial recognition plus accrued interest minus principal repayments, plus or minus the cumulative amortization of any difference between the book value at initial recognition and the nominal amount and minus any allowance for impairment. The effective interest rate method is a method of calculating the amortized cost and of allocating the interest revenue or expense over the relevant period. The effective interest rate is the rate that exactly discounts estimated future cash payments or receipts through the expected life of the debt instrument, or when appropriate, a shorter period to the net carrying amount of the instrument. When calculating the effective interest rate, all contractual terms are considered. Possible future credit losses are not taken into account. Charges and interest paid or received between parties to the contract that are an integral part of the effective interest rate, transaction costs and all other premiums or discounts are included in the calculation.
For purchased or originated credit-impaired (POCI) financial assets – assets that are credit-impaired (see definition on note 16.1.1 Credit risk management) at initial recognition – Aegon calculates the credit-adjusted effective interest rate, which is calculated based on the amortized cost of the financial asset instead of its gross carrying amount and incorporates the impact of expected credit losses in estimated future cash flows.
For assets determined to be POCI, the general impairment model would not apply. Instead, impairment is determined based on lifetime expected credit loss (ECL) since the losses are reflected in the fair value at initial recognition. No separate loss allowance is recognized.
The effective interest rate for interest recognition throughout the life of the asset is a credit-adjusted effective interest rate (EIR) since lifetime ECL is already reflected in the estimated cash flows when calculating the effective interest rate on initial recognition.
On a regular basis, the Group assesses the estimate of cash flows made at acquisition of the POCI instrument. The assessment is performed by recalculating the gross carrying amount of the asset as the present value of the estimated future cash flows, discounted using the initial credit-adjusted effective interest rate. As a result of this assessment, in an instance where the payments received by the Group exceed or fall short of the initial cash flow estimate booked at acquisition, the gain is recorded directly in the P&L as impairment losses / (reversals).
|
|
Unaudited | Page 123 of 131 |
Condensed consolidated interim financial information for the period ended June 30, 2023
A.9.2.4 Interest revenue
Interest revenue is calculated by applying the effective interest rate to the gross carrying amount of financial assets, except for:
| ◾ | POCI financial assets, for which the original credit-adjusted effective interest rate is applied to the amortized cost of the financial asset. |
| ◾ | Financial assets that are not POCI but have subsequently become credit-impaired (or ‘Stage 3’), for which interest revenue is calculated by applying the effective interest rate to their amortized cost (i.e. net of the expected credit loss provision). For the definition of ‘Stage 3’, refer to note 16.1.1 Credit risk management. |
IFRS 9 resulted in changes to IAS 1 for the presentation of Interest revenue for instruments calculated using the effective interest rate method. The revised presentation requires it be shown as a separate line item in the consolidated income statement. Interest revenue calculated using the effective interest rate relates to all financial assets, which are measured at amortized cost or FVOCI. Interest revenue on financial assets and financial liabilities that are measured at fair value through profit or loss are presented as ‘Interest revenue on financial instruments measured at FVPL’.
The new interest presentation was applied together with the other requirements of IFRS 9.
A.9.2.5 Modification of financial assets
Aegon sometimes renegotiates or otherwise modifies the contractual cash flows of financial assets. When this happens, Aegon assesses whether or not the new terms are substantially different to the original terms.
Aegon does this by considering amongst others, the following qualitative and quantitative factors:
| ◾ | If the borrower is in financial difficulty, whether the modification merely reduces the contractual cash flows to amounts the borrower is expected to be able to pay. |
| ◾ | Whether any substantial new terms are introduced, such as a profit share/equity-based return that substantially affects the risk profile of the loan or equity conversion option. |
| ◾ | Significant extension of the loan term when the borrower is not in financial difficulty. |
| ◾ | Significant change in the interest rate. |
| ◾ | Change in the currency the loan is denominated in. |
| ◾ | Insertion of collateral, other security or credit enhancements that significantly affect the credit risk associated with the loan. |
| ◾ | Change in seniority or subordination. |
| ◾ | Any change in SPPI assessment of the asset. |
| ◾ | Significant change in the present value of the instrument. |
If the terms are substantially different, Aegon derecognizes the original financial asset and recognizes a ‘new’ asset at fair value and recalculates a new effective interest rate for the asset. The date of renegotiation is consequently considered to be the date of initial recognition for impairment calculation purposes, including for the purpose of determining whether a significant increase in credit risk has occurred. However, Aegon also assesses whether the new financial asset recognized is deemed to be credit-impaired at initial recognition, especially in circumstances where the renegotiation was driven by the debtor being unable to make the originally agreed payments. Differences in the carrying amount are also recognized in profit or loss as a gain or loss on derecognition (Results from financial transactions).
If the terms are not substantially different, the renegotiation or modification does not result in derecognition, and Aegon recalculates the gross carrying amount based on the revised cash flows of the financial asset and recognizes a modification gain or loss in profit or loss as result from financial transactions. The new gross carrying amount is recalculated by discounting the modified cash flows at the original effective interest rate (or credit-adjusted effective interest rate for purchased or originated credit-impaired financial assets).
The impact of modifications of financial assets on the expected credit loss calculation is discussed in note 16.1.1 Credit risk management.
|
|
Unaudited | Page 124 of 131 |
Condensed consolidated interim financial information for the period ended June 30, 2023
A.9.2.6 Derecognition other than a modification of financial assets
A financial asset is derecognized when
| ◾ | the contractual rights to the asset’s cash flows expire and |
| ◾ | when Aegon retains the right to receive cash flows from the asset or has an obligation to pay received cash flows in full without delay to a third party and |
| ◾ | either has transferred the asset and substantially all the risks and rewards of ownership, or has neither transferred nor retained all the risks and rewards but has transferred control of the asset. |
Financial assets of which Aegon has neither transferred nor retained significantly all the risk and rewards are recognized to the extent of Aegon’s continuing involvement. If significantly all risks are retained, the assets are not derecognized.
On derecognition, the difference between the disposal proceeds and the carrying amount is recognized in the income statement as a realized gain or loss. Any cumulative unrealized gain or loss previously recognized in the revaluation reserve in shareholders’ equity is also recognized in the income statement.
A.9.2.7 Derivatives and hedge accounting
Definition of derivatives
Derivatives are financial instruments classified as held for trading assets of which the value changes in response to an underlying variable, that require little or no net initial investment and are settled at a future date.
Measurement of derivatives
Derivatives are initially recognized at fair value on the date on which the derivative contract is entered into and are subsequently remeasured at fair value. All derivatives are carried as assets when fair value is positive and as liabilities when fair value is negative.
Net fair value changes of derivatives are recognized in the income statement as result from financial transactions, unless the derivative has been designated as a hedging instrument in a cash flow hedge or a hedge of a net investment in a foreign operation. Fair value movements of fair value hedge instruments are offset by the fair value movements of the hedged item, and the resulting hedge ineffectiveness, if any, is included in result from financial transactions.
Embedded derivatives and hybrid contracts
Certain derivatives are embedded in hybrid contracts, such as the conversion option in a convertible bond. If the hybrid contract contains a host that is a financial asset, then the Group assesses the entire contract for classification and measurement purposes. Otherwise, the embedded derivatives are treated as separate derivatives when:
| ◾ | Their economic characteristics and risks are not closely related to those of the host contract; |
| ◾ | A separate instrument with the same terms would meet the definition of a derivative; and |
| ◾ | The hybrid contract is not measured at fair value through profit or loss. |
These embedded derivatives are separately accounted for at fair value, with changes in fair value recognized in the income statement as result from financial transactions, unless the Group chooses to designate the hybrid contracts at fair value through profit or loss.
Hedge accounting
The method of recognizing the resulting fair value gain or loss depends on whether the derivative is designated and qualifies as a hedging instrument and if so, the nature of the item being hedged. Aegon designates certain derivatives as either:
| ◾ | Hedges of the fair value of recognized assets or liabilities or firm commitments (fair value hedges); |
| ◾ | Hedges of highly probable future cash flows attributable to a recognized asset or liability (cash flow hedges); or |
| ◾ | Hedges of a net investment in a foreign operation (net investment hedges). |
|
|
Unaudited | Page 125 of 131 |
Condensed consolidated interim financial information for the period ended June 30, 2023
Aegon documents, at the inception of the hedge, the relationship between hedged items and hedging instruments, as well as its risk management objective and strategy for undertaking various hedge transactions. The Group also documents its assessment, both at hedge inception and on an ongoing basis, of whether the derivatives that are used in hedging transactions are highly effective in offsetting changes in fair values or cash flows of hedged items.
Fair value hedge
Changes in the fair value of derivatives that are designated and qualify as fair value hedges are recorded in the income statement, together with changes in the fair value of the hedged assets or liabilities that are attributable to the hedged risk as result from financial transactions.
If the hedge no longer meets the criteria for hedge accounting, the adjustment to the carrying amount of hedged items for which the effective interest method is used is amortized to profit or loss over the period to maturity and recorded as ‘Interest revenue on financial instruments calculated using the effective interest method’.
Cash flow hedge
The effective portion of changes in the fair value of derivatives that are designated and qualify as cash flow hedges is recognized in OCI. The gain or loss relating to the ineffective portion is recognized immediately in the P&L as result from financial transactions.
Amounts accumulated in equity are recycled to the P&L in the periods when the hedged item affects profit or loss. They are recorded in the income or expense lines in which the revenue or expense associated with the hedged item is reported.
When a hedging instrument expires or is sold, or when a hedge no longer meets the criteria for hedge accounting, any cumulative gain or loss existing in equity at that time remains in equity and is recognized in the periods when the hedged item effects profit or loss. When a forecast transaction is no longer expected to occur (e.g. the recognized hedged assets is disposed of), the cumulative gains or losses previously recognized in OCI is immediately reclassified to the P&L.
Aegon designates and accounts for cash flow hedges when effectiveness requirements are achieved. The following cash flow hedge type relationships are currently utilized by Aegon:
| ◾ | An interest rate swap that converts a floating rate asset to a fixed rate asset (e.g. combining Treasury Inflation Protected Securities asset and inflation swap to synthetically create fixed rate treasury asset). |
| ◾ | A cross currency interest rate swap that converts a foreign denominated floating rate asset to a USD fixed rate asset. |
| ◾ | A cross currency interest rate swap that converts a foreign denominated fixed rate asset to a USD fixed rate asset |
| ◾ | A forward starting interest rate swap to hedge the forecasted purchases of fixed rate assets. |
Net investment hedge
Hedges of net investments in foreign operations are accounted for similarly to cash flow hedges. Any gain or loss on the hedging instrument relating to the effective portion of the hedge is recognized directly in OCI; the gains or losses relating to the ineffective portion is recognized immediately in the P&L. Gains and losses accumulated in equity are included in the P&L when the foreign operation is disposed of as part of the gain or loss of the disposal.
|
|
Unaudited | Page 126 of 131 |
Condensed consolidated interim financial information for the period ended June 30, 2023
A.9.3 Impairment of financial assets
Aegon assesses on a forward-looking basis the expected credit losses (‘ECL’) associated with its debt instrument assets carried at amortized cost and FVOCI. Aegon recognizes a loss allowance for such losses at each reporting date. The measurement of ECL reflects:
| ◾ | An unbiased and probability-weighted amount that is determined by evaluating a range of possible outcomes; |
| ◾ | The time value of money; and |
| ◾ | Reasonable and supportable information that is available without undue cost or effort at the reporting date about past events, current conditions and forecasts of future economic conditions. |
Note 16.1.3 Information about amounts arising from ECL provides more detail of how the expected credit loss allowance is measured.
A.9.4 Financial liabilities
A.9.4.1 Classification and subsequent measurement
In both the current and prior period, financial liabilities are classified as subsequently measured at amortized cost, except for:
| ◾ | Financial liabilities measured at fair value through profit or loss: this classification is applied to derivatives, financial liabilities held for trading and other financial liabilities designated as such at initial recognition. This is because these liabilities, as well as the related assets, are managed and their performance evaluated on a fair value basis. Gains or losses on financial liabilities designated at FVPL are presented partially in other comprehensive income (the amount of change in the fair value of the financial liability that is attributable to changes in the credit risk of that liability, which is determined as the amount that is not attributable to changes in market conditions that give rise to market risk) and partially in profit or loss (the remaining amount of change in the fair value of the liability). This is unless such a presentation would create, or enlarge an accounting mismatch, in which case the gains and losses attributable to changes in the credit risk of the liability are also presented in profit or loss; |
| ◾ | Financial liabilities arising from the transfer of financial assets which did not qualify for derecognition, whereby a financial liability is recognized for the consideration received for the transfer. In subsequent periods, Aegon recognizes any expense incurred on the financial liability; and |
| ◾ | Financial guarantee contracts and loan commitments. |
The following sections provide more detail on the most significant classes of financial liabilities held by Aegon, their substance and their accounting treatment.
A.9.4.1.1 Trust pass-through securities and (subordinated) borrowings
A financial instrument issued by the Group is classified as a liability if the contractual obligation must be settled in cash or another financial asset or through the exchange of financial assets and liabilities at potentially unfavorable conditions for the Group. Trust pass-through securities and (subordinated) borrowings are initially recognized at their fair value including directly attributable transaction costs and are subsequently carried at amortized cost using the effective interest rate method, with the exception of specific borrowings that are designated as at fair value through profit or loss to eliminate, or significantly reduce, an accounting mismatch, or specific borrowings which are carried as at fair value through profit or loss as they are managed and evaluated on a fair value basis.
Interest expense on trust pass-through securities and other borrowings carried at amortized cost is recognized in profit or loss as ‘interest charges’ using the effective interest method.
The liability is derecognized when the Group’s obligation under the contract expires, is discharged or is cancelled. Subordinated borrowings include the liability component of non-cumulative subordinated notes. These notes are identified as a compound instrument due to the nature of this financial instrument. Compound instruments are separated into equity components and liability components. The liability component for the non-cumulative subordinated notes is related to the redemption amount.
|
|
Unaudited | Page 127 of 131 |
Condensed consolidated interim financial information for the period ended June 30, 2023
A.9.4.1.2 Investment contracts without discretionary participation features
Investment contracts without discretionary participation features are financial liabilities carried at amortized cost or designated at fair value through profit or loss. For more information on the accounting treatment of these contracts, refer to the section ‘Investment contracts’.
A.9.4.1.3 Savings deposits
Savings deposits are stated at amortized cost (net of accrued interest). Accrued interest is recognized in the consolidated statement of financial position under ‘other liabilities and accruals’. Interest expenses of savings deposits are presented in the statement of comprehensive income as ‘interest expense’ under other net investment result. The balances are largely repayable on demand. The initial valuation of this item reasonably approximates fair value.
A.9.4.1.4 Derivatives
To the extent that derivatives have a negative fair value at the end of the reporting period these are classified as financial liabilities at fair value through profit or loss. Interest incomes and expenses of derivatives are presented in the statement of comprehensive income as ‘interest expense’ or ’Interest revenue on financial instruments measured at FVPL’
A.9.4.1.5 Financial guarantee contracts and loan commitments
Financial guarantee contracts are contracts that require the issuer to make specified payments to reimburse the holder for a loss it incurs because a specified debtor fails to make payments when due, in accordance with the terms of a debt instrument. Such financial guarantees are given to banks, financial institutions and others on behalf of customers to secure loans, overdrafts and other banking facilities.
Financial guarantee contracts are initially measured at fair value and subsequently measured at the higher of:
| ◾ | The amount of the loss allowance (calculated as described in note 16); and |
| ◾ | The premium received on initial recognition less income recognized in accordance with the principles of IFRS 15. |
Loan commitments provided by Aegon are measured as the amount of the loss allowance (calculated as described in note 16.1.3 Information about amounts arising from ECL). Aegon has not provided any commitment to provide loans at a below-market interest rate, or that can be settled net in cash or by delivering or issuing another financial instrument.
For loan commitments and financial guarantee contracts, the loss allowance is recognized as a provision.
However, for contracts that include both a loan and an undrawn commitment and Aegon cannot separately identify the expected credit losses on the undrawn commitment component from those on the loan component, the expected credit losses on the undrawn commitment are recognized together with the loss allowance for the loan. To the extent that the combined expected credit losses exceed the gross carrying amount of the loan, the expected credit losses are recognized as a provision.
|
|
Unaudited | Page 128 of 131 |
Condensed consolidated interim financial information for the period ended June 30, 2023
A.9.4.2 Derecognition
Financial liabilities are derecognized when they are extinguished (i.e. when the obligation specified in the contract is discharged, cancelled or expires).
The exchange between Aegon and its original lenders of debt instruments with substantially different terms, as well as substantial modifications of the terms of existing financial liabilities, are accounted for as an extinguishment of the original financial liability and the recognition of a new financial liability. The terms are substantially different if the discounted present value of the cash flows under the new terms, including any fees paid net of any fees received and discounted using the original effective interest rate, is at least 10% different from the discounted present value of the remaining cash flows of the original financial liability. In addition, other qualitative factors, such as the currency that the instrument is denominated in, changes in the type of interest rate, new conversion features attached to the instrument and change in covenants are also taken into consideration. If an exchange of debt instruments or modification of terms is accounted for as an extinguishment, any costs or fees incurred are recognized as part of the gain or loss on the extinguishment. If the exchange or modification is not accounted for as an extinguishment, any costs or fees incurred adjust the carrying amount of the liability and are amortized over the remaining term of the modified liability.
|
|
Unaudited | Page 129 of 131 |
Condensed consolidated interim financial information for the period ended June 30, 2023
Appendix B: Notes included in the interim report
| 1. | Segment total operating result, operating result after tax, operating expenses, addressable expenses, income tax (including joint ventures (jv’s) and associated companies) and result before tax (including jv’s and associated companies) are calculated by consolidating on a proportionate basis the revenues and expenses of Aegon’s joint ventures and Aegon’s associates. Aegon believes that these non-IFRS measures provide meaningful information about the underlying results of Aegon’s business, including insight into the financial measures that Aegon’s senior management uses in managing the business. Among other things, Aegon’s senior management is compensated based in part on Aegon’s results against targets using the non-IFRS measures presented here. While other insurers in Aegon’s peer group present substantially similar non-IFRS measures, the non-IFRS measures presented in this document may nevertheless differ from the non-IFRS measures presented by other insurers. There is no standardized meaning to these measures under IFRS or any other recognized set of accounting standards. Readers are cautioned to consider carefully the different ways in which Aegon and its peers present similar information before comparing them. |
| Aegon believes the non-IFRS measures shown herein, when read together with Aegon’s reported IFRS financial statements, provide meaningful supplemental information for the investing public to evaluate Aegon’s business after eliminating the impact of current IFRS accounting policies for financial instruments and insurance contracts, which embed a number of accounting policy alternatives that companies may select in presenting their results (i.e. companies can use different local GAAPs to measure the insurance contract liability) and that can make the comparability from period to period difficult. |
| Aegon segment reporting is based on the businesses as presented in internal reports that are regularly reviewed by the Executive Board which is regarded as the chief operating decision maker. |
| Segment information | unaudited | |||||||||||||||||||||||
| First half 2023
|
First half 2022
|
|||||||||||||||||||||||
| Joint ventures | Joint ventures | |||||||||||||||||||||||
| EUR millions | Segment total and associates | Consolidated | Segment total and associates | Consolidated | ||||||||||||||||||||
| eliminations
|
eliminations
|
|||||||||||||||||||||||
| Operating result after tax | 686 | (14) | 671 | 658 | (15) | 643 | ||||||||||||||||||
| Tax on operating result | (132) | 35 | (97) | (139) | 38 | (101) | ||||||||||||||||||
| Operating result | 818 | (49) | 768 | 796 | (53) | 743 | ||||||||||||||||||
| Fair value items | 11 | 0 | 11 | 88 | 6 | 93 | ||||||||||||||||||
| Realized gains / (losses) on investments | (95) | (3) | (99) | (135) | (1) | (137) | ||||||||||||||||||
| Net impairments | (96) | 0 | (96) | (84) | 0 | (84) | ||||||||||||||||||
| Non-operating items | (180) | (3) | (183) | (132) | 5 | (127) | ||||||||||||||||||
| Other income / (charges) | (870) | 17 | (852) | (550) | 9 | (541) | ||||||||||||||||||
| Result before tax | (232) | (35) | (267) | 114 | (39) | 75 | ||||||||||||||||||
| Income tax from certain proportionately consolidated joint ventures | 35 | (35) | 0 | 39 | (39) | 0 | ||||||||||||||||||
| and associates included in income before tax | ||||||||||||||||||||||||
| Income tax (expense) / benefit | 33 | 35 | 69 | (68) | 39 | (29) | ||||||||||||||||||
| Of which income tax from certain proportionately consolidated joint | (35) | 35 | 0 | (39) | 39 | 0 | ||||||||||||||||||
| ventures and associates included in income before tax | ||||||||||||||||||||||||
| Net result | (199) | 0 | (199) | 46 | 0 | 46 | ||||||||||||||||||
| Segment information | unaudited | |||||||||||||||||||||||
| Second half 2022
|
||||||||||||||||||||||||
| Joint ventures | ||||||||||||||||||||||||
| EUR millions | Segment total and associates | Consolidated | ||||||||||||||||||||||
| eliminations
|
||||||||||||||||||||||||
| Operating result after tax | 758 | 35 | 793 | |||||||||||||||||||||
| Tax on operating result | (247) | 41 | (206) | |||||||||||||||||||||
| Operating result | 1,005 | (6) | 999 | |||||||||||||||||||||
| Fair value items | (198) | 3 | (195) | |||||||||||||||||||||
| Realized gains / (losses) on investments | (345) | (15) | (360) | |||||||||||||||||||||
| Net impairments | (38) | 1 | (37) | |||||||||||||||||||||
| Non-operating items | (581) | (12) | (593) | |||||||||||||||||||||
| Other income / (charges) | (1,265) | (28) | (1,293) | |||||||||||||||||||||
| Result before tax | (841) | (46) | (887) | |||||||||||||||||||||
| Income tax from certain proportionately consolidated joint ventures | 46 | (46) | 0 | |||||||||||||||||||||
| and associates included in income before tax | ||||||||||||||||||||||||
| Income tax (expense) / benefit | (111) | 46 | (65) | |||||||||||||||||||||
| Of which income tax from certain proportionately consolidated joint | (46) | 46 | 0 | |||||||||||||||||||||
| ventures and associates included in income before tax | ||||||||||||||||||||||||
| Net result | (951) | 0 | (951) | |||||||||||||||||||||
|
|
Unaudited | Page 130 of 131 |
Condensed consolidated interim financial information for the period ended June 30, 2023
| 2. | New life sales is defined as new recurring premiums plus 1/10 of single premiums. |
| 3. | Return on equity is a ratio calculated by dividing the operating result after cost of leverage by the average shareholders’ equity excluding the revaluation reserve. |
| 4. | Included in Other income/(charges) are income/(charges) made to policyholders with respect to income tax in the United Kingdom. |
| 5. | Includes production on investment contracts without a discretionary participation feature of which the proceeds are not recognized as revenues but are directly added to Aegon’s investment contract liabilities for UK. |
| 6. | Reconciliation of addressable expenses to operating expenses, the most directly comparable IFRS measure: |
|
EUR millions |
1H 2023 | 1H 2022 | % | |||||||||
| Insurance related employee expenses |
289 | 302 | (4%) | |||||||||
| Non insurance related employee expenses |
536 | 538 | (0%) | |||||||||
| Insurance related administrative expenses |
289 | 269 | 7% | |||||||||
| Non insurance related administrative expenses |
394 | 327 | 20% | |||||||||
| Operating expenses for IFRS reporting |
1,508 | 1,436 | 5% | |||||||||
| Discontinued operations - intercompany elimination |
(12) | (10) | - | |||||||||
| Operating expenses related to joint ventures and associates |
144 | 146 | (1%) | |||||||||
| Operating expenses in result of operations |
1,641 | 1,573 | 4% | |||||||||
| Operating expenses related to joint ventures and associates |
(144) | (146) | 1% | |||||||||
| Amounts attributed to insurance acquisition cashflows |
(26) | (26) | - | |||||||||
| Restructuring expenses |
(135) | (17) | n.m. | |||||||||
| Operational improvement plan expenses |
(108) | (146) | 26% | |||||||||
| Acquisition and disposals |
(8) | (19) | 58% | |||||||||
| Addressable expenses |
1,220 | 1,218 | n.m. | |||||||||
| 7. | New life sales and net deposits / (outflows) data include results from Aegon’s joint ventures and Aegon’s associates consolidated on a proportionate basis. |
| 8. | The calculation of the Solvency II capital surplus and ratio are based on Solvency II requirements. For insurance entities in Solvency II equivalent regimes (United States, Bermuda and Brazil) local regulatory solvency measurements are used. Specifically, required capital for the regulated entities in the US is calculated as one and a half times (150%) the upper end of the Company Action Level range (200% of Authorized Control Level) as applied by the National Association of Insurance Commissioners in the US, while the own funds is calculated by applying a haircut to available capital under the local regulatory solvency measurement of one time (100%) the upper end of the Company Action Level range. For entities in financial sectors other than the insurance sector, the solvency requirements of the appropriate regulatory framework are taken into account in the group ratio. The group ratio does include Aegon Bank N.V. As the UK With-Profit funds is ring fenced, no surplus is taken into account regarding the UK With-Profit funds for Aegon UK and Group numbers. |
| 9. | The Solvency II capital ratio reflects Aegon’s interpretation of Solvency II requirements and are not final until filed with the regulators. The Solvency II capital calculation is subject to supervisory review on an ongoing basis. |
| 10. | World Financial Group (WFG) consists of: In the United States, World Financial Group Insurance Agency, LLC (in California, doing business as World Financial Insurance Agency, LLC), World Financial Group Insurance Agency of Hawaii, Inc., World Financial Group Insurance Agency of Massachusetts, Inc., and / or WFG Insurance Agency of Puerto Rico, Inc. (collectively WFGIA), which offer insurance and annuity products. In the United States, Transamerica Financial Advisors, Inc. is a full-service, fully licensed, independent broker-dealer and registered investment advisor. Transamerica Financial Advisors, Inc. (TFA), Member FINRA, MSRB, SIPC , and registered investment advisor, offers securities and investment advisory services. In Canada, World Financial Group Insurance Agency of Canada Inc. (WFGIAC), which offers life insurance and segregated funds. WFG Securities Inc. (WFGS), which offers mutual funds. WFGIAC and WFGS are affiliated companies. |
|
|
Unaudited | Page 131 of 131 |

1 Year Aegon Chart |
1 Month Aegon Chart |

It looks like you are not logged in. Click the button below to log in and keep track of your recent history.
Support: +44 (0) 203 8794 460 | support@advfn.com
By accessing the services available at ADVFN you are agreeing to be bound by ADVFN's Terms & Conditions
 Hot Features