
We could not find any results for:
Make sure your spelling is correct or try broadening your search.
| Share Name | Share Symbol | Market | Type |
|---|---|---|---|
| Zions Bancorporation NA | NASDAQ:ZION | NASDAQ | Common Stock |
| Price Change | % Change | Share Price | Bid Price | Offer Price | High Price | Low Price | Open Price | Shares Traded | Last Trade | |
|---|---|---|---|---|---|---|---|---|---|---|
| 0.89 | 2.13% | 42.72 | 41.99 | 42.69 | 42.73 | 41.525 | 42.45 | 1,871,892 | 22:11:06 |
UNITED STATES SECURITIES AND EXCHANGE COMMISSION Washington, D.C. 20549 | |||||
FORM 8-K | |||||
CURRENT REPORT | |||||
Pursuant to Section 13 OR 15(d) of The Securities Exchange Act of 1934 | |||||
Date of Report (Date of earliest event reported) | April 22, 2019 | ||||
ZIONS BANCORPORATION, NATIONAL ASSOCIATION | |||||
(Exact name of registrant as specified in its charter) | |||||
United States of America | 001-12307 | 87-0189025 | |||
(State or other jurisdiction of incorporation) | (Commission File Number) | (I.R.S. Employer Identification No.) | |||
One South Main, Salt Lake City, Utah | 84133 | ||||
(Address of principal executive offices) | (Zip Code) | ||||
Registrant’s telephone number, including area code | (801) 844-7637 | ||||
(Former name or former address, if changed since last report.) | |||||
Check the appropriate box below if the Form 8-K filing is intended to simultaneously satisfy the filing obligation of the registrant under any of the following provisions: | |||||
¨ | Written communications pursuant to Rule 425 under the Securities Act (17 CFR 230.425) | ||||
¨ | Soliciting material pursuant to Rule 14a-12 under the Exchange Act (17 CFR 240.14a-12) | ||||
¨ | Pre-commencement communications pursuant to Rule 14d-2(b) under the Exchange Act (17 CFR 240.14d-2(b)) | ||||
¨ | Pre-commencement communications pursuant to Rule 13e-4(c) under the Exchange Act (17 CFR 240.13a-4(c)) | ||||
ZIONS BANCORPORATION, NATIONAL ASSOCIATION | |||
By: | /s/ Paul E. Burdiss | ||
Name: | Paul E. Burdiss | ||
Title: | Executive Vice President and Chief Financial Officer | ||
Zions Bancorporation, N.A. One South Main Salt Lake City, UT 84133 April 22, 2019 |  |
www.zionsbancorporation.com | |
Zions Bancorporation, N.A. Reports: 1Q19 Net Earnings¹ of $205 million, diluted EPS of $1.04 |
compared with 1Q18 Net Earnings¹ of $231 million, diluted EPS of $1.09, and 4Q18 Net Earnings¹ of $217 million, diluted EPS of $1.08 |
$1.04 | $205 million | 3.68% | 11.3% | |||
Earnings per diluted common share | Net Earnings 1 | Net interest margin (“NIM”) | Common Equity Tier 1 | |||
FIRST QUARTER HIGHLIGHTS² | ||
Net Interest Income and NIM | • | Net interest income was $576 million, up 6% |
• | NIM was 3.68%, compared with 3.56% | |
• | Average noninterest-bearing deposits were generally stable at $23.2 billion, compared with $23.4 billion | |
Operating Performance | • | Pre-provision net revenue ("PPNR") was $284 million, up 7% |
• | Adjusted PPNR³ was $285 million, up 8% | |
• | Noninterest expense was $430 million, up 3% | |
• | Adjusted noninterest expense³ was $431 million, up 3% | |
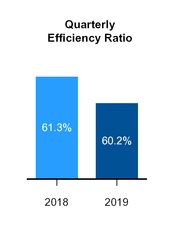
• | Efficiency ratio³ was 60.2%, compared with 61.3% | |
Loans and Credit Quality | • | Net loans and leases were $47.6 billion, up $2.5 billion, or 6% |
• | Classified loans were $729 million, down 29%; and nonperforming assets were $240 million, down 39% | |
• | Provision for credit losses was $4 million, compared with $(47) million | |
• | Zero net charge-offs in the current quarter, compared with 0.05% of average loans | |
Capital Returns | • | Return on average tangible common equity³ was 13.9%, compared with 15.5% |
• | Common stock repurchases of $275 million, 5.5 million shares, or 2.9% of shares outstanding as of December 31, 2018 | |
• | Common dividend increased to $0.30 per share from $0.20 per share | |
Notable Items | • | Successful implementation of core system upgrade for commercial loans in February |
CEO COMMENTARY |
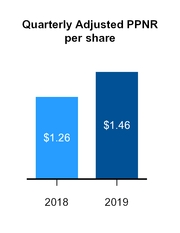
Harris H. Simmons, Chairman and CEO, commented, “First quarter results were fundamentally strong, with earnings per share of $1.04 as compared to $1.09 a year ago. However, the prior year’s first quarter included interest recoveries on several large loans equal to $0.04 per share and a negative provision for credit losses equal to $0.17 per share. Adjusted pre-provision net revenue per share increased 16%; at the same time, credit quality remained strong, with net charged-off loans, as a percentage of average loans and leases, of zero, compared to 0.05% a year ago. Average deposits increased 4% - with noninterest-bearing deposits declining less than 1% - and average loans and leases increased 5% over the prior year period. Economic conditions remain strong throughout the Bank’s market area and we are encouraged by the opportunities we’re seeing for continued healthy growth.” Mr. Simmons continued, “During the quarter we celebrated the successful completion of the second stage of our three-stage multi-year project to replace the Bank’s core loan and deposit systems. With this milestone reached, Zions now has all its retail, commercial and commercial real estate loans on a new modern core platform.” |
OPERATING PERFORMANCE3 |
¹ Net Earnings is net earnings applicable to common shareholders. ² Comparisons noted in the bullet points are calculated for the current quarter versus the same prior-year period, unless otherwise specified. ³ For information on non-GAAP financial measures and the reasons for which the Bank presents these numbers, see pages 16-18. |
Net Interest Income and Margin | |||||||||||||||||||||||||
1Q19 - 4Q18 | 1Q19 - 1Q18 | ||||||||||||||||||||||||
(In millions) | 1Q19 | 4Q18 | 1Q18 | $ | % | $ | % | ||||||||||||||||||
Interest and fees on loans | $ | 570 | $ | 555 | $ | 497 | $ | 15 | 3 | % | $ | 73 | 15 | % | |||||||||||
Interest on money market investments | 9 | 8 | 6 | 1 | 13 | 3 | 50 | ||||||||||||||||||
Interest on securities | 96 | 93 | 86 | 3 | 3 | 10 | 12 | ||||||||||||||||||
Total interest income | 675 | 656 | 589 | 19 | 3 | 86 | 15 | ||||||||||||||||||
Interest on deposits | 57 | 48 | 20 | 9 | 19 | 37 | NM | ||||||||||||||||||
Interest on short and long-term borrowings | 42 | 32 | 27 | 10 | 31 | 15 | 56 | ||||||||||||||||||
Total interest expense | 99 | 80 | 47 | 19 | 24 | 52 | NM | ||||||||||||||||||
Net interest income | $ | 576 | $ | 576 | $ | 542 | $ | — | — | $ | 34 | 6 | |||||||||||||
bps | bps | ||||||||||||||||||||||||
Yield on interest-earning assets | 4.31 | % | 4.17 | % | 3.87 | % | 14 | 44 | |||||||||||||||||
Rate paid on total deposits and interest-bearing liabilities | 0.67 | % | 0.54 | % | 0.33 | % | 13 | 34 | |||||||||||||||||
Cost of total deposits, annualized | 0.43 | % | 0.35 | % | 0.15 | % | 8 | 28 | |||||||||||||||||
Net interest margin | 3.68 | % | 3.67 | % | 3.56 | % | 1 | 12 | |||||||||||||||||
Noninterest Income | |||||||||||||||||||||||||
1Q19 - 4Q18 | 1Q19 - 1Q18 | ||||||||||||||||||||||||
(In millions) | 1Q19 | 4Q18 | 1Q18 | $ | % | $ | % | ||||||||||||||||||
Service charges and fees on deposit accounts | $ | 40 | $ | 41 | $ | 42 | $ | (1 | ) | (2 | )% | $ | (2 | ) | (5 | )% | |||||||||
Other service charges, commissions and fees | 54 | 59 | 55 | (5 | ) | (8 | ) | (1 | ) | (2 | ) | ||||||||||||||
Wealth management and trust income | 13 | 13 | 12 | — | — | 1 | 8 | ||||||||||||||||||
Loan sales and servicing income | 5 | 6 | 6 | (1 | ) | (17 | ) | (1 | ) | (17 | ) | ||||||||||||||
Capital markets and foreign exchange | 8 | 9 | 8 | (1 | ) | (11 | ) | — | — | ||||||||||||||||
Customer-related fees | 120 | 128 | 123 | (8 | ) | (6 | ) | (3 | ) | (2 | ) | ||||||||||||||
Dividends and other investment income | 9 | 10 | 11 | (1 | ) | (10 | ) | (2 | ) | (18 | ) | ||||||||||||||
Securities gains (losses), net | 1 | 2 | — | (1 | ) | (50 | ) | 1 | NM | ||||||||||||||||
Other | 2 | — | 4 | 2 | NM | (2 | ) | (50 | ) | ||||||||||||||||
Total noninterest income | $ | 132 | $ | 140 | $ | 138 | $ | (8 | ) | (6 | ) | $ | (6 | ) | (4 | ) | |||||||||
Noninterest Expense | |||||||||||||||||||||||||
1Q19 - 4Q18 | 1Q19 - 1Q18 | ||||||||||||||||||||||||
(In millions) | 1Q19 | 4Q18 | 1Q18 | $ | % | $ | % | ||||||||||||||||||
Salaries and employee benefits | $ | 287 | $ | 270 | $ | 269 | $ | 17 | 6 | % | $ | 18 | 7 | % | |||||||||||
Occupancy, net | 33 | 35 | 31 | (2 | ) | (6 | ) | 2 | 6 | ||||||||||||||||
Furniture, equipment and software, net | 32 | 31 | 33 | 1 | 3 | (1 | ) | (3 | ) | ||||||||||||||||
Other real estate expense, net | (1 | ) | — | — | (1 | ) | NM | (1 | ) | NM | |||||||||||||||
Credit-related expense | 6 | 6 | 7 | — | — | (1 | ) | (14 | ) | ||||||||||||||||
Professional and legal services | 11 | 15 | 12 | (4 | ) | (27 | ) | (1 | ) | (8 | ) | ||||||||||||||
Advertising | 5 | 6 | 5 | (1 | ) | (17 | ) | — | — | ||||||||||||||||
FDIC premiums | 6 | 6 | 13 | — | — | (7 | ) | (54 | ) | ||||||||||||||||
Other | 51 | 51 | 49 | — | — | 2 | 4 | ||||||||||||||||||
Total noninterest expense | $ | 430 | $ | 420 | $ | 419 | $ | 10 | 2 | $ | 11 | 3 | |||||||||||||
Adjusted noninterest expense 1 | $ | 431 | $ | 418 | $ | 419 | $ | 13 | 3 | $ | 12 | 3 | |||||||||||||
1 | For information on non-GAAP financial measures, see pages 16-18. |
Income Taxes | |||||||||||||
Asset Quality | |||||||||||||||||||||||||
1Q19 - 4Q18 | 1Q19 - 1Q18 | ||||||||||||||||||||||||
(In millions) | 1Q19 | 4Q18 | 1Q18 | bps | bps | ||||||||||||||||||||
Ratio of nonperforming assets to loans and leases and other real estate owned | 0.50 | % | 0.55 | % | 0.87 | % | (5 | ) | (37 | ) | |||||||||||||||
Annualized ratio of net loan and lease charge-offs (recoveries) to average loans | — | % | (0.07 | )% | 0.05 | % | 7 | (5 | ) | ||||||||||||||||
Ratio of allowance for loan losses to loans and leases, at period end | 1.04 | % | 1.06 | % | 1.05 | % | (2 | ) | (1 | ) | |||||||||||||||
$ | % | $ | % | ||||||||||||||||||||||
Classified loans | $ | 729 | $ | 698 | $ | 1,023 | $ | 31 | 4 | % | $ | (294 | ) | (29 | )% | ||||||||||
Nonperforming assets | 240 | 256 | 392 | (16 | ) | (6 | ) | (152 | ) | (39 | ) | ||||||||||||||
Net loan and lease charge-offs (recoveries) | — | (8 | ) | 5 | 8 | NM | (5 | ) | NM | ||||||||||||||||
Provision for credit losses | 4 | 6 | (47 | ) | (2 | ) | (33 | ) | 51 | NM | |||||||||||||||
Loans and Leases | |||||||||||||||||||||||||
1Q19 - 4Q18 | 1Q19 - 1Q18 | ||||||||||||||||||||||||
(In millions) | 1Q19 | 4Q18 | 1Q18 | $ | % | $ | % | ||||||||||||||||||
Loans held for sale | $ | 69 | $ | 93 | $ | 90 | $ | (24 | ) | (26 | )% | $ | (21 | ) | (23 | )% | |||||||||
Loans and leases: | |||||||||||||||||||||||||
Commercial | 24,598 | 24,162 | 23,140 | 436 | 2 | 1,458 | 6 | ||||||||||||||||||
Commercial real estate | 11,530 | 11,125 | 11,122 | 405 | 4 | 408 | 4 | ||||||||||||||||||
Consumer | 11,478 | 11,427 | 10,821 | 51 | — | 657 | 6 | ||||||||||||||||||
Loans and leases, net of unearned income and fees | 47,606 | 46,714 | 45,083 | 892 | 2 | 2,523 | 6 | ||||||||||||||||||
Less allowance for loan losses | 497 | 495 | 473 | 2 | — | 24 | 5 | ||||||||||||||||||
Loans held for investment, net of allowance | $ | 47,109 | $ | 46,219 | $ | 44,610 | $ | 890 | 2 | $ | 2,499 | 6 | |||||||||||||
Deposits | |||||||||||||||||||||||||
1Q19 - 4Q18 | 1Q19 - 1Q18 | ||||||||||||||||||||||||
(In millions) | 1Q19 | 4Q18 | 1Q18 | $ | % | $ | % | ||||||||||||||||||
Noninterest-bearing demand | $ | 23,259 | $ | 23,645 | $ | 23,909 | $ | (386 | ) | (2 | )% | $ | (650 | ) | (3 | )% | |||||||||
Interest-bearing: | |||||||||||||||||||||||||
Savings and money market | 26,348 | 26,120 | 25,473 | 228 | 1 | 875 | 3 | ||||||||||||||||||
Time | 4,928 | 4,336 | 3,581 | 592 | 14 | 1,347 | 38 | ||||||||||||||||||
Total deposits | $ | 54,535 | $ | 54,101 | $ | 52,963 | $ | 434 | 1 | $ | 1,572 | 3 | |||||||||||||
Shareholders’ Equity | |||||||||||||||||||||||||
1Q19 - 4Q18 | 1Q19 - 1Q18 | ||||||||||||||||||||||||
(In millions) | 1Q19 | 4Q18 | 1Q18 | $ | % | $ | % | ||||||||||||||||||
Shareholders’ equity: | |||||||||||||||||||||||||
Preferred stock | $ | 566 | $ | 566 | $ | 566 | $ | — | — | % | $ | — | — | % | |||||||||||
Common stock | — | — | 4,346 | — | NM | (4,346 | ) | NM | |||||||||||||||||
Additional paid-in capital | 3,541 | 3,806 | — | (265 | ) | (7 | ) | 3,541 | NM | ||||||||||||||||
Retained earnings | 3,603 | 3,456 | 2,999 | 147 | 4 | 604 | 20 | ||||||||||||||||||
Accumulated other comprehensive income (loss) | (122 | ) | (250 | ) | (267 | ) | 128 | 51 | 145 | 54 | |||||||||||||||
Total shareholders' equity | $ | 7,588 | $ | 7,578 | $ | 7,644 | $ | 10 | — | $ | (56 | ) | (1 | ) | |||||||||||
Capital distributions: | |||||||||||||||||||||||||
Common dividends paid | 56 | 57 | 40 | (1 | ) | (2 | ) | 16 | 40 | ||||||||||||||||
Bank common stock repurchased | 275 | 250 | 115 | 25 | 10 | 160 | NM | ||||||||||||||||||
Total capital distributed to common shareholders | 331 | 307 | 155 | 24 | 8 | 176 | NM | ||||||||||||||||||
Capital distributed as a percentage of net earnings applicable to common shareholders | 161 | % | 141 | % | 67 | % | |||||||||||||||||||
Three Months Ended | |||||||||||||||||||
(In millions, except share, per share, and ratio data) | March 31, 2019 | December 31, 2018 | September 30, 2018 | June 30, 2018 | March 31, 2018 | ||||||||||||||
BALANCE SHEET 1 | |||||||||||||||||||
Loans held for investment, net of allowance | $ | 47,109 | $ | 46,219 | $ | 45,330 | $ | 44,740 | $ | 44,610 | |||||||||
Total assets | 69,195 | 68,746 | 66,731 | 66,457 | 66,481 | ||||||||||||||
Deposits | 54,535 | 54,101 | 53,785 | 53,580 | 52,963 | ||||||||||||||
Total shareholders’ equity | 7,588 | 7,578 | 7,553 | 7,621 | 7,644 | ||||||||||||||
STATEMENT OF INCOME | |||||||||||||||||||
Net earnings applicable to common shareholders | $ | 205 | $ | 217 | $ | 215 | $ | 187 | $ | 231 | |||||||||
Net interest income | 576 | 576 | 565 | 548 | 542 | ||||||||||||||
Taxable-equivalent net interest income 2 | 582 | 582 | 570 | 553 | 547 | ||||||||||||||
Total noninterest income | 132 | 140 | 136 | 138 | 138 | ||||||||||||||
Total noninterest expense | 430 | 420 | 420 | 421 | 419 | ||||||||||||||
Adjusted pre-provision net revenue 2 | 285 | 305 | 291 | 270 | 265 | ||||||||||||||
Provision for credit losses | 4 | 6 | (11 | ) | 12 | (47 | ) | ||||||||||||
SHARE AND PER COMMON SHARE AMOUNTS | |||||||||||||||||||
Net earnings per diluted common share | $ | 1.04 | $ | 1.08 | $ | 1.04 | $ | 0.89 | $ | 1.09 | |||||||||
Dividends | 0.30 | 0.30 | 0.30 | 0.24 | 0.20 | ||||||||||||||
Book value per common share 1 | 38.47 | 37.39 | 36.36 | 36.11 | 35.92 | ||||||||||||||
Tangible book value per common share 1, 2 | 32.92 | 31.97 | 31.08 | 30.91 | 30.76 | ||||||||||||||
Weighted average share price | 47.71 | 46.61 | 52.80 | 55.19 | 53.82 | ||||||||||||||
Weighted average common and common-equivalent shares outstanding (in thousands) | 195,241 | 199,048 | 205,765 | 209,247 | 210,243 | ||||||||||||||
Common shares outstanding (in thousands) 1 | 182,513 | 187,554 | 192,169 | 195,392 | 197,050 | ||||||||||||||
SELECTED RATIOS AND OTHER DATA | |||||||||||||||||||
Return on average assets | 1.26 | % | 1.34 | % | 1.33 | % | 1.19 | % | 1.45 | % | |||||||||
Return on average common equity | 11.9 | % | 12.4 | % | 12.1 | % | 10.6 | % | 13.3 | % | |||||||||
Return on average tangible common equity 2 | 13.9 | % | 14.5 | % | 14.2 | % | 12.4 | % | 15.5 | % | |||||||||
Net interest margin | 3.68 | % | 3.67 | % | 3.63 | % | 3.56 | % | 3.56 | % | |||||||||
Cost of total deposits, annualized | 0.43 | % | 0.35 | % | 0.28 | % | 0.22 | % | 0.15 | % | |||||||||
Efficiency ratio 2 | 60.2 | % | 57.8 | % | 58.8 | % | 60.9 | % | 61.3 | % | |||||||||
Effective tax rate | 22.3 | % | 22.1 | % | 23.6 | % | 22.1 | % | 22.7 | % | |||||||||
Ratio of nonperforming assets to loans and leases and other real estate owned | 0.50 | % | 0.55 | % | 0.64 | % | 0.77 | % | 0.87 | % | |||||||||
Annualized ratio of net loan and lease charge-offs (recoveries) to average loans | — | % | (0.07 | )% | (0.01 | )% | (0.11 | )% | 0.05 | % | |||||||||
Ratio of total allowance for credit losses to loans and leases outstanding 1 | 1.17 | % | 1.18 | % | 1.17 | % | 1.21 | % | 1.16 | % | |||||||||
Full-time equivalent employees | 10,204 | 10,201 | 10,143 | 10,217 | 10,122 | ||||||||||||||
CAPITAL RATIOS AND DATA 1 | |||||||||||||||||||
Common equity tier 1 capital | $ | 6,124 | $ | 6,245 | $ | 6,331 | $ | 6,360 | $ | 6,333 | |||||||||
Risk-weighted assets | 54,404 | 53,591 | 52,493 | 52,012 | 51,779 | ||||||||||||||
Tangible common equity ratio | 8.8 | % | 8.9 | % | 9.1 | % | 9.2 | % | 9.3 | % | |||||||||
Common equity tier 1 capital ratio | 11.3 | % | 11.7 | % | 12.1 | % | 12.2 | % | 12.2 | % | |||||||||
Tier 1 leverage ratio | 9.9 | % | 10.3 | % | 10.5 | % | 10.5 | % | 10.5 | % | |||||||||
Tier 1 risk-based capital ratio | 12.3 | % | 12.7 | % | 13.1 | % | 13.3 | % | 13.3 | % | |||||||||
Total risk-based capital ratio | 13.5 | % | 13.9 | % | 14.6 | % | 14.8 | % | 14.8 | % | |||||||||
1 | At period end. |
2 | For information on non-GAAP financial measures, see pages 16-18. |
(In millions, shares in thousands) | March 31, 2019 | December 31, 2018 | September 30, 2018 | June 30, 2018 | March 31, 2018 | ||||||||||||||
(Unaudited) | (Unaudited) | (Unaudited) | (Unaudited) | ||||||||||||||||
ASSETS | |||||||||||||||||||
Cash and due from banks | $ | 536 | $ | 614 | $ | 517 | $ | 468 | $ | 470 | |||||||||
Money market investments: | |||||||||||||||||||
Interest-bearing deposits | 702 | 619 | 590 | 698 | 717 | ||||||||||||||
Federal funds sold and security resell agreements | 438 | 1,461 | 560 | 558 | 696 | ||||||||||||||
Investment securities: | |||||||||||||||||||
Held-to-maturity, at amortized cost (approximate fair value $762, $767, $734, $866 and $752) | 764 | 774 | 751 | 878 | 768 | ||||||||||||||
Available-for-sale, at fair value | 14,904 | 14,737 | 14,625 | 14,627 | 14,896 | ||||||||||||||
Trading account, at fair value | 316 | 106 | 176 | 207 | 143 | ||||||||||||||
Total investment securities | 15,984 | 15,617 | 15,552 | 15,712 | 15,807 | ||||||||||||||
Loans held for sale | 69 | 93 | 61 | 84 | 90 | ||||||||||||||
Loans and leases, net of unearned income and fees | 47,606 | 46,714 | 45,810 | 45,230 | 45,083 | ||||||||||||||
Less allowance for loan losses | 497 | 495 | 480 | 490 | 473 | ||||||||||||||
Loans held for investment, net of allowance | 47,109 | 46,219 | 45,330 | 44,740 | 44,610 | ||||||||||||||
Other noninterest-bearing investments | 993 | 1,046 | 1,027 | 1,054 | 1,073 | ||||||||||||||
Premises, equipment and software, net | 1,125 | 1,124 | 1,111 | 1,099 | 1,098 | ||||||||||||||
Goodwill and intangibles | 1,014 | 1,015 | 1,015 | 1,015 | 1,016 | ||||||||||||||
Other real estate owned | 6 | 4 | 4 | 5 | 5 | ||||||||||||||
Other assets | 1,219 | 934 | 964 | 1,024 | 899 | ||||||||||||||
Total assets | $ | 69,195 | $ | 68,746 | $ | 66,731 | $ | 66,457 | $ | 66,481 | |||||||||
LIABILITIES AND SHAREHOLDERS’ EQUITY | |||||||||||||||||||
Deposits: | |||||||||||||||||||
Noninterest-bearing demand | $ | 23,259 | $ | 23,645 | $ | 24,067 | $ | 24,007 | $ | 23,909 | |||||||||
Interest-bearing: | |||||||||||||||||||
Savings and money market | 26,348 | 26,120 | 25,462 | 25,562 | 25,473 | ||||||||||||||
Time | 4,928 | 4,336 | 4,256 | 4,011 | 3,581 | ||||||||||||||
Total deposits | 54,535 | 54,101 | 53,785 | 53,580 | 52,963 | ||||||||||||||
Federal funds purchased and other short-term borrowings | 4,944 | 5,653 | 3,780 | 4,158 | 4,867 | ||||||||||||||
Long-term debt | 1,228 | 724 | 879 | 383 | 383 | ||||||||||||||
Reserve for unfunded lending commitments | 59 | 57 | 58 | 58 | 51 | ||||||||||||||
Other liabilities | 841 | 633 | 676 | 657 | 573 | ||||||||||||||
Total liabilities | 61,607 | 61,168 | 59,178 | 58,836 | 58,837 | ||||||||||||||
Shareholders’ equity: | |||||||||||||||||||
Preferred stock, without par value; authorized 4,400 shares | 566 | 566 | 566 | 566 | 566 | ||||||||||||||
Common stock ($0.001 par value; authorized 350,000 shares; issued and outstanding 182,513, 187,554, 192,169, 195,392, and 197,050 shares) | — | — | — | 4,231 | 4,346 | ||||||||||||||
Additional paid-in-capital | 3,541 | 3,806 | 4,052 | — | — | ||||||||||||||
Retained earnings | 3,603 | 3,456 | 3,296 | 3,139 | 2,999 | ||||||||||||||
Accumulated other comprehensive income (loss) | (122 | ) | (250 | ) | (361 | ) | (315 | ) | (267 | ) | |||||||||
Total shareholders’ equity | 7,588 | 7,578 | 7,553 | 7,621 | 7,644 | ||||||||||||||
Total liabilities and shareholders’ equity | $ | 69,195 | $ | 68,746 | $ | 66,731 | $ | 66,457 | $ | 66,481 | |||||||||
Three Months Ended | |||||||||||||||||||
(In millions, except share and per share amounts) | March 31, 2019 | December 31, 2018 | September 30, 2018 | June 30, 2018 | March 31, 2018 | ||||||||||||||
Interest income: | |||||||||||||||||||
Interest and fees on loans | $ | 570 | $ | 555 | $ | 537 | $ | 514 | $ | 497 | |||||||||
Interest on money market investments | 9 | 8 | 8 | 7 | 6 | ||||||||||||||
Interest on securities | 96 | 93 | 86 | 85 | 86 | ||||||||||||||
Total interest income | 675 | 656 | 631 | 606 | 589 | ||||||||||||||
Interest expense: | |||||||||||||||||||
Interest on deposits | 57 | 48 | 38 | 29 | 20 | ||||||||||||||
Interest on short- and long-term borrowings | 42 | 32 | 28 | 29 | 27 | ||||||||||||||
Total interest expense | 99 | 80 | 66 | 58 | 47 | ||||||||||||||
Net interest income | 576 | 576 | 565 | 548 | 542 | ||||||||||||||
Provision for credit losses: | |||||||||||||||||||
Provision for loan losses | 2 | 7 | (11 | ) | 5 | (40 | ) | ||||||||||||
Provision for unfunded lending commitments | 2 | (1 | ) | — | 7 | (7 | ) | ||||||||||||
Total provision for credit losses | 4 | 6 | (11 | ) | 12 | (47 | ) | ||||||||||||
Net interest income after provision for loan losses | 572 | 570 | 576 | 536 | 589 | ||||||||||||||
Noninterest income: | |||||||||||||||||||
Service charges and fees on deposit accounts | 40 | 41 | 42 | 42 | 42 | ||||||||||||||
Other service charges, commissions and fees | 54 | 59 | 59 | 55 | 55 | ||||||||||||||
Wealth management and trust income | 13 | 13 | 12 | 14 | 12 | ||||||||||||||
Loan sales and servicing income | 5 | 6 | 5 | 7 | 6 | ||||||||||||||
Capital markets and foreign exchange | 8 | 9 | 7 | 7 | 8 | ||||||||||||||
Customer-related fees | 120 | 128 | 125 | 125 | 123 | ||||||||||||||
Dividends and other investment income | 9 | 10 | 11 | 11 | 11 | ||||||||||||||
Securities gains (losses), net | 1 | 2 | (1 | ) | 1 | — | |||||||||||||
Other | 2 | — | 1 | 1 | 4 | ||||||||||||||
Total noninterest income | 132 | 140 | 136 | 138 | 138 | ||||||||||||||
Noninterest expense: | |||||||||||||||||||
Salaries and employee benefits | 287 | 270 | 264 | 266 | 269 | ||||||||||||||
Occupancy, net | 33 | 35 | 33 | 32 | 31 | ||||||||||||||
Furniture, equipment and software, net | 32 | 31 | 30 | 32 | 33 | ||||||||||||||
Other real estate expense, net | (1 | ) | — | 1 | — | — | |||||||||||||
Credit-related expense | 6 | 6 | 5 | 7 | 7 | ||||||||||||||
Professional and legal services | 11 | 15 | 12 | 14 | 12 | ||||||||||||||
Advertising | 5 | 6 | 8 | 7 | 5 | ||||||||||||||
FDIC premiums | 6 | 6 | 18 | 14 | 13 | ||||||||||||||
Other | 51 | 51 | 49 | 49 | 49 | ||||||||||||||
Total noninterest expense | 430 | 420 | 420 | 421 | 419 | ||||||||||||||
Income before income taxes | 274 | 290 | 292 | 253 | 308 | ||||||||||||||
Income taxes | 61 | 64 | 69 | 56 | 70 | ||||||||||||||
Net income | 213 | 226 | 223 | 197 | 238 | ||||||||||||||
Preferred stock dividends | (8 | ) | (9 | ) | (8 | ) | (10 | ) | (7 | ) | |||||||||
Net earnings applicable to common shareholders | $ | 205 | $ | 217 | $ | 215 | $ | 187 | $ | 231 | |||||||||
Weighted average common shares outstanding during the period: | |||||||||||||||||||
Basic shares (in thousands) | 184,767 | 189,169 | 192,973 | 195,583 | 196,722 | ||||||||||||||
Diluted shares (in thousands) | 195,241 | 199,048 | 205,765 | 209,247 | 210,243 | ||||||||||||||
Net earnings per common share: | |||||||||||||||||||
Basic | $ | 1.10 | $ | 1.14 | $ | 1.11 | $ | 0.95 | $ | 1.16 | |||||||||
Diluted | 1.04 | 1.08 | 1.04 | 0.89 | 1.09 | ||||||||||||||
(In millions) | March 31, 2019 | December 31, 2018 | September 30, 2018 | June 30, 2018 | March 31, 2018 | ||||||||||||||
Commercial: | |||||||||||||||||||
Commercial and industrial | $ | 14,758 | $ | 14,513 | $ | 14,096 | $ | 14,134 | $ | 14,125 | |||||||||
Leasing | 312 | 327 | 332 | 358 | 371 | ||||||||||||||
Owner occupied | 7,754 | 7,661 | 7,548 | 7,365 | 7,345 | ||||||||||||||
Municipal | 1,774 | 1,661 | 1,563 | 1,388 | 1,299 | ||||||||||||||
Total commercial | 24,598 | 24,162 | 23,539 | 23,245 | 23,140 | ||||||||||||||
Commercial real estate: | |||||||||||||||||||
Construction and land development | 2,343 | 2,186 | 2,295 | 2,202 | 2,099 | ||||||||||||||
Term | 9,187 | 8,939 | 8,752 | 8,771 | 9,023 | ||||||||||||||
Total commercial real estate | 11,530 | 11,125 | 11,047 | 10,973 | 11,122 | ||||||||||||||
Consumer: | |||||||||||||||||||
Home equity credit line | 2,884 | 2,937 | 2,884 | 2,825 | 2,792 | ||||||||||||||
1-4 family residential | 7,294 | 7,176 | 7,039 | 6,861 | 6,768 | ||||||||||||||
Construction and other consumer real estate | 636 | 643 | 644 | 661 | 599 | ||||||||||||||
Bankcard and other revolving plans | 489 | 491 | 483 | 490 | 488 | ||||||||||||||
Other | 175 | 180 | 174 | 175 | 174 | ||||||||||||||
Total consumer | 11,478 | 11,427 | 11,224 | 11,012 | 10,821 | ||||||||||||||
Loans and leases, net of unearned income and fees | $ | 47,606 | $ | 46,714 | $ | 45,810 | $ | 45,230 | $ | 45,083 | |||||||||
(In millions) | March 31, 2019 | December 31, 2018 | September 30, 2018 | June 30, 2018 | March 31, 2018 | ||||||||||||||
Nonaccrual loans1 | $ | 234 | $ | 252 | $ | 288 | $ | 342 | $ | 387 | |||||||||
Other real estate owned | 6 | 4 | 4 | 5 | 5 | ||||||||||||||
Total nonperforming assets | $ | 240 | $ | 256 | $ | 292 | $ | 347 | $ | 392 | |||||||||
Ratio of nonperforming assets to loans1 and leases and other real estate owned | 0.50 | % | 0.55 | % | 0.64 | % | 0.77 | % | 0.87 | % | |||||||||
Accruing loans past due 90 days or more | $ | 8 | $ | 10 | $ | 12 | $ | 5 | $ | 16 | |||||||||
Ratio of accruing loans past due 90 days or more to loans1 and leases | 0.02 | % | 0.02 | % | 0.03 | % | 0.01 | % | 0.04 | % | |||||||||
Nonaccrual loans and accruing loans past due 90 days or more | $ | 242 | $ | 262 | $ | 300 | $ | 347 | $ | 403 | |||||||||
Ratio of nonaccrual loans and accruing loans past due 90 days or more to loans1 and leases | 0.51 | % | 0.56 | % | 0.65 | % | 0.77 | % | 0.89 | % | |||||||||
Accruing loans past due 30-89 days | $ | 142 | $ | 65 | $ | 87 | $ | 119 | $ | 98 | |||||||||
Restructured loans included in nonaccrual loans | 76 | 90 | 90 | 77 | 86 | ||||||||||||||
Restructured loans on accrual | 98 | 112 | 114 | 104 | 143 | ||||||||||||||
Classified loans | 729 | 698 | 784 | 947 | 1,023 | ||||||||||||||
Three Months Ended | |||||||||||||||||||
(In millions) | March 31, 2019 | December 31, 2018 | September 30, 2018 | June 30, 2018 | March 31, 2018 | ||||||||||||||
Allowance for Loan Losses | |||||||||||||||||||
Balance at beginning of period | $ | 495 | $ | 480 | $ | 490 | $ | 473 | $ | 518 | |||||||||
Provision for loan losses | 2 | 7 | (11 | ) | 5 | (40 | ) | ||||||||||||
Loan and lease charge-offs | 12 | 13 | 17 | 13 | 26 | ||||||||||||||
Less: Recoveries | 12 | 21 | 18 | 25 | 21 | ||||||||||||||
Net loan and lease charge-offs (recoveries) | — | (8 | ) | (1 | ) | (12 | ) | 5 | |||||||||||
Balance at end of period | $ | 497 | $ | 495 | $ | 480 | $ | 490 | $ | 473 | |||||||||
Ratio of allowance for loan losses to loans1 and leases, at period end | 1.04 | % | 1.06 | % | 1.05 | % | 1.08 | % | 1.05 | % | |||||||||
Ratio of allowance for loan losses to nonaccrual loans1 at period end | 212 | % | 201 | % | 167 | % | 143 | % | 131 | % | |||||||||
Annualized ratio of net loan and lease charge-offs (recoveries) to average loans | — | % | (0.07 | )% | (0.01 | )% | (0.11 | )% | 0.05 | % | |||||||||
Reserve for Unfunded Lending Commitments | |||||||||||||||||||
Balance at beginning of period | $ | 57 | $ | 58 | $ | 58 | $ | 51 | $ | 58 | |||||||||
Provision for unfunded lending commitments | 2 | (1 | ) | — | 7 | (7 | ) | ||||||||||||
Balance at end of period | $ | 59 | $ | 57 | $ | 58 | $ | 58 | $ | 51 | |||||||||
Allowance for Credit Losses | |||||||||||||||||||
Allowance for loan losses | $ | 497 | $ | 495 | $ | 480 | $ | 490 | $ | 473 | |||||||||
Reserve for unfunded lending commitments | 59 | 57 | 58 | 58 | 51 | ||||||||||||||
Total allowance for credit losses | $ | 556 | $ | 552 | $ | 538 | $ | 548 | $ | 524 | |||||||||
Ratio of total allowance for credit losses to loans1 and leases outstanding, at period end | 1.17 | % | 1.18 | % | 1.17 | % | 1.21 | % | 1.16 | % | |||||||||
(In millions) | March 31, 2019 | December 31, 2018 | September 30, 2018 | June 30, 2018 | March 31, 2018 | ||||||||||||||
Loans held for sale | $ | — | $ | 6 | $ | — | $ | — | $ | 26 | |||||||||
Commercial: | |||||||||||||||||||
Commercial and industrial | $ | 72 | $ | 82 | $ | 112 | $ | 142 | $ | 140 | |||||||||
Leasing | 1 | 2 | 2 | 7 | 8 | ||||||||||||||
Owner occupied | 69 | 67 | 66 | 63 | 80 | ||||||||||||||
Municipal | 1 | 1 | 1 | 1 | 1 | ||||||||||||||
Total commercial | 143 | 152 | 181 | 213 | 229 | ||||||||||||||
Commercial real estate: | |||||||||||||||||||
Construction and land development | 1 | — | — | 5 | 5 | ||||||||||||||
Term | 32 | 38 | 46 | 53 | 57 | ||||||||||||||
Total commercial real estate | 33 | 38 | 46 | 58 | 62 | ||||||||||||||
Consumer: | |||||||||||||||||||
Home equity credit line | 11 | 13 | 13 | 14 | 14 | ||||||||||||||
1-4 family residential | 45 | 42 | 47 | 56 | 54 | ||||||||||||||
Construction and other consumer real estate | 2 | — | — | 1 | 1 | ||||||||||||||
Bankcard and other revolving plans | — | 1 | 1 | — | 1 | ||||||||||||||
Other | — | — | — | — | — | ||||||||||||||
Total consumer | 58 | 56 | 61 | 71 | 70 | ||||||||||||||
Total nonaccrual loans | $ | 234 | $ | 252 | $ | 288 | $ | 342 | $ | 387 | |||||||||
(In millions) | March 31, 2019 | December 31, 2018 | September 30, 2018 | June 30, 2018 | March 31, 2018 | ||||||||||||||
Commercial: | |||||||||||||||||||
Commercial and industrial | $ | 1 | $ | (10 | ) | $ | (3 | ) | $ | (10 | ) | $ | — | ||||||
Leasing | — | — | — | — | 1 | ||||||||||||||
Owner occupied | 1 | — | (1 | ) | — | 1 | |||||||||||||
Municipal | — | — | — | — | — | ||||||||||||||
Total commercial | 2 | (10 | ) | (4 | ) | (10 | ) | 2 | |||||||||||
Commercial real estate: | |||||||||||||||||||
Construction and land development | — | (1 | ) | (2 | ) | (1 | ) | (2 | ) | ||||||||||
Term | (2 | ) | — | 4 | (2 | ) | — | ||||||||||||
Total commercial real estate | (2 | ) | (1 | ) | 2 | (3 | ) | (2 | ) | ||||||||||
Consumer: | |||||||||||||||||||
Home equity credit line | (1 | ) | — | (1 | ) | (1 | ) | 1 | |||||||||||
1-4 family residential | (1 | ) | — | — | — | 2 | |||||||||||||
Construction and other consumer real estate | — | — | — | — | — | ||||||||||||||
Bankcard and other revolving plans | 1 | 2 | 2 | 2 | 2 | ||||||||||||||
Other | 1 | 1 | — | — | — | ||||||||||||||
Total consumer loans | — | 3 | 1 | 1 | 5 | ||||||||||||||
Total net charge-offs (recoveries) | $ | — | $ | (8 | ) | $ | (1 | ) | $ | (12 | ) | $ | 5 | ||||||
Three Months Ended | ||||||||||||||||||||
March 31, 2019 | December 31, 2018 | March 31, 2018 | ||||||||||||||||||
(In millions) | Average balance | Average yield/rate 1 | Average balance | Average yield/rate 1 | Average balance | Average yield/rate 1 | ||||||||||||||
ASSETS | ||||||||||||||||||||
Money market investments | $ | 1,268 | 2.73 | % | $ | 1,302 | 2.53 | % | $ | 1,495 | 1.70 | % | ||||||||
Securities: | ||||||||||||||||||||
Held-to-maturity | 829 | 3.72 | % | 709 | 3.59 | % | 789 | 3.54 | % | |||||||||||
Available-for-sale | 14,724 | 2.49 | % | 14,567 | 2.40 | % | 14,948 | 2.18 | % | |||||||||||
Trading account | 107 | 4.52 | % | 89 | 4.15 | % | 102 | 4.00 | % | |||||||||||
Total securities | 15,660 | 2.57 | % | 15,365 | 2.46 | % | 15,839 | 2.25 | % | |||||||||||
Loans held for sale | 63 | 1.70 | % | 37 | 6.16 | % | 51 | 3.94 | % | |||||||||||
Loans held for investment:2 | ||||||||||||||||||||
Commercial | 24,427 | 5.05 | % | 23,745 | 4.90 | % | 23,040 | 4.70 | % | |||||||||||
Commercial real estate | 11,335 | 5.31 | % | 11,168 | 5.17 | % | 11,065 | 4.67 | % | |||||||||||
Consumer | 11,409 | 4.30 | % | 11,299 | 4.17 | % | 10,759 | 3.94 | % | |||||||||||
Total loans held for investment | 47,171 | 4.93 | % | 46,212 | 4.79 | % | 44,864 | 4.51 | % | |||||||||||
Total interest-earning assets | 64,162 | 4.31 | % | 62,916 | 4.17 | % | 62,249 | 3.87 | % | |||||||||||
Cash and due from banks | 554 | 542 | 592 | |||||||||||||||||
Allowance for loan losses | (499 | ) | (488 | ) | (523 | ) | ||||||||||||||
Goodwill and intangibles | 1,014 | 1,015 | 1,016 | |||||||||||||||||
Other assets | 3,353 | 3,040 | 3,032 | |||||||||||||||||
Total assets | $ | 68,584 | $ | 67,025 | $ | 66,366 | ||||||||||||||
LIABILITIES AND SHAREHOLDERS’ EQUITY | ||||||||||||||||||||
Interest-bearing deposits: | ||||||||||||||||||||
Savings and money market | $ | 26,021 | 0.54 | % | $ | 25,658 | 0.46 | % | $ | 25,296 | 0.19 | % | ||||||||
Time | 4,674 | 1.90 | % | 4,286 | 1.67 | % | 3,280 | 1.00 | % | |||||||||||
Total interest-bearing deposits | 30,695 | 0.75 | % | 29,944 | 0.63 | % | 28,576 | 0.28 | % | |||||||||||
Borrowed funds: | ||||||||||||||||||||
Federal funds purchased and other short-term borrowings | 5,289 | 2.57 | % | 3,728 | 2.36 | % | 5,707 | 1.54 | % | |||||||||||
Long-term debt | 880 | 4.08 | % | 795 | 4.86 | % | 383 | 5.83 | % | |||||||||||
Total borrowed funds | 6,169 | 2.78 | % | 4,523 | 2.80 | % | 6,090 | 1.81 | % | |||||||||||
Total interest-bearing liabilities | 36,864 | 1.09 | % | 34,467 | 0.92 | % | 34,666 | 0.55 | % | |||||||||||
Noninterest-bearing deposits | 23,221 | 24,295 | 23,417 | |||||||||||||||||
Total deposits and interest-bearing liabilities | 60,085 | 0.67 | % | 58,762 | 0.54 | % | 58,083 | 0.33 | % | |||||||||||
Other liabilities | 928 | 759 | 656 | |||||||||||||||||
Total liabilities | 61,013 | 59,521 | 58,739 | |||||||||||||||||
Shareholders’ equity: | ||||||||||||||||||||
Preferred equity | 566 | 566 | 566 | |||||||||||||||||
Common equity | 7,005 | 6,938 | 7,061 | |||||||||||||||||
Total shareholders’ equity | 7,571 | 7,504 | 7,627 | |||||||||||||||||
Total liabilities and shareholders’ equity | $ | 68,584 | $ | 67,025 | $ | 66,366 | ||||||||||||||
Spread on average interest-bearing funds | 3.22 | % | 3.25 | % | 3.32 | % | ||||||||||||||
Net yield on interest-earning assets | 3.68 | % | 3.67 | % | 3.56 | % | ||||||||||||||
Memo: total cost of deposits, annualized | 0.43 | % | 0.35 | % | 0.15 | % | ||||||||||||||
(In millions, except shares and per share amounts) | March 31, 2019 | December 31, 2018 | September 30, 2018 | June 30, 2018 | March 31, 2018 | |||||||||||||||
Tangible Book Value per Common Share | ||||||||||||||||||||
Total shareholders’ equity (GAAP) | $ | 7,588 | $ | 7,578 | $ | 7,553 | $ | 7,621 | $ | 7,644 | ||||||||||
Preferred stock | (566 | ) | (566 | ) | (566 | ) | (566 | ) | (566 | ) | ||||||||||
Goodwill and intangibles | (1,014 | ) | (1,015 | ) | (1,015 | ) | (1,015 | ) | (1,016 | ) | ||||||||||
Tangible common equity (non-GAAP) | (a) | $ | 6,008 | $ | 5,997 | $ | 5,972 | $ | 6,040 | $ | 6,062 | |||||||||
Common shares outstanding (in thousands) | (b) | 182,513 | 187,554 | 192,169 | 195,392 | 197,050 | ||||||||||||||
Tangible book value per common share (non-GAAP) | (a/b) | $ | 32.92 | $ | 31.97 | $ | 31.08 | $ | 30.91 | $ | 30.76 | |||||||||
Three Months Ended | ||||||||||||||||||||
(Dollar amounts in millions) | March 31, 2019 | December 31, 2018 | September 30, 2018 | June 30, 2018 | March 31, 2018 | |||||||||||||||
Return on Average Tangible Common Equity | ||||||||||||||||||||
Net earnings applicable to common shareholders (GAAP) | $ | 205 | $ | 217 | $ | 215 | $ | 187 | $ | 231 | ||||||||||
Adjustments, net of tax: | ||||||||||||||||||||
Amortization of core deposit and other intangibles | — | — | — | — | — | |||||||||||||||
Net earnings applicable to common shareholders, excluding the effects of the adjustments, net of tax (non-GAAP) | (a) | $ | 205 | $ | 217 | $ | 215 | $ | 187 | $ | 231 | |||||||||
Average common equity (GAAP) | $ | 7,005 | $ | 6,938 | $ | 7,024 | $ | 7,072 | $ | 7,061 | ||||||||||
Average goodwill and intangibles | (1,014 | ) | (1,015 | ) | (1,015 | ) | (1,016 | ) | (1,016 | ) | ||||||||||
Average tangible common equity (non-GAAP) | (b) | $ | 5,991 | $ | 5,923 | $ | 6,009 | $ | 6,056 | $ | 6,045 | |||||||||
Number of days in quarter | (c) | 90 | 92 | 92 | 91 | 90 | ||||||||||||||
Number of days in year | (d) | 365 | 365 | 365 | 365 | 365 | ||||||||||||||
Return on average tangible common equity (non-GAAP) | (a/b/c)*d | 13.9 | % | 14.5 | % | 14.2 | % | 12.4 | % | 15.5 | % | |||||||||
Three Months Ended | ||||||||||||||||||||
(In millions) | March 31, 2019 | December 31, 2018 | September 30, 2018 | June 30, 2018 | March 31, 2018 | |||||||||||||||
Efficiency Ratio | ||||||||||||||||||||
Noninterest expense (GAAP) | (a) | $ | 430 | $ | 420 | $ | 420 | $ | 421 | $ | 419 | |||||||||
Adjustments: | ||||||||||||||||||||
Severance costs | — | 2 | 2 | 1 | — | |||||||||||||||
Other real estate expense, net | (1 | ) | — | 1 | — | — | ||||||||||||||
Restructuring costs | — | — | 1 | — | — | |||||||||||||||
Total adjustments | (b) | (1 | ) | 2 | 4 | 1 | — | |||||||||||||
Adjusted noninterest expense (non-GAAP) | (a-b)=(c) | $ | 431 | $ | 418 | $ | 416 | $ | 420 | $ | 419 | |||||||||
Net interest income (GAAP) | (d) | $ | 576 | $ | 576 | $ | 565 | $ | 548 | $ | 542 | |||||||||
Fully taxable-equivalent adjustments | (e) | 6 | 6 | 5 | 5 | 5 | ||||||||||||||
Taxable-equivalent net interest income (non-GAAP) | (d+e)=(f) | 582 | 582 | 570 | 553 | 547 | ||||||||||||||
Noninterest income (GAAP) | (g) | 132 | 140 | 136 | 138 | 138 | ||||||||||||||
Combined income (non-GAAP) | (f+g)=(h) | 714 | 722 | 706 | 691 | 685 | ||||||||||||||
Adjustments: | ||||||||||||||||||||
Fair value and nonhedge derivative income | (3 | ) | (3 | ) | — | — | 1 | |||||||||||||
Securities gains (losses), net | 1 | 2 | (1 | ) | 1 | — | ||||||||||||||
Total adjustments | (i) | (2 | ) | (1 | ) | (1 | ) | 1 | 1 | |||||||||||
Adjusted taxable-equivalent revenue (non-GAAP) | (h-i)=(j) | $ | 716 | $ | 723 | $ | 707 | $ | 690 | $ | 684 | |||||||||
Pre-provision net revenue (PPNR) (non-GAAP) | (h)-(a) | $ | 284 | $ | 302 | $ | 286 | $ | 270 | $ | 266 | |||||||||
Adjusted PPNR (non-GAAP) | (j-c)=(k) | 285 | 305 | 291 | 270 | 265 | ||||||||||||||
Efficiency ratio (non-GAAP) | (c/j) | 60.2 | % | 57.8 | % | 58.8 | % | 60.9 | % | 61.3 | % | |||||||||
Adjusted PPNR per share | ||||||||||||||||||||
Adjusted PPNR (non-GAAP) | (k) | 285 | 305 | 291 | 270 | 265 | ||||||||||||||
Diluted shares (in thousands) | (l) | 195,241 | 199,048 | 205,765 | 209,247 | 210,243 | ||||||||||||||
Adjusted PPNR per share (non-GAAP) | (k)/(l) | 1.46 | 1.53 | 1.41 | 1.29 | 1.26 | ||||||||||||||
1 Year Zions Bancorporation NA Chart |
1 Month Zions Bancorporation NA Chart |

It looks like you are not logged in. Click the button below to log in and keep track of your recent history.
Support: +44 (0) 203 8794 460 | support@advfn.com
By accessing the services available at ADVFN you are agreeing to be bound by ADVFN's Terms & Conditions
 Hot Features