We could not find any results for:
Make sure your spelling is correct or try broadening your search.
| Share Name | Share Symbol | Market | Type |
|---|---|---|---|
| Veeco Instruments Inc DE | NASDAQ:VECO | NASDAQ | Common Stock |
| Price Change | % Change | Share Price | Bid Price | Offer Price | High Price | Low Price | Open Price | Shares Traded | Last Trade | |
|---|---|---|---|---|---|---|---|---|---|---|
| 1.37 | 3.41% | 41.53 | 41.00 | 42.32 | 41.75 | 40.435 | 40.69 | 456,979 | 22:16:11 |
UNITED STATES
SECURITIES AND EXCHANGE COMMISSION
Washington, D.C. 20549
FORM
CURRENT REPORT
PURSUANT TO SECTION 13 OR 15(d) OF THE
SECURITIES EXCHANGE ACT OF 1934
Date of Report (Date of earliest event reported):
(Exact name of registrant as specified in its charter)
|
|
|
(Address of principal executive offices)
(
(Registrant’s telephone number, including area code)
Not applicable
(Former name or former address, if changed since last report)
Check the appropriate box below if the Form 8-K filing is intended to simultaneously satisfy the filing obligation of the registrant under any of the following provisions (see General Instruction A.2. below):
Securities registered pursuant to Section 12(b) of the Act:
Title of each class | Trading Symbol(s) | Name of each exchange on which registered |
Indicate by check mark whether the registrant is an emerging growth company as defined in Rule 405 of the Securities Act of 1933 (§230.405 of this chapter) or Rule 12b-2 of the Securities Exchange Act of 1934 (§240.12b-2 of this chapter).
Emerging growth company
If an emerging growth company, indicate by check mark if the registrant has elected not to use the extended transition period for complying with any new or revised financial accounting standards provided pursuant to Section 13(a) of the Exchange Act. ☐
Item 2.02 Results of Operations and Financial Condition.
On May 7, 2024, Veeco Instruments Inc. issued a press release announcing its financial results for the quarter ended March 31, 2024. In connection with the release and the related conference call, Veeco posted a presentation relating to its first quarter 2024 financial results on its website (www.veeco.com). Copies of the press release and presentation are furnished as Exhibit 99.1 and Exhibit 99.2 to this report.
Item 9.01 Financial Statements and Exhibits.
(d) Exhibits.
EXHIBIT INDEX
Exhibit |
| Description |
99.1 | ||
99.2 | ||
104 | Cover Page Interactive Data File (formatted as inline XBRL). |
Limitation on Incorporation by Reference
In accordance with general instruction B.2 of Form 8-K, the information in this report, including exhibits, is furnished pursuant to Items 2.02 and 9.01 and shall not be deemed “filed” for purposes of Section 18 of the Securities Exchange Act of 1934, as amended (the “Exchange Act”), or otherwise subject to the liability of that section, nor shall this information or exhibits be deemed to be incorporated by reference into any filing under the Securities Act of 1933, as amended, or the Exchange Act, except as expressly set forth by specific reference in such a filing.
SIGNATURES
Pursuant to the requirements of the Securities Exchange Act of 1934, the registrant has duly caused this report to be signed on its behalf by the undersigned hereunto duly authorized.
May 7, 2024 | VEECO INSTRUMENTS INC. | |
By: | /s/ Kirk Mackey | |
Name: Kirk Mackey | ||
Title: Vice President, General Counsel | ||
2
EXHIBIT 99.1

VEECO REPORTS FIRST QUARTER 2024 FINANCIAL RESULTS
First Quarter 2024 Highlights:
| ● | Revenue of $174.5 million, compared with $153.5 million in the same period last year |
| ● | GAAP net income of $21.9 million, or $0.37 per diluted share, compared with $8.7 million, or $0.17 per diluted share in the same period last year |
| ● | Non-GAAP net income of $26.4 million, or $0.45 per diluted share, compared with $16.9 million, or $0.30 per diluted share in the same period last year |
Plainview, N.Y., May 7, 2024 -- Veeco Instruments Inc. (Nasdaq: VECO) today announced financial results for its first quarter ended March 31, 2024. Results are reported in accordance with U.S. generally accepted accounting principles (“GAAP”) and are also reported adjusting for certain items (“Non-GAAP”). A reconciliation between GAAP and Non-GAAP operating results is provided at the end of this press release.
U.S. Dollars in millions, except per share data |
GAAP Results |
| Q1 '24 | | Q1 '23 | ||
Revenue | | $ | 174.5 | | $ | 153.5 |
Net income | | $ | 21.9 | | $ | 8.7 |
Diluted earnings per share | | $ | 0.37 | | $ | 0.17 |
Non-GAAP Results |
| Q1 '24 | | Q1 '23 | ||
Operating income | | $ | 29.4 | | $ | 20.4 |
Net income | | $ | 26.4 | | $ | 16.9 |
Diluted earnings per share | | $ | 0.45 | | $ | 0.30 |
“We delivered solid top and bottom line results toward the high-end of our guidance, led by record quarterly Semiconductor revenue.” commented Bill Miller, Ph.D., Veeco’s Chief Executive Officer. “We’re pleased to have received a multi-tool laser annealing order, including a Nanosecond annealing system, from a leading edge Semiconductor company for their 2 nanometer gate-all-around process. Our Laser Annealing business continues to gain share at our customers most advanced nodes, with this win further validating our position.”
1
Guidance and Outlook
The following guidance is provided for Veeco’s second quarter 2024:
| ● | Revenue is expected in the range of $165 million to $185 million |
| ● | GAAP diluted earnings per share are expected in the range of $0.22 to $0.33 |
| ● | Non-GAAP diluted earnings per share are expected in the range of $0.38 to $0.48 |
Conference Call Information
A conference call reviewing these results has been scheduled for today, May 7, 2024 starting at 5:00pm ET. To join the call, dial 1-877-407-8029 (toll-free) or 1-201-689-8029. Participants may also access a live webcast of the call by visiting the investor relations section of Veeco's website at ir.veeco.com. A replay of the webcast will be made available on the Veeco website that evening. We will post an accompanying slide presentation to our website prior to the beginning of the call.
About Veeco
Veeco (NASDAQ: VECO) is an innovative manufacturer of semiconductor process equipment. Our laser annealing, ion beam, chemical vapor deposition (CVD), metal organic chemical vapor deposition (MOCVD), single wafer etch & clean and lithography technologies play an integral role in the fabrication and packaging of advanced semiconductor devices. With equipment designed to optimize performance, yield and cost of ownership, Veeco holds leading technology positions in the markets we serve. To learn more about Veeco’s systems and service offerings, visit www.veeco.com.
Forward-looking Statements
This press release contains “forward-looking statements”, within the meaning of the safe harbor provisions of the U.S. Private Securities Litigation Reform Act of 1995, as amended, that are based on management’s expectations, estimates, projections and assumptions. Words such as “expects,” “anticipates,” “plans,” “believes,” “scheduled,” “estimates” and variations of these words and similar expressions are intended to identify forward-looking statements. Forward-looking statements include, but are not limited to, those regarding anticipated growth and trends in our businesses and markets, industry outlooks and demand drivers, our investment and growth strategies, our development of new products and technologies, our business outlook for current and future periods, our ongoing transformation initiative and the effects thereof on our operations and financial results; and other statements that are not historical facts. These statements and their underlying assumptions are subject to risks and uncertainties and are not guarantees of future performance. Factors that could cause actual results to differ materially from those expressed or implied by such statements include, without limitation: the level of demand for our products; global economic and industry conditions; global trade issues, including the ongoing trade disputes between the U.S. and China, and changes in trade and export license policies; our dependency on third-party suppliers and outsourcing partners; the timing of customer orders; our ability to develop, deliver and support new products and technologies; our ability to expand our current markets, increase market share and develop new markets; the concentrated nature of our customer base; our ability to obtain and protect intellectual property rights in key technologies; the effects of regional or global health epidemics; our ability to achieve the objectives of operational and strategic initiatives and attract, motivate and retain key employees; the variability of results among products and end-markets, and our ability to accurately forecast future results, market conditions, and customer requirements; the impact of our indebtedness, including our convertible senior notes and our capped call transactions; and other risks and uncertainties described in our SEC filings on Forms 10-K, 10-Q and 8-K, and from time-to-time in our other SEC reports. All forward-looking statements speak only to management’s expectations, estimates, projections and assumptions as of the date of this press release or, in the case of any document referenced herein or incorporated by reference, the date of that document. The Company does not undertake any obligation to update or publicly revise any forward-looking statements to reflect events, circumstances or changes in expectations after the date of this press release.
-financial tables attached-
Veeco Contacts:
Investors:Anthony Pappone (516) 500-8798apappone@veeco.com
Media:Kevin Long (516) 714-3978klong@veeco.com
2
Veeco Instruments Inc. and Subsidiaries
Condensed Consolidated Statements of Operations
(in thousands, except per share amounts)
(unaudited)
| | Three months ended March 31, |
| ||||
|
| 2024 |
| 2023 |
| ||
Net sales |
| $ | 174,484 |
| $ | 153,504 | |
Cost of sales | |
| 99,065 | |
| 91,487 | |
Gross profit | |
| 75,419 | |
| 62,017 | |
Operating expenses, net: | | | | | | | |
Research and development | |
| 29,642 | |
| 27,562 | |
Selling, general, and administrative | |
| 24,700 | |
| 22,627 | |
Amortization of intangible assets | |
| 1,891 | |
| 2,111 | |
Other operating expense (income), net | |
| (2,859) | |
| (89) | |
Total operating expenses, net | |
| 53,374 | |
| 52,211 | |
Operating income | |
| 22,045 | |
| 9,806 | |
Interest expense, net | |
| 705 | |
| (802) | |
Income before income taxes | |
| 22,750 | |
| 9,004 | |
Income tax expense | |
| 896 | |
| 263 | |
Net income |
| $ | 21,854 |
| $ | 8,741 | |
| | | | | | | |
Income per common share: | | | | | | | |
Basic |
| $ | 0.39 |
| $ | 0.17 | |
Diluted |
| $ | 0.37 |
| $ | 0.17 | |
| | | | | | | |
Weighted average number of shares: | | | | | | | |
Basic | |
| 55,968 | |
| 50,559 | |
Diluted | |
| 60,764 | |
| 59,856 | |
3
Veeco Instruments Inc. and Subsidiaries
Condensed Consolidated Balance Sheets
(in thousands)
| | March 31, | | December 31, | ||
|
| 2024 |
| 2023 | ||
| | (unaudited) | | | | |
Assets | | | | | | |
Current assets: | | | | | | |
Cash and cash equivalents | | $ | 173,998 | | $ | 158,781 |
Restricted cash | |
| 326 | |
| 339 |
Short-term investments | |
| 122,886 | |
| 146,664 |
Accounts receivable, net | |
| 106,532 | |
| 103,018 |
Contract assets | |
| 34,336 | |
| 24,370 |
Inventories | |
| 243,266 | |
| 237,635 |
Prepaid expenses and other current assets | |
| 34,550 | |
| 35,471 |
Total current assets | |
| 715,894 | |
| 706,278 |
Property, plant and equipment, net | |
| 115,297 | |
| 118,459 |
Operating lease right-of-use assets | | | 23,685 | |
| 24,377 |
Intangible assets, net | |
| 42,054 | |
| 43,945 |
Goodwill | |
| 214,964 | |
| 214,964 |
Deferred income taxes | |
| 118,724 | |
| 117,901 |
Other assets | |
| 3,075 | |
| 3,117 |
Total assets | | $ | 1,233,693 | | $ | 1,229,041 |
| | | | | | |
Liabilities and stockholders’ equity | | | | | | |
Current liabilities: | | | | | | |
Accounts payable | | $ | 54,011 | | $ | 42,383 |
Accrued expenses and other current liabilities | |
| 59,259 | |
| 57,624 |
Contract liabilities | |
| 93,812 | |
| 118,026 |
Income taxes payable | |
| 852 | |
| — |
Current portion of long-term debt | | | 26,425 | | | — |
Total current liabilities | |
| 234,359 | |
| 218,033 |
Deferred income taxes | |
| 6,496 | |
| 6,552 |
Long-term debt | |
| 248,811 | |
| 274,941 |
Long-term operating lease liabilities | | | 30,949 | |
| 31,529 |
Other liabilities | |
| 25,168 | |
| 25,544 |
Total liabilities | |
| 545,783 | |
| 556,599 |
| | | | | | |
Total stockholders’ equity | |
| 687,910 | |
| 672,442 |
Total liabilities and stockholders’ equity | | $ | 1,233,693 | | $ | 1,229,041 |
Note on Reconciliation Tables
The below tables include financial measures adjusted for the impact of certain items; these financial measures are therefore not calculated in accordance with U.S. generally accepted accounting principles (“GAAP”). These Non-GAAP financial measures exclude items such as: share-based compensation expense; charges relating to restructuring initiatives; non-cash asset impairments; certain other non-operating gains and losses; and acquisition-related items such as transaction costs, non-cash amortization of acquired intangible assets, and certain integration costs.
These Non-GAAP financial measures may be different from Non-GAAP financial measures used by other companies. Non-GAAP financial measures should not be considered a substitute for, or superior to, measures of financial performance prepared in accordance with GAAP. By excluding these items, Non-GAAP financial measures are intended to facilitate meaningful comparisons to historical operating results, competitors’ operating results, and estimates made by securities analysts. Management is evaluated on key performance metrics including Non-GAAP Operating income (loss), which is used to determine management incentive compensation as well as to forecast future periods. These Non-GAAP financial measures may be useful to investors in allowing for greater transparency of supplemental information used by management in its financial and operational decision-making. In addition, similar Non-GAAP financial measures have historically been reported to investors; the inclusion of comparable numbers provides consistency in financial reporting. Investors are encouraged to review the reconciliation of the Non-GAAP financial measures used in this news release to their most directly comparable GAAP financial measures.
4
Reconciliation of GAAP to Non-GAAP Financial Data (Q1 2024)
(in thousands)
(unaudited)
| | | | | Non-GAAP Adjustments | | | |
| ||||
| | | | | Share-Based | | | | | | | |
|
Three months ended March 31, 2024 |
| GAAP |
| Compensation |
| Amortization |
| Other |
| Non-GAAP |
| ||
Net sales | | $ | 174,484 | | | | | | | | $ | 174,484 |
|
Gross profit |
| | 75,419 |
| 1,730 | | |
| |
| | 77,149 | |
Gross margin |
| | 43.2 | % | | | | | |
| | 44.2 | % |
Operating expenses |
| | 53,374 |
| (6,352) | | (1,891) | | 2,658 | | | 47,789 | |
Operating income |
| | 22,045 |
| 8,082 | | 1,891 |
| (2,658) | ^ | | 29,360 | |
Net income |
| | 21,854 |
| 8,082 |
| 1,891 |
| (5,384) | ^ | | 26,443 | |
^ | - See table below for additional details. |
Other Non-GAAP Adjustments (Q1 2024)
(in thousands)
(unaudited)
Three months ended March 31, 2024 |
| |
Changes in contingent consideration | $ | (625) |
Sale of productive assets | | (2,033) |
Subtotal | | (2,658) |
Non-cash interest expense |
| 296 |
Non-GAAP tax adjustment * |
| (3,022) |
Total Other | $ | (5,384) |
* | - The ‘with or without’ method is utilized to determine the income tax effect of all Non-GAAP adjustments. |
Net Income per Common Share (Q1 2024)
(in thousands, except per share amounts)
(unaudited)
| | Three months ended March 31, 2024 | ||||
| | GAAP | | Non-GAAP | ||
Numerator: | | | | | | |
Net income |
| $ | 21,854 |
| $ | 26,443 |
Interest expense associated with 2025 and 2027 Convertible Senior Notes | |
| 514 |
|
| 466 |
Net income available to common shareholders | | $ | 22,368 | | $ | 26,909 |
| | | | | | |
Denominator: | | | | | | |
Basic weighted average shares outstanding | | | 55,968 | | | 55,968 |
Effect of potentially dilutive share-based awards | | | 939 | | | 939 |
Dilutive effect of 2025 Convertible Senior Notes | | | 1,104 | | | 1,104 |
Dilutive effect of 2027 Convertible Senior Notes (1) | |
| 1,788 |
|
| 1,354 |
Dilutive effect of 2029 Convertible Senior Notes | |
| 965 |
|
| 965 |
Diluted weighted average shares outstanding | | | 60,764 | | | 60,330 |
| | | | | | |
Net income per common share: | | | | | | |
Basic | | $ | 0.39 | | $ | 0.47 |
Diluted | | $ | 0.37 | | $ | 0.45 |
(1) - The non-GAAP incremental dilutive shares includes the impact of the Company’s capped call transaction issued concurrently with our 2027 Notes, and as such, an effective conversion price of $18.46 is used when determining incremental shares to add to the dilutive share count. The GAAP incremental dilutive shares does not include the impact of the Company’s capped call transaction, and as such, an effective conversion price of $13.98 is used when determining incremental shares to add to the dilutive share count.
5
Reconciliation of GAAP to Non-GAAP Financial Data (Q1 2023)
(in thousands, except per share amounts)
(unaudited)
| | | | | Non-GAAP Adjustments | |
| | | ||||
| | | | | Share-based | | | | | | | | |
Three months ended March 31, 2023 |
| | GAAP |
| Compensation |
| Amortization |
| Other |
| Non-GAAP | | |
Net sales | | $ | 153,504 | | | | | | | | $ | 153,504 | |
Gross profit | |
| 62,017 |
| 1,451 | | |
| 232 | |
| 63,700 | |
Gross margin | |
| 40.4 | % | | | | | | | | 41.5 | % |
Operating expenses | |
| 52,211 |
| (5,576) | | (2,111) | | (1,266) | | | 43,258 | |
Operating income | |
| 9,806 |
| 7,027 | | 2,111 |
| 1,498 | ^ | | 20,442 | |
Net income | |
| 8,741 |
| 7,027 |
| 2,111 |
| (1,006) | ^ | | 16,873 | |
| | | | | | | | | | | | | |
^ | - See table below for additional details. |
Other Non-GAAP Adjustments (Q1 2023)
(in thousands)
(unaudited)
Three months ended March 31, 2023 | | |
Transition expenses related to San Jose expansion project | $ | 780 |
Acquisition related | | 718 |
Subtotal | | 1,498 |
Non-cash interest expense |
| 226 |
Non-GAAP tax adjustment * |
| (2,730) |
Total Other | $ | (1,006) |
* | - The ‘with or without’ method is utilized to determine the income tax effect of all Non-GAAP adjustments. |
Net Income per Common Share (Q1 2023)
(in thousands, except per share amounts)
(unaudited)
| | Three months ended March 31, 2023 | ||||
| | GAAP | | Non-GAAP | ||
Numerator: | | | | | | |
Net income |
| $ | 8,741 |
| $ | 16,873 |
Interest expense associated with convertible notes | |
| 1,277 |
|
| 2,354 |
Net income available to common shareholders | | $ | 10,018 | | $ | 19,227 |
| | | | | | |
Denominator: | | | | | | |
Basic weighted average shares outstanding | | | 50,559 | | | 50,559 |
Effect of potentially dilutive share-based awards | | | 355 | | | 355 |
Dilutive effect of 2023 Convertible Senior Notes | | | — | | | 82 |
Dilutive effect of 2025 Convertible Senior Notes | | | — | | | 5,521 |
Dilutive effect of 2027 Convertible Senior Notes (1) | |
| 8,942 |
|
| 6,771 |
Diluted weighted average shares outstanding | | | 59,856 | | | 63,288 |
| | | | | | |
Net income per common share: | | | | | | |
Basic | | $ | 0.17 | | $ | 0.33 |
Diluted | | $ | 0.17 | | $ | 0.30 |
(1) - The non-GAAP incremental dilutive shares includes the impact of the Company’s capped call transaction issued concurrently with our 2027 Notes, and as such, an effective conversion price of $18.46 is used when determining incremental shares to add to the dilutive share count. The GAAP incremental dilutive shares does not include the impact of the Company’s capped call transaction, and as such, an effective conversion price of $13.98 is used when determining incremental shares to add to the dilutive share count.
6
Reconciliation of GAAP Net Income to Non-GAAP Operating Income (Q1 2024 and 2023)
(in thousands)
(unaudited)
|
| Three months ended |
| Three months ended | ||
| | March 31, 2024 | | March 31, 2023 | ||
GAAP Net income | | $ | 21,854 | | $ | 8,741 |
Share-based compensation | |
| 8,082 | |
| 7,027 |
Amortization | |
| 1,891 | |
| 2,111 |
Sale of productive assets | |
| (2,033) | |
| — |
Changes in contingent consideration | |
| (625) | |
| — |
Transition expenses related to San Jose expansion project | | | — | | | 780 |
Acquisition related | |
| — | |
| 718 |
Interest (income) expense, net | |
| (705) | |
| 802 |
Income tax expense | |
| 896 | |
| 263 |
Non-GAAP Operating income | | $ | 29,360 | | $ | 20,442 |
Reconciliation of GAAP to Non-GAAP Financial Data (Q2 2024)
(in millions, except per share amounts)
(unaudited)
| | | | | | | | | | Non-GAAP Adjustments | | | | | | | | |
| ||||
Guidance for the three months ending | | | | | | | | | | Share-based | | | | | | | | | | | | |
|
June 30, 2024 | | GAAP | | Compensation | | Amortization | | Other | | Non-GAAP |
| ||||||||||||
Net sales |
| $ | 165 |
| - |
| $ | 185 |
| |
| |
| |
| $ | 165 |
| - |
| $ | 185 | |
Gross profit | |
| 69 |
| - | |
| 80 |
| 2 |
| — |
| — | |
| 71 |
| - | |
| 82 | |
Gross margin | |
| 42% | | - | |
| 43% | | |
| |
| | |
| 43% | | - | |
| 44% | |
Operating expenses | | | 55 |
| - | |
| 57 | | (7) | | (2) | | — | | | 46 |
| - | |
| 48 | |
Operating income | | | 14 | | - | | | 23 | | 9 | | 2 | | — | | | 25 | | - | | | 33 | |
Net income | | $ | 13 |
| - | | $ | 20 |
| 9 |
| 2 | | (2) | | $ | 22 |
| - | | $ | 29 | |
| | | | | | | | | | | | | | | | | | | | | | | |
Income per diluted common share | | $ | 0.22 |
| - | | $ | 0.33 |
|
|
|
|
|
| | $ | 0.38 |
| - | | $ | 0.48 | |
7
Income per Diluted Common Share (Q2 2024)
(in millions, except per share amounts)
(unaudited)
Guidance for the three months ending June 30, 2024 | | GAAP | | Non-GAAP | ||||||||||||
Numerator: | | | | | | | | | | | | | | | | |
Net income |
| $ | 13 |
| - |
| $ | 20 |
| $ | 22 |
| - |
| $ | 29 |
Interest expense associated with convertible notes | |
| — |
| | |
| — |
|
| — |
| | |
| — |
Net income available to common shareholders | | $ | 13 | | - | | $ | 20 | | $ | 22 | | - | | $ | 29 |
| | | | | | | | | | | | | | | | |
Denominator: | | | | | | | | | | | | | | | | |
Basic weighted average shares outstanding | | | 56 | | | | | 56 | | | 56 | | | | | 56 |
Effect of potentially dilutive share-based awards | | | 2 |
| | | | 2 | | | 2 |
| | | | 2 |
Dilutive effect of 2025 Convertible Senior Notes | | | 1 | | | | | 1 | | | 1 | | | | | 1 |
Dilutive effect of 2027 Convertible Senior Notes (1) | | | 2 |
| | | | 2 |
| | 1 |
| | | | 1 |
Dilutive effect of 2029 Convertible Senior Notes | |
| 1 | | | |
| 1 |
|
| 1 | | | |
| 1 |
Diluted weighted average shares outstanding | | | 62 | | | | | 62 | | | 61 | | | | | 61 |
| | | | | | | | | | | | | | | | |
Net income per common share: | | | | | | | | | | | | | | | | |
Income per diluted common share | | $ | 0.22 | | - | | $ | 0.33 | | $ | 0.38 | | - | | $ | 0.48 |
(1) - The non-GAAP incremental dilutive shares includes the impact of the Company’s capped call transaction issued concurrently with our 2027 Notes, and as such, an effective conversion price of $18.46 is used when determining incremental shares to add to the dilutive share count. The GAAP incremental dilutive shares does not include the impact of the Company’s capped call transaction, and as such, an effective conversion price of $13.98 is used when determining incremental shares to add to the dilutive share count.
Reconciliation of GAAP Net Income to Non-GAAP Operating Income (Q2 2024)
(in millions)
(unaudited)
Guidance for the three months ending June 30, 2024 |
| | |
| |
| | |
GAAP Net income | | $ | 13 |
| - | | $ | 20 |
Share-based compensation | |
| 9 |
| - | |
| 9 |
Amortization | |
| 2 |
| - | |
| 2 |
Interest income, net | |
| (1) |
| - | |
| (1) |
Income tax expense | | | 2 | | - | | | 3 |
Non-GAAP Operating income | | $ | 25 |
| - | | $ | 33 |
Note: Amounts may not calculate precisely due to rounding.
8
| Q1 2024 Financial Results Conference Call Copyright © 2024 Veeco Instruments Inc. All Rights Reserved. 1 Veeco Instruments Q1 2024 Financial Results Conference Call May 7th, 2024 |
| Q1 2024 Financial Results Conference Call Copyright © 2024 Veeco Instruments Inc. All Rights Reserved. 2 Safe Harbor This presentation contains “forward-looking statements”, within the meaning of the safe harbor provisions of the U.S. Private Securities Litigation Reform Act of 1995, as amended, that are based on management’s expectations, estimates, projections and assumptions. Words such as “expects,” “anticipates,” “plans,” “believes,” “scheduled,” “estimates” and variations of these words and similar expressions are intended to identify forward-looking statements. Forward-looking statements include, but are not limited to, those regarding anticipated growth and trends in our businesses and markets, industry outlooks and demand drivers, our investment and growth strategies, our development of new products and technologies, our business outlook for current and future periods, our ongoing transformation initiative and the effects thereof on our operations and financial results; and other statements that are not historical facts. These statements and their underlying assumptions are subject to risks and uncertainties and are not guarantees of future performance. Factors that could cause actual results to differ materially from those expressed or implied by such statements include, without limitation: global trade issues, including the ongoing trade disputes between the U.S. and China, and changes in trade and export license policies; the level of demand for our products; global economic and industry conditions; global conflicts; our dependency on third-party suppliers and outsourcing partners; the timing of customer orders; our ability to develop, deliver and support new products and technologies; our ability to expand our current markets, increase market share and develop new markets; the concentrated nature of our customer base; cybersecurity attacks and our ability to safeguard sensitive information and protect our intellectual property rights in key technologies; the effects of regional or global health epidemics; our ability to achieve the objectives of operational and strategic initiatives and attract, motivate and retain key employees; the variability of results among products and end-markets, and our ability to accurately forecast future results, market conditions, and customer requirements; the impact of our indebtedness, including our convertible senior notes and our capped call transactions; and other risks and uncertainties described in our SEC filings on Forms 10-K, 10-Q and 8-K, and from time-to-time in our other SEC reports. All forward-looking statements speak only to management’s expectations, estimates, projections and assumptions as of the date of this presentation. The Company does not undertake any obligation to update or publicly revise any forward-looking statements to reflect events, circumstances or changes in expectations after the date of this presentation. |
| Q1 2024 Financial Results Conference Call Copyright © 2024 Veeco Instruments Inc. All Rights Reserved. 3 Bill Miller, Ph.D. CEO Overview |
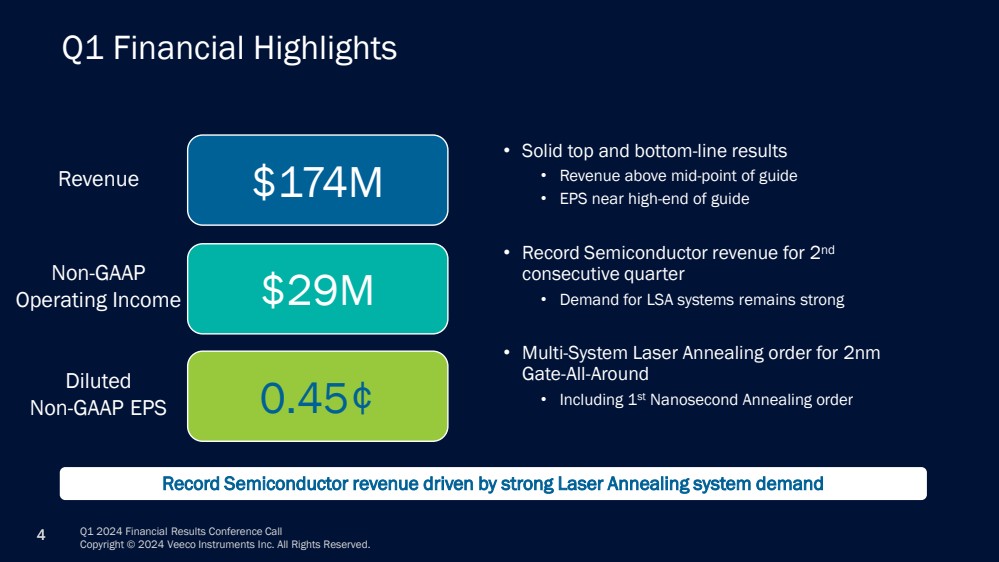
| Q1 2024 Financial Results Conference Call Copyright © 2024 Veeco Instruments Inc. All Rights Reserved. 4 Q1 Financial Highlights $174M $29M 0.45¢ Revenue Non-GAAP Operating Income Diluted Non-GAAP EPS • Solid top and bottom-line results • Revenue above mid-point of guide • EPS near high-end of guide • Record Semiconductor revenue for 2nd consecutive quarter • Demand for LSA systems remains strong • Multi-System Laser Annealing order for 2nm Gate-All-Around • Including 1st Nanosecond Annealing order Record Semiconductor revenue driven by strong Laser Annealing system demand |
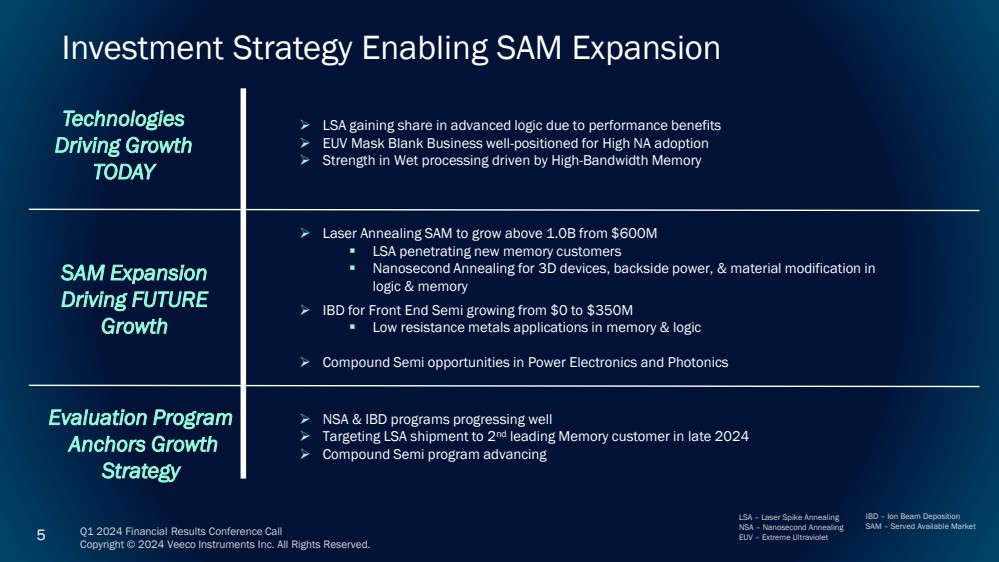
| Q1 2024 Financial Results Conference Call Copyright © 2024 Veeco Instruments Inc. All Rights Reserved. 5 ➢ NSA & IBD programs progressing well ➢ Targeting LSA shipment to 2nd leading Memory customer in late 2024 ➢ Compound Semi program advancing LSA – Laser Spike Annealing NSA – Nanosecond Annealing EUV – Extreme Ultraviolet IBD – Ion Beam Deposition SAM – Served Available Market Investment Strategy Enabling SAM Expansion Future Technologies Driving Growth TODAY Evaluation Program Anchors Growth Strategy SAM Expansion Driving FUTURE Growth ➢ LSA gaining share in advanced logic due to performance benefits ➢ EUV Mask Blank Business well-positioned for High NA adoption ➢ Strength in Wet processing driven by High-Bandwidth Memory ➢ Laser Annealing SAM to grow above 1.0B from $600M ▪ LSA penetrating new memory customers ▪ Nanosecond Annealing for 3D devices, backside power, & material modification in logic & memory ➢ IBD for Front End Semi growing from $0 to $350M ▪ Low resistance metals applications in memory & logic ➢ Compound Semi opportunities in Power Electronics and Photonics |
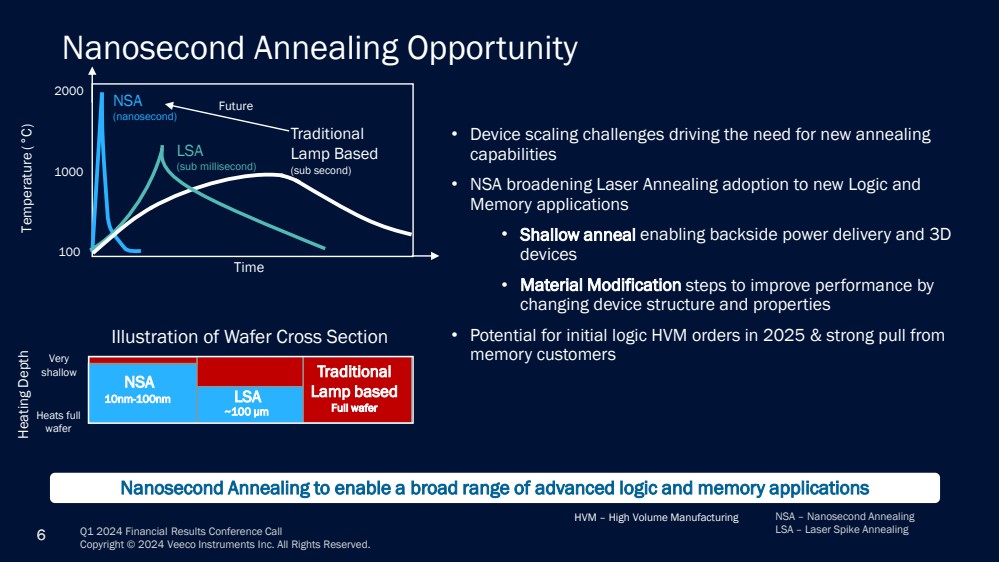
| Q1 2024 Financial Results Conference Call Copyright © 2024 Veeco Instruments Inc. All Rights Reserved. 6 Nanosecond Annealing Opportunity Nanosecond Annealing to enable a broad range of advanced logic and memory applications • Device scaling challenges driving the need for new annealing capabilities • NSA broadening Laser Annealing adoption to new Logic and Memory applications • Shallow anneal enabling backside power delivery and 3D devices • Material Modification steps to improve performance by changing device structure and properties • Potential for initial logic HVM orders in 2025 & strong pull from memory customers Temperature (°C) Time HVM – High Volume Manufacturing NSA (nanosecond) 1000 2000 LSA (sub millisecond) 100 NSA LSA Heating Depth 10nm-100nm ~100 μm Very shallow Heats full wafer Traditional Lamp Based (sub second) Traditional Lamp based Full wafer Illustration of Wafer Cross Section Future NSA – Nanosecond Annealing LSA – Laser Spike Annealing |
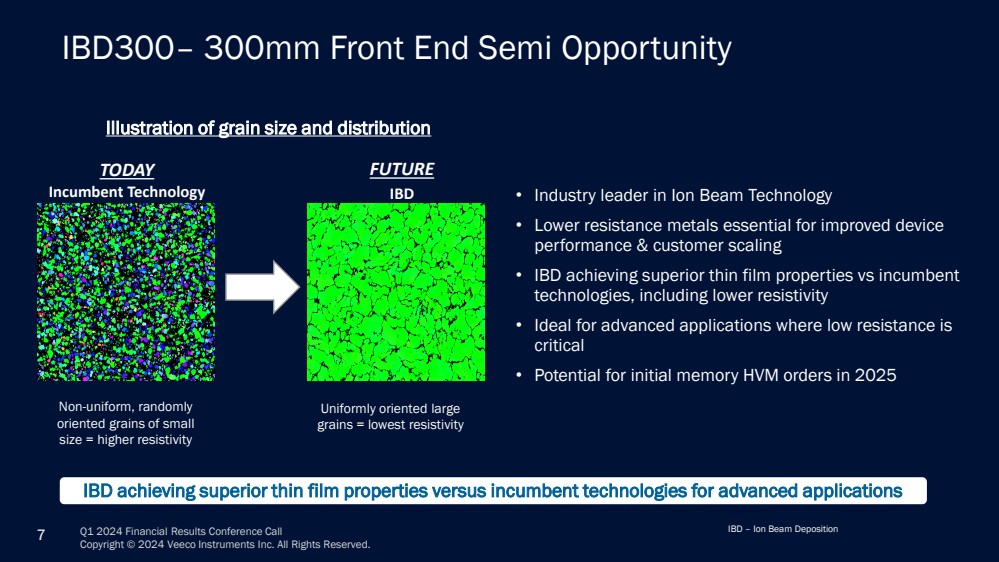
| Q1 2024 Financial Results Conference Call Copyright © 2024 Veeco Instruments Inc. All Rights Reserved. 7 IBD300– 300mm Front End Semi Opportunity IBD achieving superior thin film properties versus incumbent technologies for advanced applications • Industry leader in Ion Beam Technology • Lower resistance metals essential for improved device performance & customer scaling • IBD achieving superior thin film properties vs incumbent technologies, including lower resistivity • Ideal for advanced applications where low resistance is critical • Potential for initial memory HVM orders in 2025 FUTURE IBD TODAY Incumbent Technology Illustration of grain size and distribution Uniformly oriented large grains = lowest resistivity Non-uniform, randomly oriented grains of small size = higher resistivity IBD – Ion Beam Deposition |
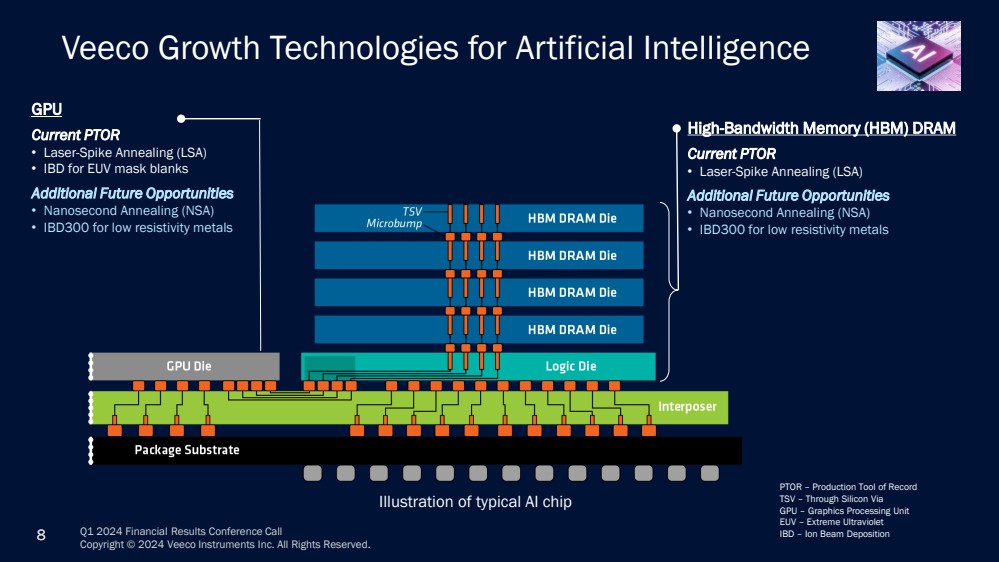
| Q1 2024 Financial Results Conference Call Copyright © 2024 Veeco Instruments Inc. All Rights Reserved. 8 Veeco Growth Technologies for Artificial Intelligence GPU Current PTOR • Laser-Spike Annealing (LSA) • IBD for EUV mask blanks Additional Future Opportunities • Nanosecond Annealing (NSA) • IBD300 for low resistivity metals High-Bandwidth Memory (HBM) DRAM Current PTOR • Laser-Spike Annealing (LSA) Additional Future Opportunities • Nanosecond Annealing (NSA) • IBD300 for low resistivity metals Illustration of typical AI chip PTOR – Production Tool of Record TSV – Through Silicon Via GPU – Graphics Processing Unit EUV – Extreme Ultraviolet IBD – Ion Beam Deposition |
| Q1 2024 Financial Results Conference Call Copyright © 2024 Veeco Instruments Inc. All Rights Reserved. 9 John Kiernan CFO Financial Review |
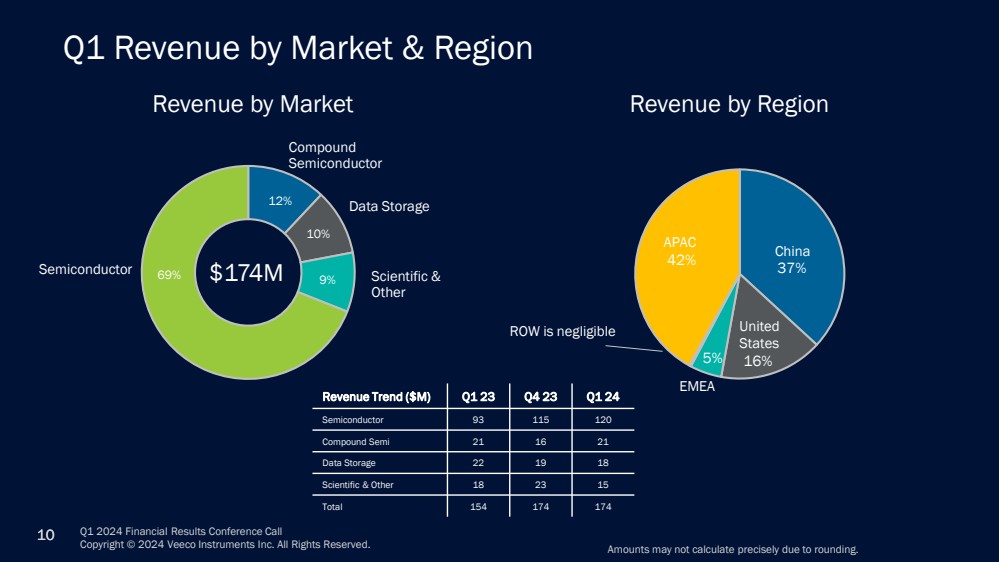
| Q1 2024 Financial Results Conference Call Copyright © 2024 Veeco Instruments Inc. All Rights Reserved. 10 Q1 Revenue by Market & Region 69% 10% 9% 12% Revenue by Market Revenue by Region Scientific & Other Semiconductor Compound Semiconductor Data Storage 37% 5% 16% 42% EMEA APAC China United States $174M Revenue Trend ($M) Q1 23 Q4 23 Q1 24 Semiconductor 93 115 120 Compound Semi 21 16 21 Data Storage 22 19 18 Scientific & Other 18 23 15 Total 154 174 174 Amounts may not calculate precisely due to rounding. ROW is negligible |
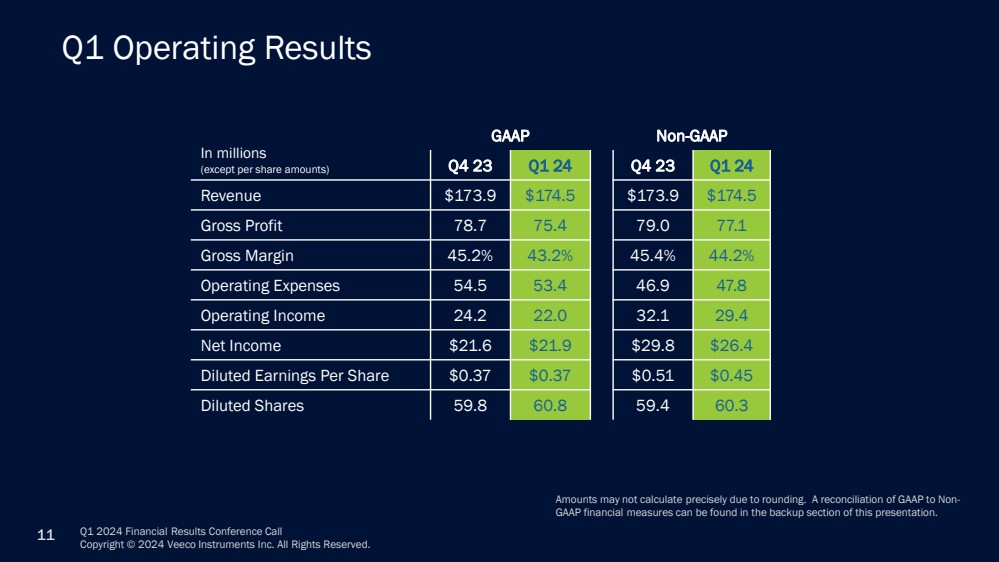
| Q1 2024 Financial Results Conference Call Copyright © 2024 Veeco Instruments Inc. All Rights Reserved. 11 Q1 Operating Results In millions (except per share amounts) GAAP Non-GAAP Q4 23 Q1 24 Q4 23 Q1 24 Revenue $173.9 $174.5 $173.9 $174.5 Gross Profit 78.7 75.4 79.0 77.1 Gross Margin 45.2% 43.2% 45.4% 44.2% Operating Expenses 54.5 53.4 46.9 47.8 Operating Income 24.2 22.0 32.1 29.4 Net Income $21.6 $21.9 $29.8 $26.4 Diluted Earnings Per Share $0.37 $0.37 $0.51 $0.45 Diluted Shares 59.8 60.8 59.4 60.3 Amounts may not calculate precisely due to rounding. A reconciliation of GAAP to Non-GAAP financial measures can be found in the backup section of this presentation. |
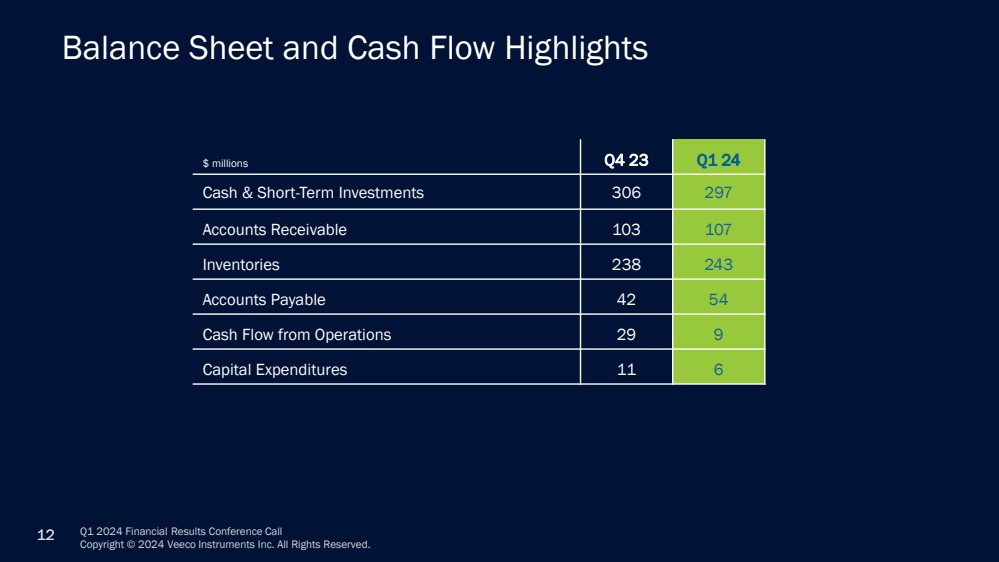
| Q1 2024 Financial Results Conference Call Copyright © 2024 Veeco Instruments Inc. All Rights Reserved. 12 Balance Sheet and Cash Flow Highlights $ millions Q4 23 Q1 24 Cash & Short-Term Investments 306 297 Accounts Receivable 103 107 Inventories 238 243 Accounts Payable 42 54 Cash Flow from Operations 29 9 Capital Expenditures 11 6 |
| Q1 2024 Financial Results Conference Call Copyright © 2024 Veeco Instruments Inc. All Rights Reserved. 13 2024 Guidance A reconciliation of GAAP to Non-GAAP financial measures can be found in the backup section of this presentation. GAAP Non-GAAP Revenue $165M - $185M $165M - $185M Gross Margin 42% - 43% 43% - 44% Operating Expenses $55M - $57M $46M - $48M Net Income / (Loss) $13M - $20M $22M - $29M Diluted Earnings / (Loss) Per Share $0.22 - $0.33 $0.38 - $0.48 Non-GAAP Revenue $680M - $740M Non-GAAP Diluted EPS $1.60 - $1.90 Q2 2024 FY 2024 |
| Q1 2024 Financial Results Conference Call Copyright © 2024 Veeco Instruments Inc. All Rights Reserved. 14 Closing Remarks |
| Q1 2024 Financial Results Conference Call Copyright © 2024 Veeco Instruments Inc. All Rights Reserved. 15 Backup and Financial Tables |
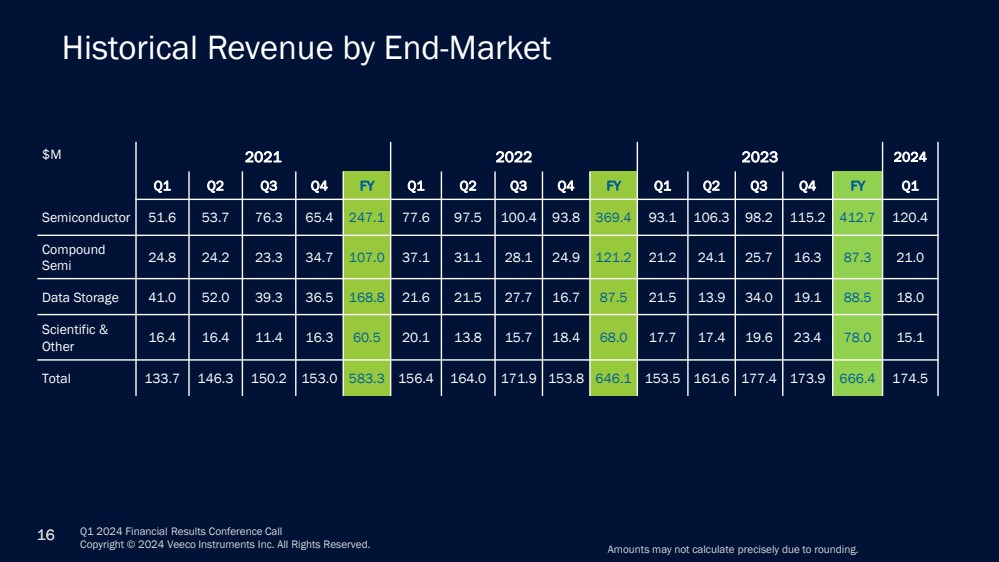
| Q1 2024 Financial Results Conference Call Copyright © 2024 Veeco Instruments Inc. All Rights Reserved. 16 Historical Revenue by End-Market $M 2021 2022 2023 2024 Q1 Q2 Q3 Q4 FY Q1 Q2 Q3 Q4 FY Q1 Q2 Q3 Q4 FY Q1 Semiconductor 51.6 53.7 76.3 65.4 247.1 77.6 97.5 100.4 93.8 369.4 93.1 106.3 98.2 115.2 412.7 120.4 Compound Semi 24.8 24.2 23.3 34.7 107.0 37.1 31.1 28.1 24.9 121.2 21.2 24.1 25.7 16.3 87.3 21.0 Data Storage 41.0 52.0 39.3 36.5 168.8 21.6 21.5 27.7 16.7 87.5 21.5 13.9 34.0 19.1 88.5 18.0 Scientific & Other 16.4 16.4 11.4 16.3 60.5 20.1 13.8 15.7 18.4 68.0 17.7 17.4 19.6 23.4 78.0 15.1 Total 133.7 146.3 150.2 153.0 583.3 156.4 164.0 171.9 153.8 646.1 153.5 161.6 177.4 173.9 666.4 174.5 Amounts may not calculate precisely due to rounding. |
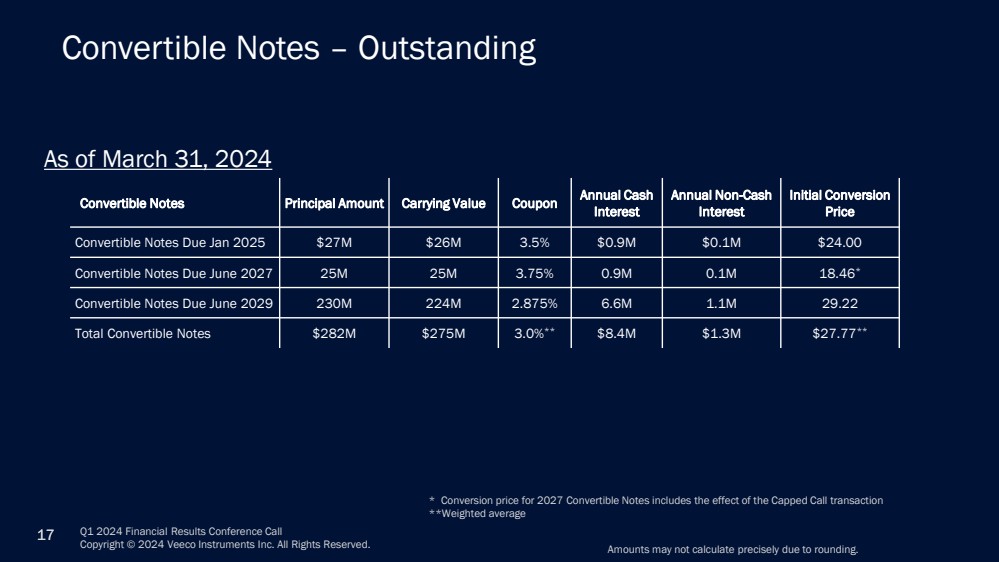
| Q1 2024 Financial Results Conference Call Copyright © 2024 Veeco Instruments Inc. All Rights Reserved. 17 Convertible Notes – Outstanding * Conversion price for 2027 Convertible Notes includes the effect of the Capped Call transaction **Weighted average Convertible Notes Principal Amount Carrying Value Coupon Annual Cash Interest Annual Non-Cash Interest Initial Conversion Price Convertible Notes Due Jan 2025 $27M $26M 3.5% $0.9M $0.1M $24.00 Convertible Notes Due June 2027 25M 25M 3.75% 0.9M 0.1M 18.46* Convertible Notes Due June 2029 230M 224M 2.875% 6.6M 1.1M 29.22 Total Convertible Notes $282M $275M 3.0%** $8.4M $1.3M $27.77** As of March 31, 2024 Amounts may not calculate precisely due to rounding. |
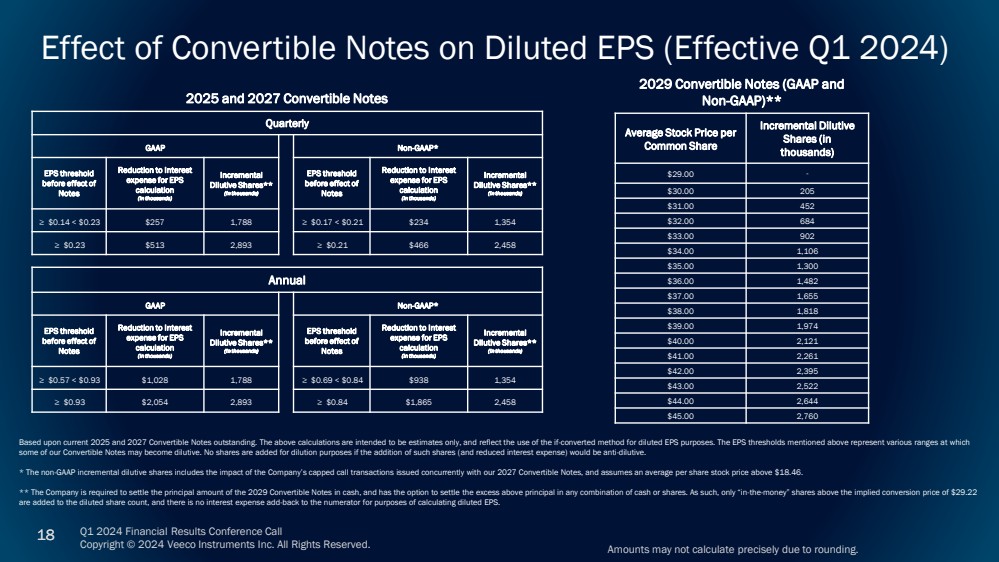
| Q1 2024 Financial Results Conference Call Copyright © 2024 Veeco Instruments Inc. All Rights Reserved. 18 Effect of Convertible Notes on Diluted EPS (Effective Q1 2024) Based upon current 2025 and 2027 Convertible Notes outstanding. The above calculations are intended to be estimates only, and reflect the use of the if-converted method for diluted EPS purposes. The EPS thresholds mentioned above represent various ranges at which some of our Convertible Notes may become dilutive. No shares are added for dilution purposes if the addition of such shares (and reduced interest expense) would be anti-dilutive. * The non-GAAP incremental dilutive shares includes the impact of the Company’s capped call transactions issued concurrently with our 2027 Convertible Notes, and assumes an average per share stock price above $18.46. ** The Company is required to settle the principal amount of the 2029 Convertible Notes in cash, and has the option to settle the excess above principal in any combination of cash or shares. As such, only “in-the-money” shares above the implied conversion price of $29.22 are added to the diluted share count, and there is no interest expense add-back to the numerator for purposes of calculating diluted EPS. 2025 and 2027 Convertible Notes Quarterly GAAP Non-GAAP* EPS threshold before effect of Notes Reduction to Interest expense for EPS calculation (in thousands) Incremental Dilutive Shares** (in thousands) EPS threshold before effect of Notes Reduction to Interest expense for EPS calculation (in thousands) Incremental Dilutive Shares** (in thousands) ≥ $0.14 < $0.23 $257 1,788 ≥ $0.17 < $0.21 $234 1,354 ≥ $0.23 $513 2,893 ≥ $0.21 $466 2,458 Annual GAAP Non-GAAP* EPS threshold before effect of Notes Reduction to Interest expense for EPS calculation (in thousands) Incremental Dilutive Shares** (in thousands) EPS threshold before effect of Notes Reduction to Interest expense for EPS calculation (in thousands) Incremental Dilutive Shares** (in thousands) ≥ $0.57 < $0.93 $1,028 1,788 ≥ $0.69 < $0.84 $938 1,354 ≥ $0.93 $2,054 2,893 ≥ $0.84 $1,865 2,458 2029 Convertible Notes (GAAP and Non-GAAP)** Average Stock Price per Common Share Incremental Dilutive Shares (in thousands) $29.00 - $30.00 205 $31.00 452 $32.00 684 $33.00 902 $34.00 1,106 $35.00 1,300 $36.00 1,482 $37.00 1,655 $38.00 1,818 $39.00 1,974 $40.00 2,121 $41.00 2,261 $42.00 2,395 $43.00 2,522 $44.00 2,644 $45.00 2,760 Amounts may not calculate precisely due to rounding. |
| Q1 2024 Financial Results Conference Call Copyright © 2024 Veeco Instruments Inc. All Rights Reserved. 19 Note on Reconciliation Tables These tables include financial measures adjusted for the impact of certain items; these financial measures are therefore not calculated in accordance with U.S. generally accepted accounting principles (“GAAP”). These Non-GAAP financial measures exclude items such as: share-based compensation expense; charges relating to restructuring initiatives; non-cash asset impairments; certain other non-operating gains and losses; and acquisition-related items such as transaction costs, non-cash amortization of acquired intangible assets, incremental transaction-related compensation, and certain integration costs. These Non-GAAP financial measures may be different from Non-GAAP financial measures used by other companies. Non-GAAP financial measures should not be considered a substitute for, or superior to, measures of financial performance prepared in accordance with GAAP. By excluding these items, Non-GAAP financial measures are intended to facilitate meaningful comparisons to historical operating results, competitors' operating results, and estimates made by securities analysts. Management is evaluated on key performance metrics including Non-GAAP Operating Income, which is used to determine management incentive compensation as well as to forecast future periods. These Non-GAAP financial measures may be useful to investors in allowing for greater transparency of supplemental information used by management in its financial and operational decision-making. In addition, similar Non-GAAP financial measures have historically been reported to investors; the inclusion of comparable numbers provides consistency in financial reporting. Investors are encouraged to review the reconciliation of the Non-GAAP financial measures used in this news release to their most directly comparable GAAP financial measures. |
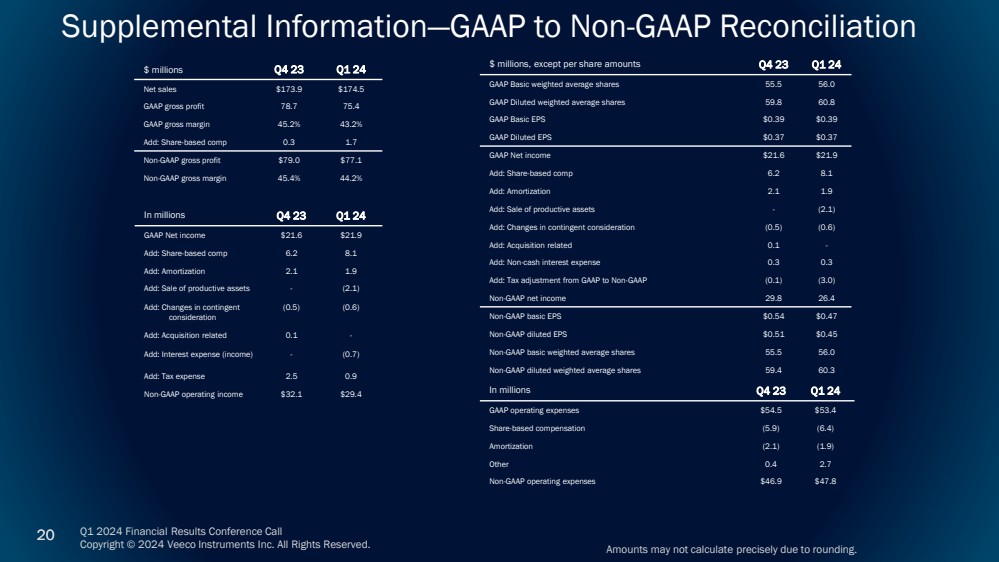
| Q1 2024 Financial Results Conference Call Copyright © 2024 Veeco Instruments Inc. All Rights Reserved. 20 Supplemental Information—GAAP to Non-GAAP Reconciliation Amounts may not calculate precisely due to rounding. $ millions Q4 23 Q1 24 Net sales $173.9 $174.5 GAAP gross profit 78.7 75.4 GAAP gross margin 45.2% 43.2% Add: Share-based comp 0.3 1.7 Non-GAAP gross profit $79.0 $77.1 Non-GAAP gross margin 45.4% 44.2% In millions Q4 23 Q1 24 GAAP Net income $21.6 $21.9 Add: Share-based comp 6.2 8.1 Add: Amortization 2.1 1.9 Add: Sale of productive assets - (2.1) Add: Changes in contingent consideration (0.5) (0.6) Add: Acquisition related 0.1 - Add: Interest expense (income) - (0.7) Add: Tax expense 2.5 0.9 Non-GAAP operating income $32.1 $29.4 $ millions, except per share amounts Q4 23 Q1 24 GAAP Basic weighted average shares 55.5 56.0 GAAP Diluted weighted average shares 59.8 60.8 GAAP Basic EPS $0.39 $0.39 GAAP Diluted EPS $0.37 $0.37 GAAP Net income $21.6 $21.9 Add: Share-based comp 6.2 8.1 Add: Amortization 2.1 1.9 Add: Sale of productive assets - (2.1) Add: Changes in contingent consideration (0.5) (0.6) Add: Acquisition related 0.1 - Add: Non-cash interest expense 0.3 0.3 Add: Tax adjustment from GAAP to Non-GAAP (0.1) (3.0) Non-GAAP net income 29.8 26.4 Non-GAAP basic EPS $0.54 $0.47 Non-GAAP diluted EPS $0.51 $0.45 Non-GAAP basic weighted average shares 55.5 56.0 Non-GAAP diluted weighted average shares 59.4 60.3 In millions Q4 23 Q1 24 GAAP operating expenses $54.5 $53.4 Share-based compensation (5.9) (6.4) Amortization (2.1) (1.9) Other 0.4 2.7 Non-GAAP operating expenses $46.9 $47.8 |
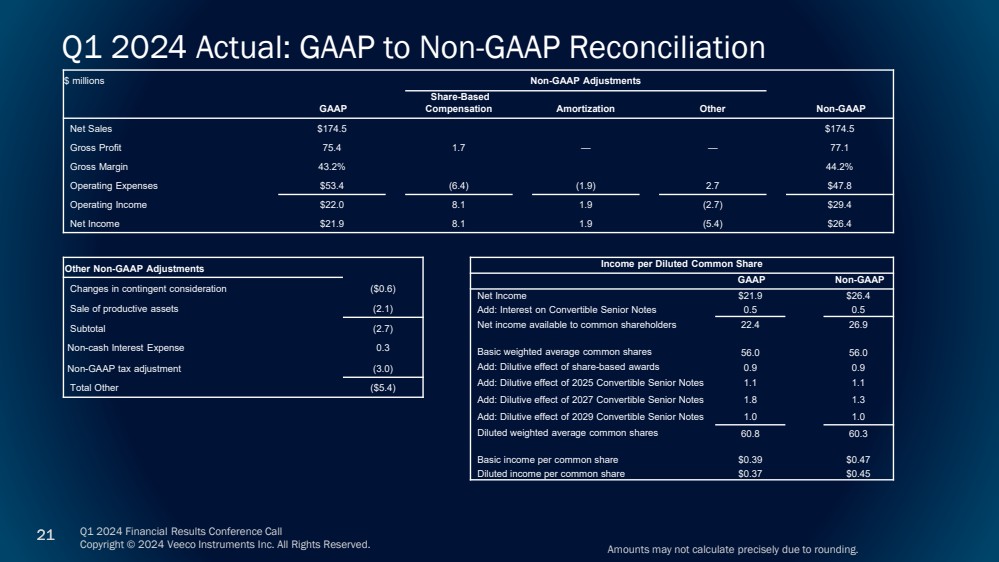
| Q1 2024 Financial Results Conference Call Copyright © 2024 Veeco Instruments Inc. All Rights Reserved. 21 $ millions Non-GAAP Adjustments GAAP Share-Based Compensation Amortization Other Non-GAAP Net Sales $174.5 $174.5 Gross Profit 75.4 1.7 — — 77.1 Gross Margin 43.2% 44.2% Operating Expenses $53.4 (6.4) (1.9) 2.7 $47.8 Operating Income $22.0 8.1 1.9 (2.7) $29.4 Net Income $21.9 8.1 1.9 (5.4) $26.4 Q1 2024 Actual: GAAP to Non-GAAP Reconciliation Amounts may not calculate precisely due to rounding. Income per Diluted Common Share GAAP Non-GAAP Net Income $21.9 $26.4 Add: Interest on Convertible Senior Notes 0.5 0.5 Net income available to common shareholders 22.4 26.9 Basic weighted average common shares 56.0 56.0 Add: Dilutive effect of share-based awards 0.9 0.9 Add: Dilutive effect of 2025 Convertible Senior Notes 1.1 1.1 Add: Dilutive effect of 2027 Convertible Senior Notes 1.8 1.3 Add: Dilutive effect of 2029 Convertible Senior Notes 1.0 1.0 Diluted weighted average common shares 60.8 60.3 Basic income per common share $0.39 $0.47 Diluted income per common share $0.37 $0.45 Other Non-GAAP Adjustments Changes in contingent consideration ($0.6) Sale of productive assets (2.1) Subtotal (2.7) Non-cash Interest Expense 0.3 Non-GAAP tax adjustment (3.0) Total Other ($5.4) |
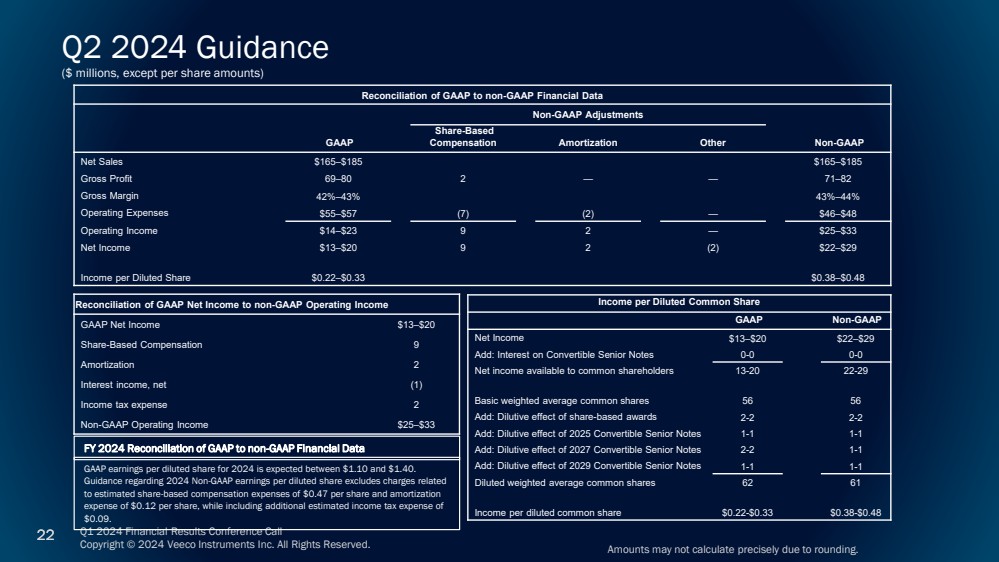
| Q1 2024 Financial Results Conference Call Copyright © 2024 Veeco Instruments Inc. All Rights Reserved. 22 Reconciliation of GAAP to non-GAAP Financial Data Non-GAAP Adjustments GAAP Share-Based Compensation Amortization Other Non-GAAP Net Sales $165–$185 $165–$185 Gross Profit 69–80 2 — — 71–82 Gross Margin 42%–43% 43%–44% Operating Expenses $55–$57 (7) (2) — $46–$48 Operating Income $14–$23 9 2 — $25–$33 Net Income $13–$20 9 2 (2) $22–$29 Income per Diluted Share $0.22–$0.33 $0.38–$0.48 Q2 2024 Guidance ($ millions, except per share amounts) Amounts may not calculate precisely due to rounding. Income per Diluted Common Share GAAP Non-GAAP Net Income $13–$20 $22–$29 Add: Interest on Convertible Senior Notes 0-0 0-0 Net income available to common shareholders 13-20 22-29 Basic weighted average common shares 56 56 Add: Dilutive effect of share-based awards 2-2 2-2 Add: Dilutive effect of 2025 Convertible Senior Notes 1-1 1-1 Add: Dilutive effect of 2027 Convertible Senior Notes 2-2 1-1 Add: Dilutive effect of 2029 Convertible Senior Notes 1-1 1-1 Diluted weighted average common shares 62 61 Income per diluted common share $0.22-$0.33 $0.38-$0.48 Reconciliation of GAAP Net Income to non-GAAP Operating Income GAAP Net Income $13–$20 Share-Based Compensation 9 Amortization 2 Interest income, net (1) Income tax expense 2 Non-GAAP Operating Income $25–$33 GAAP earnings per diluted share for 2024 is expected between $1.10 and $1.40. Guidance regarding 2024 Non-GAAP earnings per diluted share excludes charges related to estimated share-based compensation expenses of $0.47 per share and amortization expense of $0.12 per share, while including additional estimated income tax expense of $0.09. FY 2024 Reconciliation of GAAP to non-GAAP Financial Data |
Document and Entity Information |
May 07, 2024 |
|---|---|
| Cover [Abstract] | |
| Document Type | 8-K |
| Document Period End Date | May 07, 2024 |
| Entity Registrant Name | VEECO INSTRUMENTS INC. |
| Entity Incorporation, State or Country Code | DE |
| Entity File Number | 0-16244 |
| Entity Tax Identification Number | 11-2989601 |
| Entity Address, Address Line One | Terminal Drive |
| Entity Address, City or Town | Plainview |
| Entity Address, State or Province | NY |
| Entity Address, Postal Zip Code | 11803 |
| City Area Code | 516 |
| Local Phone Number | 677-0200 |
| Written Communications | false |
| Soliciting Material | false |
| Pre-commencement Tender Offer | false |
| Pre-commencement Issuer Tender Offer | false |
| Title of 12(b) Security | Common Stock, par value $0.01 per share |
| Trading Symbol | VECO |
| Security Exchange Name | NASDAQ |
| Entity Emerging Growth Company | false |
| Entity Central Index Key | 0000103145 |
| Amendment Flag | false |
1 Year Veeco Instruments Inc DE Chart |
1 Month Veeco Instruments Inc DE Chart |

It looks like you are not logged in. Click the button below to log in and keep track of your recent history.
Support: +44 (0) 203 8794 460 | support@advfn.com
By accessing the services available at ADVFN you are agreeing to be bound by ADVFN's Terms & Conditions
 Hot Features