ADVFN Logo ADVFN

We could not find any results for:
Make sure your spelling is correct or try broadening your search.

Trending Now

Toplists

It looks like you aren't logged in.
Click the button below to log in and view your recent history.

Hot Features

Registration Strip Icon for default Register for Free to get streaming real-time quotes, interactive charts, live options flow, and more.

SONO Sonos Inc

14.635
0.635 (4.54%)
Last Updated: 19:40:47
Delayed by 15 minutes
Share Name Share Symbol Market Type
Sonos Inc NASDAQ:SONO NASDAQ Common Stock
  Price Change % Change Share Price Bid Price Offer Price High Price Low Price Open Price Shares Traded Last Trade
  0.635 4.54% 14.635 14.63 14.64 14.635 14.20 14.20 833,474 19:40:47

SonoSite Reports First Quarter Results; MicroMaxx(TM) System Sales Rise to 46% of Worldwide Revenue; US Direct Sales Force Show

26/04/2006 9:31pm

Business Wire


Sonos (NASDAQ:SONO)
Historical Stock Chart


From Jul 2019 to Jul 2024
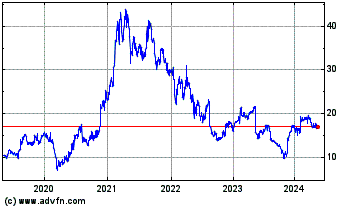
Click Here for more Sonos Charts.
SonoSite, Inc. (Nasdaq:SONO), the world leader in hand-carried ultrasound, today reported financial results for the first quarter ended March 31, 2006. Worldwide revenue in the first quarter of 2006 grew 9% to $36.9 million compared with $34.0 million in the first quarter of 2005. The first quarter of 2005 included over $3 million of enterprise project revenue from US and international government entities and impacts the comparison with 2006. Changes in the foreign currency rates decreased the revenue growth rate by approximately 3% in the first quarter. Overall, US revenue grew 15% in the first quarter over the prior year with sales growing 45% from direct sales. As expected, the company's US enterprise sales which are primarily comprised of sales to governmental entities declined 57% in the first quarter of 2006 due to the high volume of project orders in the comparable quarter of the prior year. International revenue grew 3% over the prior year. The prior year's first quarter also included a large government order. Changes in foreign currency rates reduced the international growth rate by 5%. US revenue accounted for 49% of total revenue in the first quarter of 2006. The company's 2006 financial results reflect adoption of FAS 123R, "Share-Based Payment", on January 1, 2006. For the first quarter of 2006, SonoSite reported a net loss of $363,000, or $0.02 per share, compared with net income of $725,000, or $0.05 per diluted share, in the prior year. First quarter results in 2006 included $1.3 million of stock-based compensation, or $846,000 and $0.05 per share on an after-tax basis. Of this amount, the adoption of FAS 123R had an after-tax impact of $661,000, or $0.04 per share, and compensation from restricted stock grants had an after-tax impact of $185,000, or $0.01 per share. On a comparative after-tax basis, the first quarter of 2005 included $12,000 of stock-based compensation for restricted stock grants. "We are highly encouraged by the performance and momentum in our US direct sales organization which turned in a 45% sales increase over last year's first quarter, reflecting the continuing success of the MicroMaxx system and improved execution," said Kevin M. Goodwin, SonoSite President and CEO. "As expected, enterprise sales were down in the quarter given the tough comparison of a year ago. This business is historically hard to predict and very variable." Mr. Goodwin continued, "Internationally, we saw excellent growth in a number of our markets, although, overall performance was impacted by currency translation and results in Japan, which we expect will show improvement later this year. The year-over-year comparison was also difficult due to a large government order in our international business as well. We are seeing good evidence that Germany is on a positive track with the addition of experienced sales talent and the recently announced alliance with Siemens. The MicroMaxx system continues to enjoy strong worldwide acceptance and rose to account for 46% of the quarter's worldwide revenue." Operating expenses grew 22% to $27.1 million in the first quarter of 2006 compared with the same period in 2005. Excluding stock-based compensation expense, operating expenses grew 16% in the quarter over the prior year to $25.8 million. The increase in operating expenses primarily resulted from investment in the company's international sales and marketing infrastructure and expansion of the US enterprise business unit and sales education initiatives. Cash, cash equivalents and investments increased by $9.4 million to $80.2 million as of March 31, 2006. Company Outlook for Second Quarter and 2006 Management continues to target a revenue growth rate of approximately 25% and expects full year revenue to be in a range of $180-187 million. Quarterly revenue is expected to vary following historical seasonal patterns. The company expects second quarter revenue to grow approximately 25% over the prior year's second quarter. Quarterly revenue is expected to grow sequentially in the remainder of the year with approximately one-third of the year's revenue occurring in the seasonally strong fourth quarter. Factors such as timing of large project orders from governmental or international entities cause variability in quarterly growth rate comparisons. The company expects annual and quarterly gross margin to approximate 71%. Excluding stock-based compensation expense, operating expenses for the year are expected to approximate 59% to 60% of revenue and to vary following historical patterns. As of January 1, 2006, the company adopted FAS 123R, "Share-Based Payment", and estimates that stock-based compensation expense, including options, restricted stock grants and the employee stock purchase plan, will be approximately $9.0 million on a pre-tax basis in 2006, with an expense of approximately $2.5 million quarterly for the remainder of the year. Other income is expected to be approximately $2.4 for the year. The company expects its overall effective tax rate for 2006 to be approximately 33% to 35%. For the year, the weighted average fully diluted common shares outstanding is expected to be approximately 17 million shares. Executive Appointments in Marketing, Sales and Education Announced SonoSite also announced that Edison (Ed) C. Russell, Senior Vice President, US Sales has decided to retire, effective June 30, 2006. Thomas J. Dugan, currently Senior Vice President, Marketing is being promoted to Senior Vice President, Global Marketing and US Sales and will assume Mr. Russell's responsibilities for the US sales organization. The company also announced the promotion of David R. Levesque, currently Director, Training and Education to Vice President, Worldwide Global Learning, responsible for sales and clinical training and customer education. "Under Ed's leadership, the execution and performance of our US sales team has steadily improved," Mr. Goodwin said. "We appreciate his many contributions and wish him the best. Tom's record of accomplishment and extensive experience in all areas of sales and marketing in the medical device industry will serve our company well as he undertakes his new responsibilities. We believe that by consolidating our sales and marketing organization, our focus and effectiveness will further improve in our target markets." "In a relatively short period of time, Dave Levesque has played a key role in improving the quality of sales training in this company leading to greatly improved productivity and results," Mr. Goodwin said. "His promotion underscores the strategic importance we are placing on expanding customer education." Non-GAAP Measures: This release includes measures that are not in accordance with generally accepted accounting principles (non-GAAP). In the first quarter of 2006, the company adopted Financial Accounting Standards Board Statement No. 123R (SFAS 123R), which requires companies to recognize the compensation cost associated with stock-based awards in their financial statements. As a result, our financial statements for the first quarter of 2006 include stock-based compensation expense from options and employee stock purchase plan, but our financial results for the first quarter of 2005 do not include such stock-based compensation expense because periods prior to January 1, 2006 are not required to be restated. In addition to the stock-based compensation from options and employee stock purchase plan, we have stock-based compensation from grants of restricted stock units in the first quarter of 2006 and 2005. We have provided non-GAAP financial information that includes all stock-based compensation expense. We believe that it is useful to investors to understand how the expenses associated with stock-based compensation are reflected on our statements of operations. For our internal budgets, management uses financial statements that do not include stock-based compensation expense related to our stock-based awards. Management also uses the non-GAAP measures, in addition to the corresponding GAAP measures, in reviewing the financial results. The non-GAAP information should not be considered in isolation or as a substitute for measures of performance prepared in accordance with GAAP. Conference Call Information SonoSite will hold a conference call today at 1:30 p.m. PT/4:30 p.m. ET. The call will be broadcast live and can be accessed via the "Investors" Section of SonoSite's website at www.sonosite.com. A replay of the audio webcast will be available beginning April 26, 2006, at 4:30 p.m. (PT) until May 10, 2006, at 12:00 midnight (PT) by dialing 719-457-0820 or toll-free 888-203-1112. The confirmation code -- 1243705 -- is required to access the replay. The call will also be archived on SonoSite's website at http://ir.sonosite.com. About SonoSite SonoSite, Inc. (www.sonosite.com) is the innovator and world leader in hand-carried ultrasound, with an installed base of more than 25,000 systems. The company, headquartered near Seattle, Washington, is represented by eight subsidiaries and a global distribution network in over 75 countries. SonoSite's small, lightweight systems are expanding the use of ultrasound across the clinical spectrum by cost-effectively bringing high performance ultrasound to the point of patient care. The company employs approximately 500 people worldwide. Forward-looking Information and the Private Litigation Reform Act of 1995 Certain statements in this press release relating to the market acceptance of our products, possible future sales relating to expected orders, and our future financial position and operating results are "forward-looking statements" for the purposes of the safe harbor provisions of the Private Securities Litigation Reform Act of 1995. These forward-looking statements are based on the opinions and estimates of our management at the time the statements are made and are subject to risks and uncertainties that could cause actual results to differ materially from those expected or implied by the forward-looking statements. These statements are not guaranties of future performance and are subject to known and unknown risks and uncertainties and are based on potentially inaccurate assumptions. Factors that could affect the rate and extent of market acceptance of our products, the receipt of expected orders, and our financial performance include our ability to successfully manufacture, market and sell our ultrasound systems, our ability to accurately forecast customer demand for our products, our ability to manufacture and ship our systems in a timely manner to meet customer demand, timely receipts of regulatory approvals to market and sell our products, the outcome of the federal appeal of a patent ruling in our favor in a patent infringement case and expenses associated with such appeal, regulatory and reimbursement changes in various national health care markets, constraints in government and public health spending, the ability of our distribution partners to market and sell our products, as well as other factors described under the heading, "Important Factors that May Affect Our Business, Our Results of Operations and Our Stock Price," included in our latest periodic report filed with the Securities and Exchange Commission. We caution readers not to place undue reliance upon these forward-looking statements that speak only as to the date of this release. We undertake no obligation to publicly revise any forward-looking statements to reflect new information, events or circumstances after the date of this release or to reflect the occurrence of unanticipated events. -0- *T SonoSite, Inc. Selected Financial Information Consolidated Statements of Operations (in thousands except per share data) (unaudited) Three Months Ended March 31, 2006 2005 ---------- ---------- Revenue $ 36,869 $ 33,965 Cost of revenue 10,991 10,120 ---------- ---------- Gross margin 25,878 23,845 Gross margin percentage 70.2% 70.2% Operating expenses: Research and development 3,956 3,782 Sales and marketing 19,283 15,702 General and administrative 3,846 2,748 ---------- ---------- Total operating expenses 27,085 22,232 Other income (loss), net 660 (224) ---------- ---------- Income (loss) before income taxes (547) 1,389 Income tax benefit (provision) 184 (664) ---------- ---------- Net income (loss) $ (363) 725 ========== ========== Net income (loss) per share: Basic $ (0.02) $ 0.05 ========== ========== Diluted $ (0.02) $ 0.05 ========== ========== Weighted average common and potential common shares used in computing net income (loss) per share: Basic 16,013 15,318 ========== ========== Diluted 16,013 15,961 ========== ========== Non-GAAP Measures: Stock-based compensation is as follows: Research and development $ 268 $ -- Sales and marketing 540 19 General and administrative 516 -- ---------- ---------- Total stock-based compensation $ 1,324 $ 19 Income tax effect (478) (7) ---------- ---------- Stock-based compensation, net of tax(a) $ 846 $ 12 ========== ========== Stock-based compensation, net of tax, per share, basic and diluted(a) $ 0.05 $ 0.00 ========== ========== (a) Stock-based compensation, net of tax, and stock-based compensation, net of tax, per share are non-GAAP measures. These non-GAAP measures allow for useful comparison with the 2005 quarterly results. Condensed Consolidated Balance Sheets (in thousands) (unaudited) March 31, Dec. 31, 2006 2005 --------- --------- Cash and cash equivalents $ 36,769 $ 26,809 Short-term investment securities 29,406 25,426 Accounts receivable, net 37,508 42,414 Inventories 21,498 20,735 Deferred income taxes 8,271 6,822 Prepaid expenses and other current assets 2,548 2,345 --------- --------- Total current assets 136,000 124,551 Property and equipment, net 6,979 7,388 Investment securities 14,014 18,569 Deferred income taxes 20,660 19,137 Goodwill 1,805 1,751 Other assets 3,248 3,152 --------- --------- Total assets $182,706 $174,548 ========= ========= Accounts payable $ 3,799 $ 4,148 Accrued expenses 11,341 12,974 Deferred revenue 2,979 2,937 --------- --------- Total current liabilities 18,119 20,059 Deferred rent 303 290 Deferred revenue 2,220 2,157 --------- --------- Total liabilities 20,642 22,506 Shareholders' equity: Common stock and additional paid-in capital 220,470 212,868 Deferred stock compensation -- (2,671) Accumulated deficit (59,371) (59,008) Accumulated other comprehensive income 965 853 --------- --------- Total shareholders' equity 162,064 152,042 --------- --------- Total liabilities and shareholders' equity $182,706 $174,548 ========= ========= *T

1 Year Sonos Chart

1 Year Sonos Chart

1 Month Sonos Chart

1 Month Sonos Chart

Your Recent History

Delayed Upgrade Clock