ADVFN Logo ADVFN

We could not find any results for:
Make sure your spelling is correct or try broadening your search.

Trending Now

Toplists

It looks like you aren't logged in.
Click the button below to log in and view your recent history.

Hot Features

Registration Strip Icon for discussion Register to chat with like-minded investors on our interactive forums.

IBI Infinity Regs

0.04
0.00 (0.00%)
Last Updated: 01:00:00
Delayed by 15 minutes
Share Name Share Symbol Market Type Share ISIN Share Description
Infinity Regs LSE:IBI London Ordinary Share BMG4770S1017 COM SHS USD0.0015 (REG S)
  Price Change % Change Share Price Bid Price Offer Price High Price Low Price Open Price Shares Traded Last Trade
  0.00 0.00% 0.04 0.00 01:00:00
Industry Sector Turnover Profit EPS - Basic PE Ratio Market Cap
0 0 N/A 0

Interline Brands, Inc. Announces Second Quarter 2009 Sales and Earnings Results

31/07/2009 11:20am

PR Newswire (US)


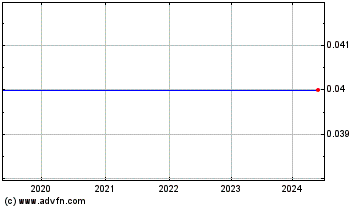
Infinity Bio-energy (LSE:IBI)
Historical Stock Chart


From May 2019 to May 2024
Click Here for more Infinity Bio-energy Charts.
JACKSONVILLE, Fla., July 31 /PRNewswire-FirstCall/ -- Interline Brands, Inc. (NYSE:IBI) ("Interline" or the "Company"), a leading distributor and direct marketer of maintenance, repair and operations ("MRO") products, reported sales and earnings for the quarter ended June 26, 2009. Sales for the second quarter of 2009 decreased 13.3% compared to the prior year period. Earnings per diluted share were $0.20 for the second quarter of 2009, a decrease of 41% compared to earnings per diluted share of $0.34 in the second quarter of 2008. Earnings per diluted share for the second quarter of 2009 included a $0.04 per diluted share charge associated with the previously announced consolidation of certain distribution centers and closing of certain underperforming professional contractor showrooms ("distribution network consolidations"). Michael J. Grebe, Interline's Chairman and Chief Executive Officer, commented, "I continue to be very encouraged by the results of our ongoing efforts to optimize our distribution network, improve the efficiency of our operations, and generate free cash flow. We remain highly focused on executing against our plans to remove $37 million in annual operating costs from the business and to drive additional working capital improvements. We have already begun to realize the benefits of these cost and efficiency actions - delivering $0.07 in net benefits to our bottom line in the second quarter - and we remain on track to deliver $0.31 in net benefits for 2009. In addition, we generated over $6 million in free cash flow, ahead of our previously stated expectations, and paid down an additional $20 million of debt during the quarter. We are very pleased to be making permanent improvements to our operations that will enhance our long-term competitive position, and I am confident that we will be well positioned when market conditions improve." Second Quarter 2009 Performance Sales for the quarter ended June 26, 2009 were $269.9 million, a 13.3% decrease compared to sales of $311.4 million in the comparable 2008 period. Average organic daily sales decreased 14.7% for the quarter. Interline's facilities maintenance end-market, which comprised 74% of sales, declined 7.8% during the second quarter on an average daily sales basis, and declined 9.9% on an average organic daily sales basis. The professional contractor end-market, which comprised 16% of sales, declined 28.4% in the quarter and the specialty distributor end-market, which comprised 10% of sales, declined 20.6% for the quarter. "Overall, the sales environment remained at levels consistent with what we experienced during the first quarter. Our revenues were impacted by continuing weakness in the housing sector and increasing softness in the apartment market. Despite these headwinds, certain maintenance, repair, and operations products, particularly our janitorial and sanitation offering, as well as our new institutional MRO offering, have held up relatively well. We continue to focus our sales channels on these products and end-markets. As residential and remodeling activity resumes to more normalized levels, we look forward to significant performance improvements across a number of our end-markets," said Mr. Grebe. Gross profit decreased $17.5 million, or 15.1%, to $98.3 million for the second quarter of 2009. As a percentage of sales, gross profit was 36.4% compared to 37.2% for the second quarter of 2008. SG&A expenses for the quarter were $78.9 million, down $9.7 million or 10.9% from the same period last year. SG&A expenses for the quarter represented 29.2% of sales compared to 28.4% in the second quarter of 2008. SG&A expenses included $2.1 million of expenses related to the planned distribution network consolidations. As a result, second quarter 2009 operating income of $15.0 million, or 5.6% of sales, decreased 35.0% compared to $23.1 million, or 7.4% of sales, in the second quarter of 2008. YTD 2009 Performance "The team has made great progress this year towards our goal of improving our distribution network and supply chain efficiency," commented Kenneth D. Sweder, Interline's Chief Operating Officer. "Since the start of 2009, we have closed 18 centers and remain focused on additional network improvements to drive higher profitability and enhance our long-term market position and competitiveness." Sales for the six months ended June 26, 2009 were $526.7 million, a 12.3% decrease over sales of $600.6 million in the comparable 2008 period. Gross profit decreased $30.9 million, or 13.7%, to $194.9 million for the six months ended June 26, 2008, compared to $225.9 million in the prior year period. As a percentage of sales, gross profit decreased to 37.0% from 37.6% in the comparable 2008 period. SG&A expenses for the six months ended June 26, 2009 were $162.8 million, or 30.9% of sales, compared to $173.6 million, or 28.9% of sales, for the six months ended June 27, 2008. SG&A expenses in 2009 included $4.5 million related to our previously announced reduction in force and planned distribution network consolidations; a $3.0 million charge for bad debt resulting from a customer seeking Chapter 11 bankruptcy protection; and a $0.7 million charge associated with the adoption of FAS 141R - a new accounting standard on business combinations. Operating income was $23.1 million, or 4.4% of sales, for the six months ended June 26, 2009 compared to $44.3 million, or 7.4% of sales, for the six months ended June 27, 2008, representing a decrease of 47.9%. Earnings per diluted share were $0.29 for the six months ended June 26, 2009, a decrease of 52% over earnings per diluted share of $0.61 for the six months ended June 27, 2008. Cash flow from operating activities for the six months ended June 26, 2009 was $72.3 million compared to $27.2 million for the six months ended June 27, 2008. During the six months ended June 26, 2009, the Company repaid $26.2 million of term debt and used $34.2 million to repurchase and retire $36.4 million principal amount of 8 1/8% senior subordinated notes, generating a $0.03 per diluted share gain on the early extinguishment of debt. Business Outlook Mr. Grebe stated, "We do not expect the third quarter sales environment to be significantly different than the first half of the year. However, based on our cash flow generation year-to-date, we now expect free cash flow for the year of at least $70 million. Additionally, we are pushing ahead to drive improvements in our Company from top to bottom. We are strategically aligning our sales efforts, streamlining our distribution network, executing against our cost and efficiency actions, more efficiently managing our working capital, reducing debt, and generating solid cash flow. These initiatives will ensure we continue to progress towards our long-term vision, and I am confident we are positioned well to deliver improving value to our shareholders over the long term." Conference Call Interline Brands will host a conference call on July 31, 2009 at 9:00 a.m. Eastern Daylight Time. Interested parties may listen to the call toll free by dialing 1-800-427-0638 or 1-706-634-1170. A digital recording will be available for replay two hours after the completion of the conference call by calling 1-800-642-1687 or 1-706-645-9291 and referencing Conference I.D. Number 20865099. This recording will expire on August 14, 2009. About Interline Interline Brands, Inc. is a leading national distributor and direct marketer with headquarters in Jacksonville, Florida. Interline provides maintenance, repair and operations products to a diversified customer base made up of professional contractors, facilities maintenance professionals, and specialty distributors primarily throughout the United States, Canada, the Caribbean and Central America. Non-GAAP Financial Information This press release contains financial information determined by methods other than in accordance with generally accepted accounting principles ("GAAP"). Interline's management uses non-GAAP measures in its analysis of the Company's performance. Investors are encouraged to review the reconciliation of non-GAAP financial measures to the comparable GAAP results available in the accompanying tables. Safe Harbor Statement under the Private Securities Litigation Reform Act of 1995 The statements contained in this release which are not historical facts are forward-looking statements that are subject to risks and uncertainties that could cause actual results to differ materially from those set forth in, or implied by, forward-looking statements. The Company has tried, whenever possible, to identify these forward-looking statements by using words such as "projects," "anticipates," "believes," "estimates," "expects," "plans," "intends," and similar expressions. Similarly, statements herein that describe the Company's business strategy, outlook, objectives, plans, intentions or goals are also forward-looking statements. The risks and uncertainties involving forward-looking statements include, for example, economic slowdowns, general market conditions, credit market contractions, consumer spending and debt levels, adverse changes in trends in the home improvement and remodeling and home building markets, the failure to realize expected benefits from acquisitions, material facilities systems disruptions and shutdowns, the failure to locate, acquire and integrate acquisition candidates, commodity price risk, foreign currency exchange risk, interest rate risk, the dependence on key employees and other risks described in the Company's Quarterly Report on Form 10-Q for the quarterly period ended March 27, 2009 and in the Company's Annual Report on Form 10-K for the fiscal year ended December 26, 2008. These statements reflect the Company's current beliefs and are based upon information currently available to it. Be advised that developments subsequent to this release are likely to cause these statements to become outdated with the passage of time. The Company does not currently intend, however, to update the information provided today prior to its next earnings release. CONTACT: Tom Tossavainen PHONE: 904-421-1441 INTERLINE BRANDS, INC. AND SUBSIDIARIES CONSOLIDATED BALANCE SHEETS AS OF JUNE 26, 2009 AND DECEMBER 26, 2008 (in thousands, except share and per share data) June 26, December 26, 2009 2008 ----------- ------------ ASSETS Current Assets: Cash and cash equivalents $69,374 $62,724 Accounts receivable - trade (net of allowance for doubtful accounts of $12,703 and $12,140) 137,934 139,522 Inventory 198,476 211,200 Income tax receivable - 1,452 Prepaid expenses and other current assets 20,461 22,884 Deferred income taxes 19,564 19,010 ----------- ------------ Total current assets 445,809 456,792 Property and equipment, net 48,085 46,033 Goodwill 318,229 317,117 Other intangible assets, net 128,604 132,787 Other assets 9,637 10,119 ----------- ------------ Total assets $950,364 $962,848 =========== ============ LIABILITIES AND SHAREHOLDERS' EQUITY Current Liabilities: Accounts payable $95,701 $68,255 Accrued expenses and other current liabilities 40,337 31,394 Accrued interest 388 1,072 Income tax payable 506 - Current portion of long-term debt 1,963 1,625 Capital lease - current 253 239 ----------- ------------ Total current liabilities 139,148 102,585 Long-Term Liabilities: Deferred income taxes 39,645 37,210 Long-term debt, net of current portion 339,015 401,765 Capital lease - long term 96 226 Other liabilities 842 989 ----------- ------------ Total liabilities 518,746 542,775 Commitments and contingencies Senior preferred stock; $0.01 par value, 20,000,000 shares authorized; no shares outstanding as of June 26, 2009 and December 26, 2008 - - ----------- ------------ Shareholders' Equity: Common stock; $0.01 par value, 100,000,000 authorized; 32,563,211 issued and 32,451,797 outstanding as of June 26, 2009 and 32,561,360 issued and 32,449,946 outstanding as of December 26, 2008 326 326 Additional paid-in capital 573,823 571,868 Accumulated deficit (141,489) (150,833) Accumulated other comprehensive income 941 695 Treasury stock, at cost, 111,414 shares as of June 26, 2009 and December 26, 2008 (1,983) (1,983) ----------- ------------ Total shareholders' equity 431,618 420,073 ----------- ------------ Total liabilities and shareholders' equity $950,364 $962,848 =========== ============ INTERLINE BRANDS, INC. AND SUBSIDIARIES CONSOLIDATED STATEMENTS OF EARNINGS THREE AND SIX MONTHS ENDED JUNE 26, 2009 AND JUNE 27, 2008 (in thousands, except share and per share data) Three Months Ended Six Months Ended ----------------------- ----------------------- June 26, June 27, June 26, June 27, 2009 2008 2009 2008 ----------- ----------- ----------- ----------- Net sales $269,920 $311,429 $526,713 $600,575 Cost of sales 171,605 195,629 331,802 374,725 ----------- ----------- ----------- ----------- Gross profit 98,315 115,800 194,911 225,850 Operating Expenses: Selling, general and administrative expenses 78,898 88,585 162,818 173,598 Depreciation and amortization 4,392 4,102 9,026 7,981 ----------- ----------- ----------- ----------- Total operating expense 83,290 92,687 171,844 181,579 ----------- ----------- ----------- ----------- Operating income 15,025 23,113 23,067 44,271 (Loss) Gain on extinguishment of debt, net (177) - 1,543 - Interest expense (4,717) (7,004) (10,096) (14,746) Interest and other income 440 708 730 1,403 ----------- ----------- ----------- ----------- Income before income taxes 10,571 16,817 15,244 30,928 Income tax provision 4,149 5,642 5,900 11,079 ----------- ----------- ----------- ----------- Net income $6,422 $11,175 $9,344 $19,849 =========== =========== =========== =========== Earnings Per Share: Basic $0.20 $0.35 $0.29 $0.61 =========== =========== =========== =========== Diluted $0.20 $0.34 $0.29 $0.61 =========== =========== =========== =========== Weighted-Average Shares Outstanding: Basic 32,441,081 32,369,031 32,440,035 32,348,109 =========== =========== =========== =========== Diluted 32,856,916 32,657,047 32,704,682 32,650,806 =========== =========== =========== =========== INTERLINE BRANDS, INC. AND SUBSIDIARIES CONSOLIDATED STATEMENTS OF CASH FLOWS SIX MONTHS ENDED JUNE 26, 2009 AND JUNE 27, 2008 (in thousands) Six Months Ended -------------------------------- June 26, June 27, 2009 2008 ------------ ------------ Cash Flows from Operating Activities: Net income $9,344 $19,849 Adjustments to reconcile net income to net cash provided by operating activities: Depreciation and amortization 9,322 8,238 Gain on extinguishment of debt, net (1,543) - Amortization of debt issuance costs 562 565 Amortization of discount on 8 1/8% senior subordinated notes 72 72 Write-off of deferred acquisition costs 672 - Share-based compensation 1,955 2,353 Excess tax benefits from share-based compensation - (147) Deferred income taxes 2,340 (1,003) Provision for doubtful accounts 6,324 2,255 Loss on disposal of property and equipment 12 19 Changes in assets and liabilities which provided (used) cash: Accounts receivable - trade (4,673) (15,480) Inventory 12,830 (19,533) Prepaid expenses and other current assets 2,747 1,663 Other assets (190) 1,573 Accounts payable 27,428 31,071 Accrued expenses and other current liabilities 4,002 (3,758) Accrued interest (684) 7 Income taxes 1,957 832 Other liabilities (141) (1,402) ------------ ------------ Net cash provided by operating activities 72,336 27,174 Cash Flows from Investing Activities: Purchase of property and equipment, net (5,688) (13,540) Purchase of short-term investments - (35,531) Proceeds from sales and maturities of short-term investments - 80,121 Purchase of businesses, net of cash acquired (381) (536) ------------ ------------ Net cash (used in) provided by investing activities (6,069) 30,514 Cash Flows from Financing Activities: Increase (Decrease) in purchase card payable, net 726 (643) Repayment of term debt (26,162) (2,150) Repayment of 8 1/8% senior subordinated notes (34,157) - Payments on capital lease obligations (116) (108) Proceeds from stock options exercised - 586 Excess tax benefits from share-based compensation - 147 Treasury stock acquired to satisfy minimum statutory tax withholding requirements - (772) ------------ ------------ Net cash used in financing activities (59,709) (2,940) Effect of exchange rate changes on cash and cash equivalents 92 (40) ------------ ------------ Net increase in cash and cash equivalents 6,650 54,708 Cash and cash equivalents at beginning of period 62,724 4,975 ------------ ------------ Cash and cash equivalents at end of period $69,374 $59,683 ============ ============ Supplemental Disclosure of Cash Flow Information: Cash paid during the period for: Interest $10,196 $14,431 ============ ============ Income taxes, net of refunds $1,749 $12,315 ============ ============ Schedule of Non-Cash Investing Activities: Property acquired through lease incentives $3,009 $- ============ ============ Adjustments to liabilities assumed and goodwill on businesses acquired $732 $- ============ ============ INTERLINE BRANDS, INC. AND SUBSIDIARIES RECONCILIATION OF NON-GAAP INFORMATION THREE AND SIX MONTHS ENDED JUNE 26, 2009 AND JUNE 27, 2008 (in thousands) Free Cash Flow Three Months Ended Six Month Ended ------------------ --------------- June 26, June 27, June 26, June 27, 2009 2008 2009 2008 ------ ------ ------ ------ Net cash from operating activities $9,761 $(1,937) $72,336 $27,174 Less capital expenditures (3,295) (7,040) (5,688) (13,540) ------ ------ ------ ------- Free cash flow $6,466 $(8,977) $66,648 $13,634 ====== ======= ======= ======= We define free cash flow as net cash provided by operating activities, as defined under GAAP, less capital expenditures. We believe that free cash flow is an important measure of our liquidity and therefore our ability to reduce debt and make strategic investments after considering the capital expenditures necessary to operate the business. We use free cash flow in the evaluation of the Company's business performance. A limitation of this measure, however, is that it does not reflect payments made in connection with investments and acquisitions, which reduce liquidity. To compensate for this limitation, management evaluates its investments and acquisitions through other return on capital measures. Daily Sales Calculations Three Months Ended Six Months Ended ------------------ ---------------- June 26, June 27, % June 26, June 27, % 2009 2008 Variance 2009 2008 Variance ------ ------ -------- -------- -------- -------- Net sales $269,920 $311,429 -13.3% $526,713 $600,575 -12.3% Less acquisitions: (4,420) - (9,340) - -------- -------- -------- -------- Organic sales $265,500 $311,429 -14.7% $517,373 $600,575 -13.9% ======== ======== ===== ======== ======== ===== Daily sales: Ship days 64 64 128 128 Average daily sales(1) $4,218 $4,866 -13.3% $4,115 $4,692 -12.3% ======== ======== ===== ======== ======== ===== Average organic daily sales(2) $4,148 $4,866 -14.7% $4,042 $4,692 -13.9% ======== ======== ===== ======== ======== ===== (1) Average daily sales are defined as sales for a period of time divided by the number of shipping days in that period of time. (2) Average organic daily sales are defined as sales for a period of time divided by the number of shipping days in that period of time excluding any sales from acquisitions made subsequent to the beginning of the prior year period. Average organic daily sales is presented herein because we believe it to be relevant and useful information to our investors since it is used by management to evaluate the operating performance of our business, as adjusted to exclude the impact of acquisitions, and compare our organic operating performance with that of our competitors. However, average organic daily sales is not a measure of financial performance under GAAP and it should be considered in addition to, but not as a substitute for, other measures of financial performance reported in accordance with GAAP, such as net sales. Management utilizes average organic daily sales as an operating performance measure in conjunction with GAAP measures such as net sales. Adjusted EBITDA Three Months Ended Six Months Ended ------------------ ---------------- June 26, June 27, June 26, June 27, 2009 2008 2009 2008 ---- ---- ---- ---- Adjusted EBITDA: Net income (GAAP) $6,422 $11,175 $9,344 $19,849 Interest expense 4,717 7,004 10,096 14,746 Interest income (71) (353) (75) (888) Loss (Gain) on extinguishment of debt 177 - (1,543) - Income tax provision 4,149 5,642 5,900 11,079 Depreciation and amortization 4,541 4,245 9,322 8,238 ------- ------- ------- ------- Adjusted EBITDA $19,935 $27,713 $33,044 $53,024 ======= ======= ======= ======= Adjusted EBITDA differs from Consolidated EBITDA per our credit facility agreement for purposes of determining our net leverage ratio. We define Adjusted EBITDA as net income plus interest expense (income), net, (gain) loss on extinguishment of debt, provision for income taxes and depreciation and amortization. Adjusted EBITDA is presented herein because we believe it to be relevant and useful information to our investors since it is consistently used by our management to evaluate the operating performance of our business and to compare our operating performance with that of our competitors. Management also uses Adjusted EBITDA for planning purposes, including the preparation of annual operating budgets, and to determine appropriate levels of operating and capital investments. Adjusted EBITDA excludes certain items, which we believe are not indicative of our core operating results. We therefore utilize Adjusted EBITDA as a useful alternative to net income as an indicator of our operating performance compared to the Company's plan. However, Adjusted EBITDA is not a measure of financial performance under GAAP. Accordingly, Adjusted EBITDA should not be used in isolation or as a substitute for other measures of financial performance reported in accordance with GAAP, such as gross margin, operating income, net income, cash flows from operating, investing and financing activities or other income or cash flow statement data prepared in accordance with GAAP. While we believe that some of the items excluded from Adjusted EBITDA are not indicative of our core operating results, these items do impact our income statement, and management therefore utilizes Adjusted EBITDA as an operating performance measure in conjunction with GAAP measures, such as gross margin, operating income, net income, cash flows from operating, investing and financing activities or other income or cash flow statement data prepared in accordance with GAAP. End-Market Classification Adjustment During the first quarter of 2009, we reported end-market sales for the professional contractor and specialty distributor end markets using a slightly different customer classification than used historically. This change impacted the first quarter of 2009 and not prior year periods. The impact was that $2.0 million of sales was moved from our professional contractor end-market to our specialty distributor end-market. Excluding this change in classification, professional contractor end-market sales declined 23.6% and specialty distributor end-market sales declined 14.2% during the first quarter of 2009. For the remainder of 2009, including the second quarter of 2009, we will report using our historical classification for comparability purposes. DATASOURCE: Interline Brands, Inc. CONTACT: Tom Tossavainen, for Interline Brands, Inc., +1-904-421-1441 Web Site: http://www.interlinebrands.com/

Copyright

1 Year Infinity Bio-energy Chart

1 Year Infinity Bio-energy Chart

1 Month Infinity Bio-energy Chart

1 Month Infinity Bio-energy Chart

Your Recent History

Delayed Upgrade Clock