ADVFN Logo ADVFN

We could not find any results for:
Make sure your spelling is correct or try broadening your search.

Trending Now

Toplists

It looks like you aren't logged in.
Click the button below to log in and view your recent history.

Hot Features

Registration Strip Icon for default Register for Free to get streaming real-time quotes, interactive charts, live options flow, and more.

CGL Castelnau Group Limited

76.00
-1.00 (-1.30%)
02 Jul 2024 - Closed
Delayed by 15 minutes
Share Name Share Symbol Market Type Share ISIN Share Description
Castelnau Group Limited LSE:CGL London Ordinary Share GG00BMWWJM28 ORD NPV
  Price Change % Change Share Price Bid Price Offer Price High Price Low Price Open Price Shares Traded Last Trade
  -1.00 -1.30% 76.00 75.00 78.00 77.00 76.50 77.00 75,302 16:35:06
Industry Sector Turnover Profit EPS - Basic PE Ratio Market Cap
Trust,ex Ed,religious,charty -29.82M -34.09M -0.1068 -7.16 244.18M

Cagle's Inc. Reports First Quarter Earnings of $1.4 million, or $.30 Per Share

04/08/2005 11:21pm

PR Newswire (US)


Castelnau (LSE:CGL)
Historical Stock Chart


From Jul 2019 to Jul 2024
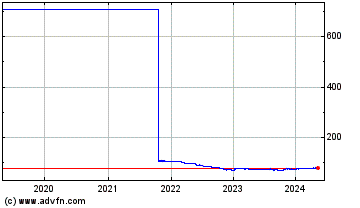
Click Here for more Castelnau Charts.
ATLANTA, Aug. 4 /PRNewswire-FirstCall/ -- Cagle's Inc. (AMEX:CGL.A) today reported the following results for its first quarter ended July 02, 2005. Net income for the first quarter of fiscal 2006 was $1.4 million or $.30 per diluted share as compared with a net income of $6.2 million or $1.30 per diluted share for the first quarter of fiscal 2005. In general, quoted poultry markets for the first three months of our current fiscal year were approximately 28% lower than the first quarter of fiscal 2005. In large part the decrease in market price can be attributed to the commodity boneless breast market, a product segment that Cagle's is transitioning from as we continue to realign our operations to serve the Deli and Fast Food markets which require a smaller, more tender bird. This shift in Cagle's product mix allowed us to offset a portion of the decrease in quoted markets as our average price per pound reflected a reduction of only 17% for the first quarter of 2006 versus the same period in fiscal 2005. In support of margins, feed prices for the first three months of fiscal 2006 were 23% less than the same period last year. Cagle's Inc. J. Douglas Cagle Chairman, CEO Forward-Looking Statements: Statements contained in this press release that state the intentions, hopes, beliefs, anticipations, expectations or predictions of the future of Cagle's Inc. and its management are forward looking statements. It is important to note that the actual results could differ materially from those projected. Factors that could cause actual results to differ materially from those project in such forward-looking statements include: additional outbreaks of avian influenza or other diseases affecting the production performance and/or marketability of the Company's poultry products; matters affecting the poultry industry in general, including fluctuations in the commodity prices of feed ingredients and chicken; contamination of our products leading to product liability claims and recalls; exposures to risks related to property damage and injuries to persons for which insurance is limited and potentially inadequate; management of our cash resources, particularly in light of our substantial leverage; trade barriers; changes in laws or regulations affecting our operations as well as competitive factors and pricing pressures; and the impact of uncertainties of litigations as well as other risk factors. Cagle's Inc. Consolidated Statements of Income (in thousands except per share amounts) (Unaudited) Three Months Ended July 02, 2005 July 03, 2004 Net Sales $61,593 $67,152 Cost and Expenses: Cost of Sales 56,981 55,055 Selling, general, and administrative 3,240 2,921 Total Cost and Expenses 60,221 57,976 Operating Income (Loss) 1,372 9,176 Other Income (Expense): Interest (624) (701) Miscellaneous 525 13 Total Other Income (Expense) Net (99) (688) Earnings from unconsolidated affiliates 975 1,116 Income (loss) before income taxes 2,248 9,604 Income tax expense (benefit) 809 3,442 Net Income (Loss) $1,439 $6,162 Net Income (Loss) per share $.30 $ 1.30 Cagle's Inc. Condensed Consolidated Balance Sheet (in thousands) (Unaudited) ASSETS July 02, 2005 July 03, 2004 Current assets $33,581 $36,124 Investments in affiliates 6,781 5,092 Other assets 9,945 14,347 Property, plant, and equipment, net 45,007 44,496 Total Assets $95,314 $99,059 LIABILITIES AND STOCKHOLDER'S EQUITY Current maturities of long-term debt $ 3,488 $2,920 Trade accounts payable 11,060 13,819 Other current liabilities 6,293 8,423 Total current liabilities 20,841 25,162 Long-term debt less current maturities 27,228 32,043 Other non-current Liabilities - 1,423 Total Stockholders Equity 47,245 40,428 LIABILITIES AND STOCKHOLDER'S EQUITY $95,314 $99,059 DATASOURCE: Cagle's Inc. CONTACT: George Pitts or Mark Ham of Cagle's Inc., +1-404-355-2820 Web site: http://www.cagles.net/

Copyright

1 Year Castelnau Chart

1 Year Castelnau Chart

1 Month Castelnau Chart

1 Month Castelnau Chart

Your Recent History

Delayed Upgrade Clock