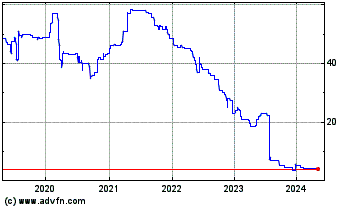
W.h. Ireland (LSE:WHI)
Historical Stock Chart
From Dec 2019 to Dec 2024
MAYAGUEZ, Puerto Rico, Jan. 30 /PRNewswire-FirstCall/ -- W Holding Company, Inc. (NYSE: "WHI"), the financial holding company of Westernbank Puerto Rico, today reported its financial position and results of operations for the quarter and year ended December 31, 2006.
YEAR-END AND FOURTH QUARTER HIGHLIGHTS:
For the year ended December 31, 2006, W Holding reported a net income of $100.5 million or $0.39 earnings per basic common share ($0.38 on a diluted basis). This is a decrease of $62.6 million or 38.36%, when compared to a net income of $163.1 million or $0.77 earnings per basic common share ($0.74 on a diluted basis) for the same period in 2005.
Net income for the fourth quarter of year 2006, was $17.9 million or $0.05 earnings per basic and diluted common share, when compared to $30.2 million or $0.13 earnings per basic common share ($0.12 on a diluted basis) for the same quarter in 2005, a decrease of $12.3 million or 40.81%.
The fourth quarter of year 2006 was mainly impacted by the following:
* an increase of $5.5 million in the current income tax provision, mainly
as a result of additional income tax provisions for the transitory
income tax of 2% approved by the Government of Puerto Rico on May 13,
2006, a provision of $2.9 million for income tax contingencies, and a
change in the proportion between exempt and taxable income, therefore
increasing the Company's effective tax rate. The transitory income taxes
of 2% and 2.5% (the latter was approved by the Government of Puerto Rico
on August 1, 2005) are intended to be temporary in nature and are
scheduled to end on December 31, 2006;
* an increase of $5.2 million in noninterest expenses, principally
attributed to the Company's continued growth and expansion in all of its
business areas, mainly in the San Juan Metropolitan area;
* a $14.0 million increase in the provision for loan losses as a result of
the increases in the Company's loan portfolios, net loans charged-off,
non-performing loans and loss allowances on classified loans;
* and a $10.0 million increase in net interest income.
The net income for the year ended December 31, 2006, was mainly impacted by:
* an increase of $24.1 million in the current income tax provision, which
includes a provision for income tax contingencies of $10.2 million for
the year ended December 31, 2006;
* an increase of $16.3 million in noninterest expenses;
* an increase of $33.6 million in the provision for loan losses;
* and a $7.2 million increase in net interest income.
Effective January 1, 2007, the Company adopted Financial Accounting Standards Board ("FASB") Interpretation No. 48 ("FIN No. 48"), "Accounting for Uncertainty in Income Taxes". For the preliminary cumulative effect of the adoption of FIN No. 48, refer to the "New Accounting Pronouncement" section.
Overview
W Holding reported net income for the fourth quarter of 2006 of $17.9 million or $0.05 earnings per basic common and diluted common share, when compared to $30.2 million or $0.13 earnings per basic common share ($0.12 on a diluted basis) for the same quarter in 2005, a decrease of $12.3 million or 40.81%. Net income for the fourth quarter of 2006 was impacted by a $14.0 million increase in the provision for loan losses (mainly attributed to the loan portfolio of the Company's asset-based lending division), an increase of $5.2 million in noninterest expenses and an increase of $6.4 million in the provision for income taxes. Such effects were partially offset by an increase of $10.0 million or 13.26% in net interest income and a positive variance of $3.8 million on the net gain (loss) on derivative instruments.
For the year ended December 31, 2006, W Holding reported a net income of $100.5 million or $0.39 earnings per basic common share ($0.38 on a diluted basis). This is a decrease of $62.6 million or 38.36%, when compared to a net income of $163.1 million or $0.77 earnings per basic common share ($0.74 on a diluted basis) for the same period in 2005. Net income for the year ended December 31, 2006, was impacted by an increase of $33.6 million in the provision for loan losses, an increase of $16.3 million in noninterest expenses and an increase of $21.2 million in the provision for income taxes. Such increases were partially offset by an increase of $7.2 million or 2.32% in net interest income.
The return on assets (ROA) and the return on common stockholders' equity (ROCE) for the quarter ended December 31, 2006 were 0.42% and 4.96%, respectively, compared to 0.76% and 12.77% reported for the same quarter in 2005. For the year ended December 31, 2006, the ROA and the ROCE were 0.60% and 9.36%, respectively, compared to 1.07% and 20.53%, for the same period in the prior year.
At December 31, 2006, driven by strong increases in the W Holding loan portfolio, total assets ended at $17.15 billion. Total assets grew $1.00 billion or 6.21%, from $16.15 billion at December 31, 2005, almost exclusively from the growth of $825.4 million or 10.56% in the loans-net portfolio, partially offset by a decrease of $51.1 million in the investment portfolio, excluding short-term money market instruments. Continuing management's strategy implemented in the latter part of 2004, and in light of the current interest rate scenario and a flat-to-inverted yield curve during the year ended December 31, 2006, the Company has continued to emphasize the growth of its loan portfolio, principally through floating rate loans, so as to lessen the impact of margin compression, while remaining on the sidelines of the investment side until investment opportunities arise.
Stockholders' equity increased by $34.4 million or 2.88%, to $1.23 billion as of December 31, 2006, when compared to December 31, 2005. Such increase resulted principally from the combination of the net income of $100.5 million generated during the year ended December 31, 2006, and the proceeds from the exercise of stock options of $1.1 million, partially offset by dividends declared during year 2006 of $31.2 million and $36.9 million on the Company's common and preferred shares, respectively.
The period-end number of common shares outstanding increased from 164,098,237 as of December 31, 2005, to 164,486,691 as of December 31, 2006, as a result of the conversion of 3,550 shares of the Company's convertible preferred stock Series A, into 12,403 shares of the Company's common stock, and the issuance of 376,051 common shares from the exercise of stock options.
Net Interest Income
Net interest income for the fourth quarter ended December 31, 2006, was $85.3 million, an increase of $10.0 million or 13.26%, from $75.3 million for the same quarter in 2005. This increase mainly resulted from an increase in the average net interest-earning assets of $56.3 million, which contributed a $10.4 million positive volume variance, partially offset by a $448,000 negative rate variance. In addition, such increase includes a $5.9 million prepayment fee collected in the quarter on a commercial loan relationship. Average interest-earning assets for the fourth quarter of 2006 increased by $1.00 billion or 6.43%, compared to the same quarter in year 2005. The average loan portfolio increased by $981.5 million or 12.80%, particularly in the commercial real estate collateralized and commercial, industrial and agricultural ("Commercial & C&I") and in the construction loan portfolios. The average investment portfolio, excluding short-term money market instruments, increased by $149.8 million or 2.37%, primarily in short- term tax-exempt securities, such as U.S. Government Agencies discount notes. Average mortgage-backed securities and average money market instruments decreased by $58.7 million or 8.10% and $71.7 million or 8.28%, respectively. The change in the investments portfolio is attributable to the reinvestment in short-term tax-exempt securities, specifically U.S. Government Agencies discount notes, as part of management's strategy of growing the Company's tax exempt interest income.
For the year ended December 31, 2006, net interest income increased from $311.6 million in 2005 to $318.8 million in 2006, an increase of $7.2 million or 2.32%. This increase mainly resulted from an increase in the average net interest-earning assets of $97.4 million, which contributed a $52.8 million positive volume variance, partially offset by a $45.6 million negative rate variance. In addition, such increase includes a $5.9 million prepayment fee collected in the fourth quarter of 2006 on a commercial loan relationship. Average interest-earning assets increased by $1.35 billion or 9.01%. The average loan portfolio increased by $1.32 billion or 18.92%, particularly in the Commercial & C&I loan portfolio, as explained before. The average investment portfolio, excluding short-term money market instruments, increased by $252.2 million or 4.02%, primarily in short-term tax-exempt securities, such as U.S. Government Agencies discount notes, as explained before, while average mortgage-backed securities and average money market instruments decreased by $120.0 million or 15.95% and $105.6 million or 11.10%, respectively.
The average yield earned on interest-earning assets increased 89 basis points from 5.53% to 6.42%, and 81 basis points from 5.32% to 6.13%, for the quarter and the year ended December 31, 2006, respectively, when compared to the same periods in the prior year. The increase in the average yield for the quarter and the year ended December 31, 2006, was mainly due to higher average yields earned on the loan portfolio, higher reinvestment rates on matured and called securities and higher yields earned on mortgage-backed securities and money market instruments. The increase in the average yield earned on the loan portfolio was due to new higher yielding loans and the repricing of existing floating and adjustable rate Commercial and C&I loans. In addition, such increase includes a $5.9 million prepayment fee collected and mentioned before. During the year ended December 31, 2006, the Federal Reserve increased the discount rate by 100 basis points, which has reflected equally on the Prime Rate, the index used by the Bank to reprice most of its floating rate commercial loans.
For the quarter ended December 31, 2006, the Company's overall cost of funds increased 81 basis points when compared to the same quarter in 2005. This increase was due to a general increase in the cost of funding sources of the Company. The average interest rate paid on deposits increased by 89 basis points for the quarter ended December 31, 2006, as compared to the same period in 2005. Average interest rate paid on federal funds purchased and repurchase agreements increased by 77 basis points for the quarter ended December 31, 2006, as compared to the same period in 2005. The average interest rate paid on advances from the FHLB also increased by 102 basis points for the quarter ended December 31, 2006, as compared to the same period in 2005.
For the year ended December 31, 2006, the overall cost of funds increased 101 basis points as compared to the year ended December 31, 2005. The average interest rate paid on deposits increased by 90 basis points for the year ended December 31, 2006, as compared to the same period in 2005. Average interest rates paid on federal funds purchased and repurchase agreements increased 122 basis points for the year ended December 31, 2006, as compared to the year ended December 31, 2005. The average interest rate paid on advances from the FHLB increased 117 basis points for the year ended December 31, 2006, as compared to the same period in 2005.
The strong growth in average interest-earning assets between both periods was in part offset by an increase in the average interest-bearing liabilities of $944.7 million or 6.51%, and $1.25 billion or 8.96%, for the quarter and the year ended December 31, 2006, respectively. Deposits grew on average by $966.1 million or 11.97%, and $1.39 billion or 18.91%, during the quarter and year ended December 31, 2006, respectively, while other borrowings (federal funds purchased, repurchase agreements and advances from FHLB) on average decreased by $21.4 million or 0.33%, and $144.0 million or 2.19%, for the same periods in 2005, respectively.
On a linked quarter comparison, the average yield earned in interest- earning assets increased 19 basis points, from 6.23% for the third quarter of 2006 to 6.42% for the fourth quarter of 2006. The increase in the average yield for the fourth quarter of 2006 was mainly due to higher average yields earned on the loan portfolio and on the mortgage-backed securities portfolio. Meanwhile, the Company's overall cost of funds increased by 5 basis points for the fourth quarter of 2006, as compared to the third quarter of 2006. The increase in the overall cost of funds was due to a general increase in the cost of funding sources of the Company, principally in the average interest rate paid on deposits.
Net Interest Margin
The Company's net interest margin increased 12 basis points for the fourth quarter of 2006 to 2.04%, as compared to 1.92% in the fourth quarter of 2005. On a tax equivalent basis, the Company's net interest margin remained relatively unchanged at 2.09% for the fourth quarter of 2006, when compared to the same quarter in 2005. The improvement in the net interest margin for the fourth quarter of 2006 was mainly due to the increase in the average yield earned on the loan portfolio as a result of higher yielding loans and the repricing of existing floating and adjustable rate Commercial and C&I loans. In addition, such increase includes a $5.9 million prepayment fee collected in the quarter on a commercial loan. For the year ended December 31, 2006, the Company's net interest margin decreased 12 basis points, and on a tax equivalent basis, decreased 30 basis points, when compared to the year ended December 31, 2005. The decrease in the Company's net interest margin when compared to prior year was due to the fact that the upward repricing of the Company's interest-earning assets lagged behind the increase in the cost of funds of its interest-bearing liabilities. In addition, the net interest margin on a tax equivalent basis resulted from a reduction in the proportion of the Company's exempt assets. On a linked quarterly comparison, the Company's net interest margin increased by 13 basis points, from 1.91% in the third quarter of 2006. On a tax equivalent basis, the Company net interest margin improved by 10 basis points from 1.99% in the third quarter of 2006.
Under a flat interest rate scenario for the next twelve-month period, based on the Company's asset and liability composition as of December 31, 2006, we estimate the Company's net interest margin will be within a range of 1.79% to 1.87% during said period. Assuming an instantaneous 100 basis-points decrease in the fed funds rate, we estimate the Company's net interest margin will fluctuate within a range of 1.84% to 1.95% during said period. Under an instantaneous 200 basis-points decrease in the fed funds rate, we estimate the Company's net interest margin will fluctuate within a range of 1.71% to 1.91%. Assuming a 100 basis-points increase in the fed funds rate, we estimate the Company's net interest margin will fluctuate within a range of 1.59% to 1.90%. Furthermore, a 200 basis-points increase in the fed funds rate will cause the Company's net interest margin to fluctuate between a range of 1.33% to 1.92%. The lower and higher values of such range mean the lowest and highest net interest margin for any given quarter within the said twelve-month period. These ranges are management's estimates based on instantaneous rate shocks of 100 and 200 basis-points with results one year (twelve months) forward. They do not consider any asset/liability management strategy that could be undertaken given such interest rate changes during said one year period.
Attached as Exhibits IIIa, IIIb and IIIc are supplemental unaudited data schedules providing additional information on the net interest margin, including average balances and average rates for both, interest-earning assets and interest-bearing liabilities, as well as changes in volumes and rates for the periods presented.
Noninterest Income
Noninterest income increased $3.3 million or 48.19% for the three-month period ended December 31, 2006, when compared to the same period in 2005. This increase was mainly due to a positive variance of $3.8 million in net gain (loss) on derivative instruments, as a result of the mark to market of such positions. On January 3, 2006, the Company redesignated most of its interest rate swaps relating to its brokered certificates of deposit ("brokered CDs") utilizing the "long-haul" method of SFAS No. 133. In cases in which the hedging relationship is effective, the changes in the fair value of both the hedged items (the brokered CDs) and the interest rate swaps are recorded through earnings. Service fees and other fees and commissions for the fourth quarter of 2006 increased slightly to $10.2 million, when compared to $10.0 million for the same period in 2005.
For the year ended December 31, 2006, noninterest income increased $1.3 million or 3.57%, when compared to year 2005. This increase was mainly the result of an increase of $4.2 million or 12.61% in service fees and other fees and commissions due to higher activity and fees resulting from the Company's overall growing volume of business and other fees. Such increase was partially offset by a negative variance of $1.2 million on net gain (loss) on derivative instruments, as a result of the mark to market of such positions. Also, during the year ended December 31, 2006, the Company recorded a loss of $1.8 million on other-than-temporarily impaired investments, mainly related to certain investments in Puerto Rico Government Obligations that were downgraded by one notch below investment grade in May 2006.
Noninterest Expenses
Total noninterest expenses increased $5.2 million or 18.01% for the three- month period ended December 31, 2006, and $16.3 million or 15.05% for the year ended December 31, 2006, when compared to the corresponding periods in 2005. Salaries and employees' benefits, the largest component of total noninterest expenses, increased $2.2 million or 17.47% for the quarter ended December 31, 2006 and $7.7 million or 16.56%, for the year ended December 31, 2006 compared to the corresponding periods in 2005. Such increases are attributed to the increases in personnel, normal salary increases and related employees' benefits, principally related to the Company's continued expansion in all of its business areas, mainly in the San Juan Metropolitan area. In October 2005, the Company opened its second branch in the eastern region of Puerto Rico, in the city of Fajardo. In December 2005, the Company opened a mega branch in the Condado area in the city of San Juan and in September 2006, the Company opened its newest mega branch in the city of Bayamon. Also, during the first quarter of year 2006, the Company established Westernbank International Trade Services ("WITS"), a division of Westernbank Puerto Rico that provides international trade products and services to customers. At December 31, 2006, the Company had 1,363 full-time employees, including its executive officers, an increase of 52 employees or 3.97% since December 31, 2005.
Depreciation, maintenance and related equipment expenses increased $557,000 or 22.26% for the three months ended December 31, 2006, and $2.1 million or 21.52% for the year ended December 31, 2006, when compared to the same periods in 2005. The increase was mainly due to the continued growth of the Company's branch network, as explained in the above paragraph.
Noninterest expenses, other than salaries and employees' benefits and related equipment expenses discussed above, increased by $2.4 million or 17.74% for the quarter ended December 31, 2006, and $6.5 million or 12.51% for the year ended December 31, 2006, when compared to the same period in 2005. Such increases resulted primarily from the additional investment in technology and general infrastructure to sustain and coordinate the Company's growth and expansion in all of its business areas, mainly in the San Juan Metropolitan area.
The Company has maintained operating expenses at adequate levels and achieved an efficiency ratio of 34.94% for the year ended December 31, 2006 and 35.64% for the fourth quarter of 2006, compared to 30.67% and 33.43% for the same periods in 2005, respectively. The change in the efficiency ratio in 2006 was mainly due to increases in non-interest expenses.
Provision for Income Taxes
The provision for income taxes increased $21.2 million or 47.06% for the year ended December 31, 2006, when compared to the same period in 2005. The current provision for income taxes for the year ended December 31, 2006, amounted to $76.6 million, an increase of $24.1 million or 45.80%, when compared to $52.5 million for the same period in 2005. The increase in the current provision for income taxes is attributed to three factors. First, on May 13, 2006, with an effective date of January 1, 2006, the Puerto Rico Legislature approved Law No. 89, which imposes an additional 2.0% tax on all companies covered by the Puerto Rico Banking Act, as amended, such as Westernbank. Therefore, Westernbank is now subject to a maximum statutory tax rate of 43.5%. This transitory income tax of 2% amounted to $3.0 million for the year ended December 31, 2006. The transitory income taxes of 2% and 2.5% (the latter was approved by the Government of Puerto Rico on August 1, 2005) are intended to be temporary in nature and are scheduled to end on December 31, 2006. Second, the increase in the Company's taxable income derived from the increase in its loan portfolio has changed the proportion between exempt and taxable income, therefore increasing the Company's effective tax rate. Third, for the year ended December 31, 2006, the Company accrued $10.2 million for income tax contingencies.
The Company evaluates and assesses the relative risks and appropriate tax treatment of transactions and filing positions after considering statutes, regulations, judicial precedent and other information and maintains tax accruals consistent with its evaluation of these relative risks and merits. Changes to the estimate of accrued taxes occur periodically due, among other, to changes in tax rates, interpretations of tax laws, the status of examinations being conducted by taxing authorities and changes to statutory, judicial and regulatory guidance that impact the relative risks of tax positions. These changes, when they occur, can affect the income tax accruals as well as the current period's income tax expense and can be significant to the operating results of the Company. The Company's consolidated statements of financial condition include an accrual of $10.9 million at December 31, 2006, for the exposures resulting from tax positions identified by the Company in connection with this evaluation.
The deferred credit for the year ended December 31, 2006, increased by $2.8 million, when compared to the same period in the prior year. Such increase is attributable to temporary differences in the recognition of certain items for tax and books, principally changes in the allowance for loan losses and in the fair value of derivative instruments.
Asset Quality
W Holding's asset quality continues to be strong in spite of the Company's continued loan portfolio growth, as measured by the Company's ratios of net loan charge-offs to average total loans, provision for loan losses to net loans charged-off and reserves to total loans.
The Company's combined delinquency on all portfolios for the categories of 60 days and over was 0.66% (less than 1%) at December 31, 2006, an improvement of 6 basis points when compared to 0.72% (less than 1%) at December 31, 2005. The improvement in the combined delinquency ratio arises from a reduction in delinquent loans of the Commercial and C&I and construction loan portfolios.
The delinquency ratio on the Commercial and C&I and construction loan portfolios for the categories of 60 days and over improved to 0.63% (less than 1%), when compared to 0.85% (less than 1%) reported for year 2005, a decrease of 22 basis points. The delinquency ratio on the consumer loan portfolio, including the Expresso of Westernbank loan portfolio, for the categories of 60 days and over increased by 39 basis points, to 1.52% at December 31, 2006, when compared to 1.13% for the comparable period last year. The increase in the delinquency ratio of the consumer loans portfolio is mainly attributable to regular consumer loans past due over 60 days which are collateralized by real estate properties.
On a linked quarter comparison, the Company's combined delinquency on all portfolios for the categories of 60 days and over improved by 4 basis points, from 0.70% (less than 1%) at September 30, 2006. As explained before, the decrease in the combined delinquency ratio arises from a decrease in delinquent loans of the Commercial and C&I and construction loan portfolios. The delinquency ratio on the Commercial and C&I and construction loan portfolios for the categories of 60 days and over improved by 1 basis point from 0.64% (less than 1%) at September 30, 2006. The delinquency ratio on the consumer loan portfolio, including the Expresso of Westernbank loan portfolio, for the categories of 60 days and over decreased by 38 basis points when compared to 1.90% at September 30, 2006. The decrease in the consumer loan portfolio delinquency ratio on a linked quarter comparison is mainly due to lower loans past due over 60 days in the regular consumer loan portfolio.
The provision for possible loan losses increased by $14.0 million, up to $28.0 million for the fourth quarter of 2006, when compared to the same quarter in 2005. For the year ended December 31, 2006, the provision for possible loan losses amounted to $64.6 million, up by $33.6 million, from $31.0 million for the year ended December 31, 2005. The allowance for possible loan losses reached $126.8 million as of December 31, 2006. The increase in the provision for loan losses for both periods is attributable to the following factors: first, the overall growth in the Company's loan portfolio, mainly those of its Commercial and C&I loans; and second, to higher non- performing loans, net loans charged-off and specific reserves during the period, principally in the loan portfolio of the Company's asset-based lending division.
Commercial and C&I loan portfolio grew to $6.22 billion at December 31, 2006, an increase of $946.8 million or 17.95%, when compared to December 31, 2005. Westernbank Business Credit loan portfolio grew to $1.46 billion at December 31, 2006, an increase of $193.2 million or 15.28%, when compared to December 31, 2005.
The provision for loan losses for the asset-based lending division increased by $4.6 million and $35.1 million, for the quarter and the year ended December 31, 2006, when compared to the same periods in 2005. Such increases are mainly attributable to two factors: first, the increase in the Division's loan portfolio from $1.26 billion at December 31, 2005, to $1.46 billion at December 31, 2006; and second, the increase in classified loans of the Division's loans portfolio. During the year ended December 31, 2006, the Company classified three loans of the Division's loan portfolio with outstanding principal balances of $44.9 million, $40.5 million and $7.3 million at December 31, 2006. These loans required valuation allowances as follows: $11.4 million for the $44.9 million loan (after a partial charge- off of $7.5 million), $15.2 million for the $40.5 million loan and $2.5 million for the $7.3 million loan (after a partial charge-off of $3.0 million). All these loans are current and have not missed their payment schedules but have shortfalls in the collaterals and in the financial condition of the borrowers.
Net loans charged-off in the fourth quarter of 2006 were $16.1 million or 0.74% (annualized) to average loans, an increase of $7.9 million, when compared to $8.2 million or 0.43% (annualized) to average loans for the same period in 2005. The increase in loans charged-off for the fourth quarter of 2006 when compared to the same quarter in 2005 is mainly attributed to an increase of $7.7 million in Commercial and C&I loans charged-off. Such increase is principally due to partial charge-offs of $7.5 million and $3.0 million on two loans of the Company's asset-based lending division with outstanding principal balances after charge-offs of $44.9 million and $7.3 million, respectively, at December 31, 2006. Both loans are current.
Consumer loan charge-offs in the fourth quarter of 2006 remained relatively unchanged at $4.1 million, when compared to the same quarter in 2005. Such stability is principally attributed to the steadiness of loan charge-offs by the Expresso of Westernbank division, the principal component of the consumer loan charge-offs. Loans charged-off by the Expresso of Westernbank division decreased by $320,000 to $2.5 million for the fourth quarter of 2006, when compared to same quarter in 2005. Management's strategy of stabilizing loan losses and increasing the overall rates charged on the Expresso loan portfolio by continuously reviewing its underwriting policies and increasing the level of collateralized loans, has resulted in lower levels of net charge-offs and a higher yield loan portfolio.
For the year ended December 31, 2006, net loan charge-offs amounted to $30.1 million or 0.36% to average loans, an increase of $11.5 million or 61.37%, when compared to $18.7 million or 0.27% to average loans in 2005. As explained before, the increase in loans charged-off for the year ended December 31, 2006, when compared to the same period in 2005, is mainly attributed to an increase of $14.4 million in Commercial and C&I loans charged-off. Such increase in the Commercial and C&I loans charged-off resulted principally from loans charged-off on the Company's asset based lending division. During the year ended December 31, 2006, the Company partially charged-off three loans of its asset based lending division for an aggregate amount of $15.8 million.
Consumer loan charge-offs for the year ended December 31, 2006, were $12.6 million, an improvement of $1.2 million or 8.93%, when compared to $13.8 million for the same period in 2005. Such improvement is principally attributed to lower charge-offs by the Expresso of Westernbank division, the principal component of the consumer loan charge-offs. Loans charged-off by the Expresso of Westernbank division decreased from $9.8 million for the year ended December 31, 2005, to $8.9 million for the same period in 2006, a decrease of $836,000 or 8.56%. As explained before, this is the result of management's strategy of stabilizing loan losses and increasing the overall rates charged of the Expresso loan portfolio by continuously reviewing its underwriting policies and increasing the level of collateralized loans.
Non-performing loans amounted to $165.8 million or 1.89% of the total loan portfolio at December 31, 2006, an increase of $101.8 million, when compared to $64.0 million or 0.81% (less than 1%) of the total loan portfolio at December 31, 2005. The increase in non-performing loans for the year ended December 31, 2006, when compared to the same period in 2005, is mainly due to an increase of $99.3 million in non-performing loans, mainly attributed to four loans of the Company's asset based lending division, with outstanding principal balances of $44.9 million, $40.5 million, $14.2 million and $7.3 million at December 31, 2006. These loans are current and have not missed their payment schedules but have shortfalls in the collaterals and in the financial condition of the borrowers. These loans required valuation allowances as follows: $11.4 million for the $44.9 million loan, $15.2 million for the $40.5 million loan, $4.7 million for the $14.2 loan and $2.5 million for the $7.3 million loan. During the year ended December 31, 2006, five loans related to one single borrower that were in non-performing status at December 31, 2005, with an aggregate outstanding principal balance of $8.4 million, were collected.
At December 31, 2006, the allowance for possible loan losses was 76.50% of total non-performing loans (reserve coverage). Of the total allowance of $126.8 million, $40.2 million is the Company's specific allowance and the remaining $86.6 million is a general allowance.
Total Loans, Investments and Deposits
Loans receivable-net grew $825.4 million or 10.56%, to $8.64 billion at December 31, 2006, compared to $7.82 billion at December 31, 2005. This increase reflects the Company's emphasis on continued growth in its variable rate loan portfolio mainly through Commercial and C&I and construction loan portfolio. As a result, the commercial real estate mortgage loan portfolio increased from $4.26 billion as of December 31, 2005, to $4.95 billion as of December 31, 2006, an increase of $685.7 million or 16.09%. The commercial, industrial and agricultural loans portfolio increased from $1.01 billion at December 31, 2005, to $1.27 billion at December 31, 2006, up by $261.1 million or 25.78%. The construction loan portfolio increased by $217.0 million or 42.91%, from $505.8 million at December 31, 2005, to $722.8 million as of December 31, 2006. Attached as Exhibit IV is a supplemental unaudited data schedule providing additional information on W Holding's loan portfolio.
W Holding's investment portfolio, excluding short-term money market instruments, stands at $7.03 billion at December 31, 2006, decreasing by $51.1 million in comparison to $7.08 billion at December 31, 2005. In light of the current interest rate scenario, the Company's strategy has shifted to reposition its balance sheet by continuing the emphasis on growing its floating rate loans, while remaining on the sideline on the investment side until new investment opportunities arise. The investment portfolio at December 31, 2006, had an average contractual maturity of 31 months.
The Company's interest rate risk model takes into consideration the callable feature of certain investment securities. Assuming that all call features are exercised, the investment portfolio as of December 31, 2006, had a remaining average maturity of 5 months. Under the present interest rate scenario, no single security may be called. However, no assurance can be given that such levels will be maintained in future periods.
As of December 31, 2006, total deposits reached $9.34 billion, from $8.38 billion at December 31, 2005, an increase of $961.5 million or 11.48%, while federal funds purchased and repurchase agreements increased by $60.5 million, to $6.32 billion at December 31, 2006, from $6.26 billion at December 31, 2005.
New Accounting Pronouncement
In July 2006, the FASB issued FASB Interpretation No. 48, "Accounting for Uncertainty in Income Taxes" ("FIN No. 48"), an interpretation of FASB Statement No. 109, "Accounting for Income Taxes" ("SFAS No. 109"). FIN No. 48 clarifies the accounting for uncertainty in income taxes recognized in a company's financial statements in accordance with SFAS No. 109. FIN No. 48 also prescribes a recognition threshold and measurement attribute for the financial statement recognition and measurement of a tax position taken or expected to be taken in a tax return. Under the new guidance, recognition is based upon the company's determination as whether it is more likely than not that a tax position will be sustained upon examination based upon the technical merits of the position. In evaluating the more-likely-than-not recognition threshold, a company should presume the tax position will be subject to examination by a taxing authority with full knowledge of all relevant information. The Company adopted the interpretation effective January 1, 2007.
We are still in the process of evaluating the cumulative effect of adopting FIN No. 48 on our consolidated results of operations and financial position. Based on management's preliminary evaluation of the Company's tax positions, it is anticipated that the Company will record an increase in liabilities and a corresponding decrease in beginning retained earnings of between $10.0 million to $15.0 million, including interest and penalties. These numbers are preliminary and are subject to the completion of management's evaluation and the Audit Committee's approval.
Forward Looking Statements
This press release may contain some information that constitutes "forward- looking statements." Such information can be identified by the use of forward- looking terminology such as "may," "will," "should," "expect," "anticipate," "estimate," "intend," "continue," or "believe," or the negatives or other variations of these terms or comparable terminology. Forward-looking statements with respect to future financial conditions, results of operations and businesses of the Company are always subject to various risk and market factors out of management's control which could cause future results to differ materially from current management expectations or estimates and as such should be understood. Such factors include particularly, but are not limited to the possibility of prolonged adverse economic conditions or that an adverse interest rate environment could develop. For a discussion of these and other risks and uncertainties, please refer to Item 1A of the Company's Annual Report on Form 10-K for the most recently completed fiscal year. Except as required by applicable securities laws, the Company does not intend, and specifically disclaims any obligation, to update forward-looking statements.
About the Company
Westernbank Puerto Rico, a wholly owned subsidiary of W Holding Company, Inc., is the second-largest commercial bank in Puerto Rico, based on total assets, operating throughout 56 full-fledged branches, including 33 in the southwestern region of Puerto Rico, 7 in the northeastern region, 14 in the San Juan Metropolitan area of Puerto Rico and 2 in the eastern region of Puerto Rico, and a fully functional banking site on the Internet. W Holding Company, Inc. also owns Westernbank Insurance Corp., a general insurance agent placing property, casualty, life and disability insurance, whose results of operations and financial condition are reported on a consolidated basis.
The Company's Senior Management will review W Holding's fourth quarter and year end results via teleconference on Wednesday, January 31, 2007 at 11:30 AM Puerto Rico time (USA times: 10:30 AM Eastern, 9:30 AM Central, 8:30 AM Mountain, or 7:30 AM Pacific time). Please register at https://www.myrcplus.com/rsvp-index.asp?BWebID=&CID=5449261. You will be assigned a Personal Identification Number (PIN) that should be used in order to join the conference. Conference dial-in numbers: Toll Free: 1-866-237-3252 or 1-719-457-1018, if you can't dial in with the toll-free number. Conference passcode: 449261. In case of difficulties accessing the conference call, please contact Mrs. Aileen Rodriguez, Investment Department, at (787) 834-8000 ext. 2300, or .
You may contact Mr. Vixson Frank Baez, with appropriate questions regarding this press release at (787) 834-8000 ext. 5535, or via email at or ; or visit http://www.wholding.com/.
W HOLDING COMPANY, INC. EXHIBIT I
FINANCIAL HIGHLIGHTS
(UNAUDITED)
Three Months Ended Year Ended
December December December December
31, 2006 31, 2005 31, 2006 31, 2005
(Dollars in thousands,
except per share data)
Income Statement Data
Interest income:
Loans, including loan fees $186,311 $137,784 $671,530 $479,042
Investment securities 65,794 63,109 261,971 247,533
Mortgage-backed securities 6,994 7,315 28,489 32,321
Money market instruments 9,191 9,064 38,235 36,433
Total interest income 268,290 217,272 1,000,225 795,329
Interest expense:
Deposits 101,049 72,252 366,063 241,268
Federal funds purchased and
repurchase agreements 80,390 67,677 307,463 234,791
Advances from Federal Home
Loan Bank 1,516 1,997 7,893 7,688
Total interest expense 182,955 141,926 681,419 483,747
Net interest income 85,335 75,346 318,806 311,582
Provision for loan losses 28,000 14,000 64,550 31,000
Net interest income after
provision for loan losses 57,335 61,346 254,256 280,582
Noninterest income:
Service and other charges on
loans 3,376 3,731 12,527 11,577
Service charges on deposit
accounts 2,700 2,334 9,976 8,636
Other fees and commissions 4,116 3,886 15,104 13,182
Net gain (loss) on derivative
instruments 487 (3,276) 632 1,878
Net gain (loss) on sales and
valuation of loans,
securities, and other
assets (590) 133 (1,141) 547
Total noninterest income 10,089 6,808 37,098 35,820
Total net interest income and
noninterest income 67,424 68,154 291,354 316,402
Noninterest expenses:
Salaries and employees'
benefits 14,811 12,608 54,378 46,653
Equipment 3,059 2,502 11,610 9,554
Deposit insurance premium and
supervisory examination 1,011 902 3,770 3,370
Occupancy 2,240 2,030 8,482 7,640
Advertising 2,126 2,416 9,140 9,160
Printing, postage,
stationery, and supplies 819 800 3,654 3,128
Telephone 642 341 2,275 1,853
Net gain from operations of
foreclosed real estate held
for sale (45) (116) (270) (402)
Municipal taxes 1,833 1,276 6,218 4,708
Other 7,551 6,091 25,261 22,566
Total noninterest expenses 34,047 28,850 124,518 108,230
Income before provision for
income taxes 33,377 39,304 166,836 208,172
Provision for income taxes:
Current 18,434 12,982 76,599 52,538
Deferred credit (2,914) (3,847) (10,294) (7,452)
Total provision for income
taxes 15,520 9,135 66,305 45,086
Net income 17,857 30,169 100,531 163,086
Less dividends to preferred
stockholders 9,227 9,229 36,911 36,985
Income available to common
stockholders $8,630 $20,940 $63,620 $126,101
Basic earnings per common share $0.05 $0.13 $0.39 $0.77
Diluted earnings per common
share $0.05 $0.12 $0.38 $0.74
Cash dividends declared on
common stock $7,814 $7,794 $31,235 $30,575
Cash dividends declared per
common share (1) $0.05 $0.05 $0.19 $0.19
Period end number of common
shares outstanding 164,487 164,098 164,487 164,098
Weighted average number of
common shares outstanding 164,487 164,067 164,380 164,024
Weighted average number of
common shares outstanding on a
diluted basis 167,844 168,529 168,051 170,619
(1) Cash dividend amounts in the table are rounded.
W HOLDING COMPANY, INC. EXHIBIT II
FINANCIAL HIGHLIGHTS
(UNAUDITED)
December 31, December 31,
Balance Sheet Data 2006 2005
(In thousands)
At Period End
Cash and due from banks $105,027 $97,612
Money market instruments:
Federal funds sold and resell
agreements 950,573 746,539
Interest-bearing deposits in
banks 21,060 57,116
Investment securities
available for sale, at fair
value 20,541 5,166
Investment securities held
to maturity, at amortized cost 7,007,579 7,074,025
Federal Home Loan Bank stock, at
cost 37,982 42,798
Residential mortgage loans
held for sale, at lower of cost
or fair value 11,379 1,539
Loans-net 8,641,023 7,815,623
Accrued interest receivable 121,360 105,882
Premises and equipment, net 124,648 117,623
Deferred income taxes, net 51,338 41,111
Other assets 62,178 46,830
Total Assets $17,154,688 $16,151,864
Liabilities:
Deposits:
Noninterest-bearing $373,634 $277,099
Interest-bearing and
related accrued
interest payable 8,963,429 8,098,510
Total deposits 9,337,063 8,375,609
Federal fund purchased and
repurchase agreements 6,320,481 6,260,029
Advances from Federal Home Loan
Bank 127,000 172,000
Mortgage note payable 35,968 36,432
Accrued expenses and other
liabilities 106,289 114,316
Total Liabilities 15,926,801 14,958,386
Stockholders' equity 1,227,887 1,193,478
Total Liabilities and
Stockholders' Equity $17,154,688 $16,151,864
Quarterly Averages (1) Year to Date Averages (1)
Average Balances December December December December
31, 2006 31, 2005 31, 2006 31, 2005
(In thousands)
Cash and due from
banks $98,635 $96,598 $101,320 $87,682
Money market
instruments:
Federal funds
sold and resell
agreements 896,145 769,640 848,556 881,921
Interest-bearing
deposits in
banks 18,266 81,365 39,088 53,296
Investment
securities
available for sale 20,770 2,923 12,854 6,523
Investment
securities held
to maturity 7,009,595 7,030,519 7,040,802 6,997,702
Federal Home Loan
Bank stock 40,457 39,049 40,390 47,497
Residential
mortgage loans
held for sale 9,339 1,511 6,459 1,586
Loans-net 8,547,822 7,603,589 8,228,323 6,866,488
Accrued interest
receivable 116,549 101,073 113,621 97,084
Premises and
equipment 123,534 116,140 121,136 113,837
Deferred income
taxes, net 49,904 39,188 46,225 37,386
Other assets 62,269 48,801 54,502 45,741
Total Assets $16,993,285 $15,930,396 $16,653,276 $15,236,743
Liabilities:
Deposits:
Noninterest-
bearing $344,361 $283,014 $325,367 $263,234
Interest-bearing
and related
accrued interest
payable 8,830,724 7,854,856 8,530,970 7,046,656
Total
deposits 9,175,085 8,137,870 8,856,337 7,309,890
Federal fund
purchased and
repurchase
agreements 6,318,024 6,288,398 6,290,255 6,471,778
Advances from
Federal Home Loan
Bank 132,000 172,000 149,500 191,500
Mortgage note payable 36,029 36,488 36,200 36,645
Accrued expenses
and other
liabilities 104,862 108,878 110,301 91,411
Total Liabilities 15,766,000 14,743,634 15,442,593 14,101,224
Stockholders'
equity 1,227,285 1,186,762 1,210,683 1,135,519
Total Liabilities and
Stockholders' Equity $16,993,285 $15,930,396 $16,653,276 $15,236,743
(1) Average balances have been computed using beginning and period-end
balances.
EXHIBIT III a
W HOLDING COMPANY, INC.
YIELDS EARNED AND RATES PAID
THREE MONTHS ENDED,
(UNAUDITED)
December 31,
2006
Annualized
Average Average
Interest Balance(1) Yield/Rate
(Dollars in thousands)
Normal spread:
Interest-earning assets:
Loans, including loan fees (2) $186,311 $8,647,744 8.55 %
Investment securities (3) 65,794 6,468,173 4.04
Mortgage-backed securities (4) 6,994 666,086 4.17
Money market instruments 9,191 793,836 4.59
Total 268,290 16,575,839 6.42
Interest-bearing liabilities:
Deposits 101,049 9,036,841 4.44
Federal funds purchased and
repurchase agreements 80,390 6,320,424 5.05
Advances from FHLB 1,516 106,891 5.63
Total 182,955 15,464,156 4.69
Net interest income $85,335
Interest rate spread 1.73 %
Net interest-earning assets $1,111,683
Net yield on interest-earning
assets (5) 2.04 %
Ratio of interest-earning assets
to interest-bearing liabilities 107.19%
Tax equivalent spread:
Interest-earning assets $268,290 $16,575,839 6.42 %
Tax equivalent adjustment 1,857 -- 0.05
Interest-earning assets -
tax equivalent 270,147 $16,575,839 6.47
Interest-bearing liabilities 182,955 $15,464,156 4.69
Net interest income $87,192
Interest rate spread 1.78 %
Net yield on interest -
earning assets (5) 2.09 %
December 31,
2005
Annualized
Average Average
Interest Balance(1) Yield/Rate
(Dollars in thousands)
Normal spread:
Interest-earning assets:
Loans, including loan fees (2) $137,784 $7,666,231 7.13 %
Investment securities (3) 63,109 6,318,331 3.96
Mortgage-backed securities (4) 7,315 724,768 4.00
Money market instruments 9,064 865,527 4.15
Total 217,272 15,574,857 5.53
Interest-bearing liabilities:
Deposits 72,252 8,070,775 3.55
Federal funds purchased and
repurchase agreements 67,677 6,276,708 4.28
Advances from FHLB 1,997 172,000 4.61
Total 141,926 14,519,483 3.88
Net interest income $75,346
Interest rate spread 1.65 %
Net interest-earning assets $1,055,374
Net yield on interest-earning
assets (5) 1.92 %
Ratio of interest-earning assets
to interest-bearing liabilities 107.27%
Tax equivalent spread:
Interest-earning assets $217,272 $15,574,857 5.53 %
Tax equivalent adjustment 7,176 -- 0.19
Interest-earning assets -
tax equivalent 224,448 $15,574,857 5.72
Interest-bearing liabilities 141,926 $14,519,483 3.88
Net interest income $82,522
Interest rate spread 1.84 %
Net yield on interest -
earning assets (5) 2.10 %
September 30,
2006
Annualized
Average Average
Interest Balance(1) Yield/Rate
(Dollars in thousands)
Normal spread:
Interest-earning assets:
Loans, including loan fees (2) $175,042 $8,414,071 8.25 %
Investment securities (3) 65,562 6,449,169 4.03
Mortgage-backed securities (4) 7,036 675,437 4.13
Money market instruments 10,409 890,212 4.64
Total 258,049 16,428,889 6.23
Interest-bearing liabilities:
Deposits 96,693 8,856,606 4.33
Federal funds purchased and
repurchase agreements 80,184 6,312,742 5.04
Advances from FHLB 2,169 154,174 5.58
Total 179,046 15,323,522 4.64
Net interest income $79,003
Interest rate spread 1.59 %
Net interest-earning assets $1,105,367
Net yield on interest-earning
assets (5) 1.91 %
Ratio of interest-earning assets
to interest-bearing liabilities 107.21%
Tax equivalent spread:
Interest-earning assets $258,049 $16,428,889 6.23 %
Tax equivalent adjustment 3,487 -- 0.09
Interest-earning assets -
tax equivalent 261,536 $16,428,889 6.32
Interest-bearing liabilities 179,046 $15,323,522 4.64
Net interest income $82,490
Interest rate spread 1.68 %
Net yield on interest -
earning assets (5) 1.99 %
(1) Average balance on interest-earning assets and interest-bearing
liabilities is computed using daily monthly average balances during
the period.
(2) Average loans exclude non-performing loans. Loans fees, net amounted
to $4.4 million, $2.4 million, and $4.7 million for the three-month
periods ended December 31, 2006 and 2005 and September 30, 2006,
respectively.
(3) Includes available for sale securities.
(4) Includes trading and available for sale securities.
(5) Annualized net interest income divided by average interest-earning
assets.
W HOLDING COMPANY, INC.
YIELDS EARNED AND RATES PAID
YEARS ENDED DECEMBER 31,
(UNAUDITED)
2006
Annualized
Average Average
Interest Balance(1) Yield/
Rate
(Dollars in thousands)
Normal spread:
Interest-earning assets:
Loans, including loan fees (2) $671,530 $8,308,353 8.08%
Investment securities (3) 261,971 6,519,398 4.02
Mortgage-backed securities (4) 28,489 632,792 4.50
Money market instruments 38,235 845,375 4.52
Total 1,000,225 16,305,918 6.13
Interest-bearing liabilities:
Deposits 366,063 8,771,531 4.17
Federal funds purchased and
repurchase agreements 307,463 6,290,818 4.89
Advances from FHLB 7,893 147,780 5.34
Total 681,419 15,210,129 4.48
Net interest income $318,806
Interest rate spread 1.65%
Net interest-earning assets $1,095,789
Net yield on interest-earning
assets (5) 1.96%
Ratio of interest-earning assets
to interest-bearing liabilities 107.20%
Tax equivalent spread:
Interest-earning assets $1,000,225 $16,305,918 6.13%
Tax equivalent adjustment 16,502 -- 0.11
Interest-earning assets -
tax equivalent 1,016,727 $16,305,918 6.24
Interest-bearing liabilities 681,419 $15,210,129 4.48
Net interest income $335,308
Interest rate spread 1.76%
Net yield on interest -
earning assets (5) 2.06%
2005
Annualized
Average Average
Interest Balance(1) Yield/
Rate
(Dollars in thousands)
Normal spread:
Interest-earning assets:
Loans, including loan fees (2) $479,042 $6,986,626 6.86%
Investment securities (3) 247,533 6,267,159 3.95
Mortgage-backed securities (4) 32,321 752,839 4.29
Money market instruments 36,433 950,980 3.83
Total 795,329 14,957,604 5.32
Interest-bearing liabilities:
Deposits 241,268 7,376,605 3.27
Federal funds purchased and
repurchase agreements 234,791 6,398,451 3.67
Advances from FHLB 7,688 184,153 4.17
Total 483,747 13,959,209 3.47
Net interest income $311,582
Interest rate spread 1.85%
Net interest-earning assets $998,395
Net yield on interest-earning
assets (5) 2.08%
Ratio of interest-earning assets
to interest-bearing liabilities 107.15%
Tax equivalent spread:
Interest-earning assets $795,329 $14,957,604 5.32%
Tax equivalent adjustment 41,305 -- 0.27
Interest-earning assets -
tax equivalent 836,634 $14,957,604 5.59
Interest-bearing liabilities 483,747 $13,959,209 3.47
Net interest income $352,887
Interest rate spread 2.12%
Net yield on interest -
earning assets (5) 2.36%
(1) Average balance on interest-earning assets and interest-bearing
liabilities is computed using daily monthly average balances during the
period.
(2) Average loans exclude non-performing loans. Loans fees, net amounted
to $16.3 million for the years ended December 31, 2006 and 2005,
respectively.
(3) Includes available for sale securities.
(4) Includes trading and available for sale securities.
(5) Annualized net interest income divided by average interest-earning
assets.
EXHIBIT
W HOLDING COMPANY, INC. III c
CHANGES IN YIELDS EARNED AND RATES PAID
(UNAUDITED)
Three Months Ended December 31,
2006 vs. 2005
Volume Rate Total
(In thousands)
Interest income:
Loans $19,014 $29,513 $48,527
Investment securities (1) 1,512 1,173 2,685
Mortgage-backed securities (2) (640) 319 (321)
Money market instruments (786) 913 127
Total increase in interest income 19,100 31,918 51,018
Interest expense:
Deposits 9,348 19,449 28,797
Federal funds purchased and
repurchase agreements 475 12,238 12,713
Advances from FHLB (1,160) 679 (481)
Total increase in interest expense 8,663 32,366 41,029
Increase (decrease) in
net interest income $10,437 $(448) $9,989
Year Ended December 31,
2006 vs. 2005
Volume Rate Total
(in thousands)
Interest income:
Loans $98,956 $93,532 $192,488
Investment securities (1) 10,084 4,354 14,438
Mortgage-backed securities (2) (5,515) 1,683 (3,832)
Money market instruments (4,324) 6,126 1,802
Total increase in interest income 99,201 105,695 204,896
Interest expense:
Deposits 50,744 74,051 124,795
Federal funds purchased and
repurchase agreements (3,880) 76,552 72,672
Advances from FHLB (495) 700 205
Total increase in interest expense 46,369 151,303 197,672
Increase (decrease) in
net interest income $52,832 $(45,608) $7,224
(1) Includes available for sale securities.
(2) Includes trading and available for sale securities.
W HOLDING COMPANY, INC. EXHIBIT IV
LOAN RECEIVABLE-NET
(UNAUDITED)
December December
By Collateral Type 31, 2006 31, 2005
(In thousands)
Commercial real estate mortgage (1) $4,945,932 $4,260,258
Residential real estate - mortgage
(2) 1,014,957 1,298,535
Construction - mortgage 722,789 505,760
Commercial, industrial and
agricultural (1) 1,274,236 1,013,092
Consumer and others (3) (4) 809,953 830,384
Total Loans 8,767,867 7,908,029
Allowance for loan losses (126,844) (92,406)
Loans - net $8,641,023 $7,815,623
(1) Includes $1.46 billion and $1.26 billion of Westernbank Business
Credit division outstanding loans at December 31, 2006 and 2005,
respectively.
(2) Includes fixed and floating interest rate loans to two mortgage
originator groups in Puerto Rico mainly secured by mortgages on one-to-
four family residential properties with an outstanding principal
balance of $940.0 million and $1.14 billion at December 31, 2006 and
2005, respectively.
(3) Includes $129.0 million and $135.0 million of Expresso of Westernbank
division outstanding loans at December 31, 2006 and 2005, respectively.
(4) Includes $490.7 million and $585.9 million collateralized by real
estate at December 31, 2006 and 2005, respectively.
W HOLDING COMPANY, INC. EXHIBIT V
NON-PERFORMING LOANS AND FORECLOSED
REAL ESTATE HELD FOR SALE
(UNAUDITED)
December December
31, 2006 31, 2005
(Dollars in thousands)
Commercial real estate - mortgages
and commercial,
industrial and agricultural loans $154,862 $55,585
Residential real estate mortgage and
construction loans 1,641 2,125
Consumer loans 9,309 6,288
Total non-performing loans 165,812 63,998
Foreclosed real estate held for sale 5,917 4,137
Total non-performing loans and
foreclosed real estate held for sale $171,729 $68,135
Interest that would have been
recorded if the loans had not
been classified as non-performing $9,052 $4,916
Interest recorded on non-performing
loans $4,785 $743
Total non-performing loans as a
percentage of total loans
at end of period 1.89% 0.81%
Total non-performing loans and
foreclosed real estate
held for sale as a percentage of
total assets at end of period 1.00% 0.42%
W HOLDING COMPANY, INC. EXHIBIT VI
CHANGES IN ALLOWANCE FOR LOAN LOSSES
(UNAUDITED)
December December
31, 2006 31, 2005
(Dollars in thousands)
Balance, beginning of year $92,406 $80,066
Loans charged-off:
Commercial real estate - mortgage and
commercial, industrial and
agricultural loans (1) (22,606) (8,233)
Residential real estate-mortgage and
construction loans (94) (121)
Consumer loans (2) (12,576) (13,809)
Total loans charged-off (35,276) (22,163)
Recoveries of loans previously
charged-off:
Commercial real estate - mortgage and
commercial, industrial and
agricultural loans 2,846 1,008
Residential real estate-mortgage and
construction loans 66 212
Consumer loans (3) 2,252 2,283
Total recoveries of loans previously
charged-off 5,164 3,503
Net loans charged-off (30,112) (18,660)
Provision for loan losses 64,550 31,000
Balance, end of period $126,844 $92,406
Ratios:
Allowance for loan losses to total
loans at end of period 1.45% 1.17%
Provision for loan losses to net
loans charged-off 214.37% 166.13%
Recoveries of loans to loans charged-
off in previous period 23.30% 15.78%
Net loans charged-off to average
total loans (4) 0.36% 0.27%
Allowance for loan losses to non-
performing loans 76.50% 144.39%
(1) Includes charge-offs of $15.8 million and $5.3 million of Westernbank
Business Credit Division for the years ended December 31, 2006 and 2005,
respectively.
(2) Includes $8.9 million and $9.8 million of Expresso of Westernbank
loans charged-offs for the years ended December 31, 2006 and 2005,
respectively.
(3) Includes $1.0 and $1.1 million of Expresso of Westernbank loans
recoveries for the years ended December 31, 2006 and 2005, respectively.
(4) Average loans were computed using beginning and period-end balances.
W HOLDING COMPANY, INC. EXHIBIT VII
SELECTED FINANCIAL RATIOS
(UNAUDITED)
At and for the At and for the
Three Months Ended Years Ended
December 31, December 31,
2006 2005 2006 2005
(Amounts in thousands, except per share data)
Per share data:
Dividend payout ratio 90.54% 37.22% 49.10% 24.25%
Book value per common
share $4.24 $4.04 $4.24 $4.04
Preferred stock
outstanding at end of
period 18,157 18,160 18,157 18,160
Preferred stock equity
at end of period $530,838 $530,926 $530,838 $530,926
Performance ratios:
Return on assets (1) 0.42% 0.76% 0.60% 1.07%
Return on common
stockholders' equity
(1) 4.96% 12.77% 9.36% 20.53%
Efficiency ratio 35.64% 33.43% 34.94% 30.67%
Operating expenses to
total end-of-period
assets 0.79% 0.71% 0.73% 0.67%
Capital ratios:
Total capital to risk-
weighted assets 12.49% 13.13% 12.49% 13.13%
Tier I capital to risk-
weighted assets 11.45% 12.30% 11.45% 12.30%
Tier I capital to
average assets 7.21% 7.48% 7.21% 7.48%
Equity-to-assets ratio
(1) 7.22% 7.45% 7.27% 7.45%
Other selected data:
Total trust assets managed $542,733 $486,017 $542,733 $486,017
Branch offices 56 55 56 55
Number of full-time
employees 1,363 1,311 1,363 1,311
(1) The return on assets is computed by dividing annualized net income by
average total assets for the period.
The return on common stockholders' equity is computed by dividing
annualized net income less preferred stock dividends by average common
stockholders' equity for the period. The equity-to-asset ratio is computed
by dividing average equity by average total assets. Average balances have
been computed using beginning and period-end balances.
https://www.myrcplus.com/rsvp-index.asp?BWebID=&CID=5449261DATASOURCE: W Holding Company, Inc.
CONTACT: Vixson Frank Baez, W Holding Company, +1-787-834-8000, ext.
5535, or , or
Web site: http://www.wbpr.com/