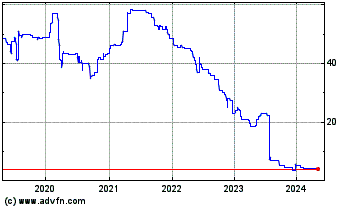
W.h. Ireland (LSE:WHI)
Historical Stock Chart
From Dec 2019 to Dec 2024
MAYAGUEZ, Puerto Rico, Oct. 21 /PRNewswire-FirstCall/ -- W HOLDING COMPANY, INC. (NYSE: "WHI"), the financial holding company of WESTERNBANK PUERTO RICO and WESTERNBANK INSURANCE CORP., today reported its financial position and results of operations for the three and nine month periods ended September 30, 2005. Following are some financial highlights:
THIRD QUARTER HIGHLIGHTS:
-- Net income for the third quarter ended September 30, 2005 was $40.0
million or $0.19 earnings per basic common share ($0.18 on a diluted
basis), compared to $44.2 million or $0.23 earnings per basic common
share ($0.22 on a diluted basis) for the same quarter in 2004, a
reduction of $4.2 million or 9.55%. Earnings per common share for
2004 were adjusted to give effect to the three-for-two (3x2) stock
split and a two percent (2%) stock dividend declared in December 2004
and both distributed on January 10, 2005.
-- However, for the nine months ended September 30, 2005, W Holding
reported a net income of $134.4 million or $0.65 earnings per basic
common share ($0.63 on a diluted basis). This is an increase of $8.6
million or 6.85%, when compared to a net income of $125.8 million or
$0.65 earnings per basic common share ($0.62 on a diluted basis) (as
adjusted) for the same period in 2004.
-- Loans receivable-net, grew by $1.5 billion or a healthy 24.61%, from
$5.9 billion at December 31, 2004. This is a net growth of more than
115% in just 9 months of the net growth achieved during the full year
2004.
-- Net interest income for the third quarter ended September 30, 2005
was $80.7 million, an increase of $3.6 million or 4.71%, from $77.0
million for the same period of last year.
-- The increase of $3.6 million in net interest income and a $4.4
million lower provision for loan losses was offset by a significant
increase in the provision for income taxes of $10.0 million, when
compared to the prior year quarter.
-- Commercial real estate loans increased by $710.3 million or 22.51%,
from $3.2 billion as of December 31, 2004, to $3.9 billion as of
September 30, 2005.
-- W Holding's combined delinquency on all portfolios for the categories
of 60 days and over improved 8 basis points to 0.74% at September 30,
2005, below our benchmark of 1%, compared to 0.82% at September 30,
2004.
-- The delinquency ratio on the commercial loan portfolio for the
categories of 60 days and over, was 0.80% (less than 1%), compared to
0.75% reported for the year ago period.
-- The delinquency ratio on the consumer loan portfolio, including the
Expresso of Westernbank loan portfolio, for the categories of 60 days
and over improved by 9 basis points, to 1.53% at September 30, 2005,
from 1.62% for the comparable period last year.
-- Net loans charged-off in the third quarter of 2005 were $3.8 million
or 0.21% (annualized) to average loans, a significant improvement
when compared to $6.2 million or 0.44% (annualized) to average loans
for the same period in 2004, a decrease of $2.4 million or 37.95%.
-- Non-performing loans stand at $51.7 million or 0.69% (less than 1%)
of Westernbank's loan portfolio at September 30, 2005.
-- Stockholders' equity increased by $103.9 million or 9.61%, to $1.2
billion as of September 30, 2005, compared to December 31, 2004.
-- Margin pressures continued as a result of the flattening of the yield
curve, while short-term rates continued to rise during the quarter.
On a linked quarter basis, our net interest margin decreased 10 basis
points. On a year to year basis, our net interest margin decreased 28
basis points, from 2.40% in the third quarter of 2004, to 2.12% for
the third quarter of 2005.
-- At September 30, 2005, total assets stand at $15.7 billion, an
increase of $1.4 billion or 9.59% when compared to December 31, 2004.
Commenting on the financial results of the Company for the quarter and the nine months ended September 30, 2005, Mr. Frank C. Stipes, Esq., Chairman of the Board and Chief Executive Officer of W Holding Company, Inc., stated to be extremely satisfied with the overall performance and results of the Company year to date and this third quarter of 2005: "The Company is increasing its lead in the commercial sector, specifically in the new regions where it has branches, where it has become the most important and significant lender with a growth of 34% and total net loans of 30% as compared to the equivalent for 2004."
Mr. Freddy Maldonado, President and Chief Investments Officer of W Holding Company stated: "We continue actively managing our interest rate risk in light of the continued rising interest rate scenario. Even though our margins contracted by 10 basis points on a linked quarter basis, this was anticipated and within our previously informed range due to the continued flattening of the yield curve, while short-term rates continued to rise during the quarter. We will continue to manage and adjust our asset/liability mix accordingly to operate under this challenging environment without placing ourselves in a position that we cannot react to the ever changing conditions of the market."
Mr. Ricardo Hernandez, Chief Financial Officer, commented: "As previously highlighted, our bottom line results for the quarter include a significantly higher current provision for income taxes compared to prior periods. Our effective income tax rate rose to 28% for the quarter compared to just 11% for the prior year quarter or almost $10 million more when compared to the prior year period. This is the combined effect of the recently enacted additional 2.5% transitional two-year surtax on taxable income that hit our operations by $2.5 million in additional taxes, of which $1.6 million is the retroactive effect for the first six months, coupled with the increase in the effective income tax rate as a result of our current strategy of growing the loan portfolio through variable rate loans, while remaining on the sideline on our investments side resulting in a higher proportion of taxable to exempt income."
Also, commenting on the financial results of the Company for the quarter and the nine months ended September 30, 2005, Mr. Jose M. Biaggi, Esq., who recently joined the Company as President and Chief Executive Officer of Westernbank Puerto Rico added: "Our results of operations and growth for the quarter and nine month periods are within our expectations considering the tough interest rate environment that we are operating in. What is truly important to comprehend is that our earnings come from pure, core operational results. They are a direct consequence of our spread, net interest income and banking-related activities and in no way dependent or pumped up by non- recurring gains or profits produced by sales of loans, assets or securities."
"Our net interest margin, although it further compressed during the quarter, came out on the high end of our projection. At the end of the previous quarter we projected that under a flat interest rate scenario our net interest margin would fluctuate within a range of 2.06% to 2.14%. Further, under a 100 basis point rise our projection indicated that our net interest margin would fluctuate within a range of 1.89% to 2.08%. Even though the Fed rose twice the discount rate by 25 basis points at each meeting during this quarter, our net interest margin came out at 2.12%, on the high side of our projected range."
"The asset-liability scenario has been proactively managed by Mr. Freddy Maldonado. Since the beginning of the year 2004, he has been able to effectively control the funding costs of the Bank by limiting the repricing of the interest bearing liabilities to 115 basis points or 41.82% of the 275 basis points rise in Fed Funds or 39.38% of the 292 basis points rise in the three-month LIBOR for the same period. Specifically, total deposits (core and non-core) have repriced 94 basis points or 34.18% and 32.19%, respectively, of the increases in Fed Funds and LIBOR rates, while repurchase agreements have repriced 145 basis points or 52.73% and 49.66%, again respectively of said increases."
"Our new management structure will continue to allow us to focus on aggressively growing our loan portfolio while maintaining our excellent client service and accessibility that characterizes and sets us apart from the other players in the market. As I was already familiar with the operations and clients of the Bank, I have dedicated very little time to my transition and all my efforts are and will continue to be focused on building our loan portfolio and strengthening our client relations. We grew our loan portfolio by almost $300 million net during the quarter and by almost $1.5 billion net in just nine months since the beginning of this year 2005. We have already surpassed our year end projection in regards to the growth of our loan portfolio and we feel very optimistic in sustaining our growth throughout the remaining period and for the future, an accomplishment which, as always, is accompanied by the lowest delinquency levels in the industry, and at the same time generated with the highest efficiency ratio."
Mr. Biaggi concluded by saying: "This Company has a tradition of focusing in long term value and solid core growth, rather than tailoring its operations towards short term speculation; a tradition that time and our results have proven correct, and that I intend to maintain."
Overview
W Holding reported net income for the third quarter 2005 of $40.0 million or $0.19 earnings per basic common share ($0.18 on a diluted basis), compared to $44.2 million or $0.23 earnings per basic common share ($0.22 on a diluted basis) (as adjusted) for the same quarter in 2004, a decrease of $4.2 million or 9.55%.
For the nine months ended September 30, 2005, W Holding reported a net income of $134.4 million or $0.65 earnings per basic common share ($0.63 on a diluted basis). This is an increase of $8.6 million or 6.85%, when compared to a net income of $125.8 million or $0.65 earnings per basic common share ($0.62 on a diluted basis) (as adjusted) for the same period in 2004.
The return on assets (ROA) and the return on common stockholders' equity (ROCE) for the quarter ended September 30, 2005, were 1.03% and 19.15%, respectively, compared to 1.33% and 28.81% reported for the same quarter in 2004. For the nine months ended September 30, 2005, the ROA and the ROCE were 1.19% and 23.22%, respectively, compared to 1.34% and 28.67%, for the same period in prior year.
At September 30, 2005, driven by strong increases in W Holding's loan portfolio, total assets ended at $15.7 billion. Total assets grew $1.4 billion or 9.59%, from $14.3 billion at December 31, 2004, driven by the growth in the loan portfolio, partially offset by decreases in short-term money market instruments. Continuing management's strategy implemented in the latter part of 2004 and throughout the year 2005, in light of the current rising interest rate scenario and the flattening of the yield curve, the Company has continued to emphasize the growth of its loan portfolio, principally through variable rate loans, while remaining on the sideline on the investment side until investment opportunities arise.
Loans receivable-net, grew by $1.5 billion or 24.61%, from $5.9 billion at December 31, 2004, as a result of the Company's continued strategy of growing its loan portfolio through commercial real estate, residential real estate, construction and land acquisition, asset-based and other commercial loans. The investment portfolio, excluding short-term money market instruments, increased slightly by $58.4 million or 0.84%, to reach $7.0 billion at September 30, 2005, while short-term money market instruments decreased $168.4 million or 15.79%, from $1.1 billion at December 31, 2004, to $898.4 million at September 30, 2005. Changes in both portfolios are attributable to approximately $150.0 million previously invested in money market instruments that were reinvested during the quarter into $150.0 million on tax exempt securities, specifically U.S. Government and agencies obligations on a short-term basis, as part of the management strategy of growing W Holding exempt interest income. The Company has continued to shift and reposition its balance sheet by placing emphasis on growing its floating rate loans, so as to lessen the impact of contracting margins on the investment side.
On a year-to-year basis, total assets grew $2.2 billion or 16.56%, from $13.5 billion at September 30, 2004, principally from the growth in the Company's loan portfolio. Loans receivable-net, grew by $1.7 billion or 29.50%, from $5.7 billion as of September 30, 2004, while the investment portfolio, excluding short-term money market instruments, increased $362.4 million or 5.47%, from $6.6 billion at September 30, 2004.
Stockholders' equity increased by $103.9 million or 9.61%, to $1.2 billion as of September 30, 2005, compared to December 31, 2004. Such increase resulted principally from the combination of the issuance of 401,300 shares of the Company's Series H Preferred Stock completed on January 3, 2005, providing a net capital infusion of $19.4 million, plus the net income of $134.4 million generated during the nine months ended September 30, 2005. This was partially offset by dividends paid during 2005 of $22.8 million and $27.8 million on our common and preferred shares, respectively.
The period-end number of common shares outstanding increased from 163,918,835 as of December 31, 2004, to 164,066,058 as of September 30, 2005, as a result of the conversion of 32,092 shares of the Company's convertible preferred stock Series A, into 112,110 shares of the Company's common stock, and the issuance of 35,113 common shares from the exercise of stock options.
Net Interest Income
Net interest income for the third quarter ended September 30, 2005 was $80.7 million, an increase of $3.6 million or 4.71%, from $77.0 million for the same period of last year. This increase mainly resulted from an increase in the average net interest-earning assets of $246.7 million, which contributed a $19.6 million positive volume variance, partially offset by a $16.0 million negative rate variance. Average interest-earning assets for the third quarter of 2005 increased by $2.4 billion or 18.68%, compared to the same quarter in previous year. The average loan portfolio increased by $1.7 billion or 29.85%, particularly in the commercial real estate, commercial business and other loans, including asset-based, and residential real estate. The average investment portfolio, excluding short-term money market instruments, increased by $534.5 million or 8.19%, primarily in tax-exempt securities, such as U.S. Government and agencies obligations bought during the fourth quarter of 2004, as explained before. Average money market instruments increased by $184.6 million or 28.34%.
For the nine months ended September 30, 2005, net interest income increased from $222.8 million, to $243.9 million, an increase of $21.1 million or 9.47%. This increase mainly resulted from an increase in the average net interest-earning assets of $267.2 million, which contributed a $56.0 million positive volume variance, partially offset by a $34.9 million negative rate variance. Average interest-earning assets increased by $2.7 billion or 22.04%. The average loan portfolio increased by $1.5 billion or 29.02%, particularly in the commercial real estate, commercial business and other loans, including asset-based, and residential real estate. The average investment portfolio, excluding short-term money market instruments, increased by $885.3 million or 14.35%, primarily in tax exempt securities, such as U.S. Government and agencies obligations as a result of the securities bought during the latter part of 2004, as explained before. Average money market instruments increased by $258.7 million or 38.01%.
The average yield earned in interest-earning assets increased 66 basis points from 4.73% to 5.39%, and 52 basis points from 4.72% to 5.24%, for the quarter and nine months ended September 30, 2005, respectively, when compared to periods in prior year. The increase in the average yield was mainly due to higher average yields earned on the loan portfolio, mortgage-backed securities and money market instruments, while the investment portfolio yield remained relatively flat. The increase in the average yield earned on the loan portfolio was due to higher volumes of commercial real estate loans, residential real estate and commercial business and other loans at floating rates, coupled with the repricing of floating rate loans.
During the last three months of 2004 and the nine months ended September 30, 2005, the Federal Reserve has increased the discount rate by an additional 200 basis points reflected equally on the Prime Rate, an index used by the Bank to re-price most of its floating rate loans. At September 30, 2005, approximately 80% of the loan portfolio carries a floating rate.
For the quarter ended September 30, 2005, our overall cost of rates paid increased 103 basis points, from 2.47% to 3.50%, when compared to the prior year quarter. The increase in the overall cost of rates paid was due to a general increase in the cost of funding sources of W Holding. The average interest rate paid on deposits increased by 83 basis points, from 2.42% for the quarter ended September 30, 2004, to 3.25% for the same period in 2005, while the average interest rate paid on federal funds purchased and repurchase agreements also increased by 131 basis points, from 2.48% for the quarter ended September 30, 2004, to 3.79% for the same period in 2005. The average interest rate paid on Advances from FHLB increased by 57 basis points, from 3.74% for the quarter ended September 30, 2004, to 4.31% for the same period in 2005.
For the nine months ended September 30, 2005, the overall cost of rates paid increased 84 basis points, from 2.40% for the nine months ended September 30, 2004, to 3.24% for the same period in 2005. The average interest rate paid on deposits increased 66 basis points, from 2.36% for the nine month ended September 20, 2004, to 3.02% for the same period in 2005, while, the average interest rates paid on federal funds purchased and repurchase agreements increased 108 basis points, from 2.39% for the nine months ended September 30, 2004, to 3.47% for the nine months ended September 30, 2005. Such increases were partially offset by a decrease in the average interest rate paid on advances from the Federal Home Loan Bank of 12 basis points, from 4.16% for the nine months ended September 30, 2004, to 4.04% for the nine months ended September 30, 2005.
As explained in the preceding paragraphs, during the last three months of 2004 and first nine months of 2005, short-term interest rates continued rising with the libor rate, the rate used by the Company to reprice most of the Company's liabilities, increasing 209 basis points from September 30, 2004. This pattern was reflected in the cost of the Bank's liabilities as explained herein. However, in light of the current rising interest rate scenario, the Bank has continued to extend a portion of its liabilities to lock-in the rates for a period of three years.
The strong growth in average interest-earning assets between both periods was in part offset by increases in the average interest-bearing liabilities of $2.1 billion or 17.81%, and $2.4 billion or 21.07%, for the quarter and nine months ended September 30, 2005, respectively. Deposits grew on average by $1.6 billion and $1.4 billion, during the quarter and nine months ended September 30, 2005, respectively, while other borrowings (federal funds purchased, repurchase agreements and advances from FHLB) in average rose by $571.2 million and $1.0 billion for the same periods, respectively.
Net Interest Margin
Our net interest margin decreased 28 basis points during the third quarter of 2005 to 2.12%, from 2.40% in the third quarter of 2004. For the nine months ended September 30, 2005, our net interest margin decreased 25 basis points. On a linked quarterly comparison, our net interest margin decreased by ten basis point, from 2.22% for the second quarter of 2005. The decrease in our net interest margin obeyed to an increase in the general cost of funding of W Holding, at a faster pace than the increase in our yield on interest earning assets. This contraction is primarily due to the flattening of the yield curve, whereby the 10-year U.S. Treasury yield remained relatively flat, while the short end of the curve increased.
Under a flat interest rate scenario for the next twelve month period, based on our asset and liability composition as of September 30, 2005, we estimate our net interest margin will be within a range of 1.89% to 1.98% during said period. Assuming an instantaneous 100 basis points decrease in the fed funds rate, we estimate our net interest margin will fluctuate within a range of 2.05% to 2.13% during said period. Assuming a 100 basis points increase in the fed funds rate, we estimate our net interest margin will fluctuate within a range of 1.72% to 1.90%. Furthermore, a 200 basis points increase in the fed funds rate will cause our net interest margin to fluctuate between a range of 1.57% to 1.86%. The lower and higher values of such range mean the lowest and highest net interest margin for any given quarter within the said twelve month period. These ranges are management's estimates based on instantaneous rate shocks of 100 and 200 basis points with results one year (twelve months) forward. They do not consider any asset/liability management strategy that could be undertaken given such interest rate changes during said one year period, such as those already implemented during late 2004 and in 2005 in order to lessen the sensitivity and projected impact of a continued rising interest rate environment.
Attached as Exhibits IIIa, IIIb and IIIc are supplemental unaudited data schedules providing additional information on the net interest margin including average balances and average rates for both, interest-earning assets and interest-bearing liabilities, as well as changes in volumes and rates for the periods presented.
Noninterest Income
Noninterest income decreased $66,000 or 0.79% for the three month period ended September 30, 2005, when compared to the same period in 2004. This decrease was mainly the result of a decrease of $494,000 on net gain on sales and valuation of loans, securities, and other assets, due to a realized gain of $525,000 of an investment security during the third quarter of 2004, and a negative variance of $437,000 in loss on derivative instruments as a result of fluctuations in the mark to market of such positions. These decreases were partially offset by an increase of $865,000 or 11.49% in service and other charges on loans, deposits and other fees and commissions due to higher activity and fees resulting from the Company's overall growing volume of business and other fees generated by our asset-based lending operation.
For the nine month period ended September 30, 2005, noninterest income increased $1.4 million or 6.50%, when compared to the same period in 2004. This increase was mainly the result of an increase of $2.0 million or 9.52% in service and other charges on loans, deposits and other fees and commissions. Such increase was partially offset by a decrease of $453,000 on net gain on sales and valuation of loans securities, and others assets for the reason explained in the preceding paragraph and a negative variance of $136,000 on gain (loss) on derivates instruments.
Noninterest Expenses
Total noninterest expenses increased $2.3 million or 8.99% for the three-month period ended September 30, 2005, and $5.2 million or 6.99% for the nine months ended September 30, 2005, when compared to the corresponding periods in 2004. Salaries and employees' benefits, which is the largest component of total noninterest expenses, increased $2.2 million or 22.32% for the third quarter of year 2005, and $6.2 million or 22.26% for the nine months ended September 30, 2005, compared to the corresponding periods in 2004. Such increases are attributed to the increases in personnel, normal salary increases and related employees' benefits, principally attributed to our continued expansion in the San Juan Metropolitan area and our entrance to the east coast of Puerto Rico. On October 22, 2004 we opened our flagship mega branch in Old San Juan, and on March 16, 2005, we opened our new state of the art mega branch in Humacao. At September 30, 2005, the Company had 1,266 full-time employees, including its executive officers, an increase of 125 employees or 10.95% since September 30, 2004.
Advertising expense decreased by $1.1 million or 36.49% for the three months ended September 30, 2005, and $2.2 million or 24.19% for the nine months ended September 30, 2005, when compared to the same periods in 2004, as the Company concluded its radio, newspaper and television campaign promoting Westernbank's institutional image and positioning the Company for its strategy in the San Juan Metropolitan area that was in effect during most of the year 2004.
Noninterest expenses, other than salaries and employees' benefits, and advertising discussed above, increased by $1.2 million or 9.68% for the third quarter of 2005, and by $1.1 million or 3.04% for the nine months ended September 30, 2005, as a result of the Company's continued expansion in the San Juan Metropolitan area and our entrance to the east coast of Puerto Rico.
The Company has maintained operating expenses at adequate levels, and achieved an efficiency ratio of 29.69% for the nine months ended September 30, 2005 and 30.97% for the third quarter of year 2005, compared to 30.38% and 29.92% for the same periods of 2004, respectively.
Provision for Income Taxes
The current provision for Puerto Rico income taxes for the nine months ended September 30, 2005, amounted to $39.6 million, significantly higher when compared to $19.9 million in the same period of 2004. The increase in the current provision for income taxes is attributed to two factors. First, on August 1, 2005, the Governor of Puerto Rico signed Law No. 41 which imposes a transitory additional surtax of 2.5% over net taxable income. This transitory additional tax will be in effect for taxable years 2005 and 2006 and had a retroactive effect to January 1, 2005. Accordingly, the Company recorded an additional current income tax provision of $2.5 million during the quarter ended September 30, 2005, of which $1.6 million corresponds to the retroactive effect of this bill for the first six months of year 2005. Second, the increase in the income before the provision for income taxes was primarily due to the significant increase in the Company's taxable income derived from increases in the loans portfolio; changing the proportion between exempt and taxable income, increasing the Company's effective tax rate.
The decrease of $2.2 million in the deferred credit for the nine months ended September 30, 2005, when compared to the prior year period, is attributable to temporary differences in the recognition of certain items for tax and books, principally changes in the allowance for loan losses. Even though the Company's effective tax rate increased, it continues to be substantially below the statutory rate.
Early in August 2005, the Governor of Puerto Rico resubmitted to the Puerto Rico Legislature a draft of a bill to impose an additional transitory income tax of 4% on net interest income, as defined, applicable to Puerto Rico financial institutions. This transitory additional tax, if approved, is expected to be also in effect for two years. The proposal excludes from the definition of net interest income, exempt interest earned from obligations of the United States, of any state or territory of the United States or political subdivision, the District of Columbia, the Commonwealth of Puerto Rico or any instrumentality or political subdivision; including all interest expense allocable to exempt income. There is no assurance that this proposal will not be approved or significant changes made before it is signed into law. The final impact of this proposal will depend on the final bill, if approved, and the actual distribution of taxable and exempt income in each applicable year.
Asset Quality
W Holding's asset quality continues to be very strong as evidenced by our key asset quality performance indicators in spite of the Company's continued aggressive loan portfolio growth. Net loans charged-offs to average loans, improved over the prior year comparable quarter and remain very in line with our year end performance even thought seasonal factors usually result in intra-year fluctuations in our delinquency ratios. W Holding is essentially a secured lender having 83% of its loan portfolio as of September 30, 2005 secured by real estate. Our combined delinquency on all portfolios for the categories of 60 days and over continues to be below our benchmark of 1% for both periods. This combined delinquency was 0.74% at September 30, 2005, an improvement of 8 basis points when compared to an already excellent ratio of 0.82% at September 30, 2004. The delinquency ratio on the commercial loan portfolio for the categories of 60 days and over, increased slightly by 5 basis points to a still excellent 0.80% (less than 1%), when compared to 0.75% reported for the year ago period. The delinquency ratio on the consumer loan portfolio, including the Expresso of Westernbank loan portfolio, for the categories of 60 days and over improved by 9 basis points, to 1.53% at September 30, 2005, when compared to 1.62% for the comparable period last year.
On a linked quarter comparison, our combined delinquency on all portfolios for the categories of 60 days and over increased by 9 basis points, from 0.65% at June 30, 2005. The increase in the overall delinquency ratio resulted from increases in the delinquency levels of the commercial and consumer loan portfolios, mainly in loans collateralized by real estate properties. The delinquency ratio on the commercial loan portfolio for the categories of 60 days and over, increased 13 basis points from 0.67% at June 30, 2005. The increase in the delinquency ratio of the commercial loan portfolio was principally due to one commercial loan with a principal balance of $2.5 million. This loan is collateralized with real estate and did not require any valuation allowance. The delinquency ratio on the consumer loan portfolio, including the Expresso of Westernbank loan portfolio, for the categories of 60 days and over increased 18 basis points from 1.35% at June 30, 2005. The increase in the regular consumer loans delinquency ratio on a linked quarter comparison is also principally attributable to regular consumer loans past due over 90 days which are collateralized by real estate properties.
The provision for possible loan losses amounted to $6.0 million for the quarter ended September 30, 2005, down $4.4 million or 42.19%, from $10.4 million for the same period in the previous year. Even though the loan portfolio grew between periods, the decrease was attributed to the strong asset quality as evidenced by lower net charge offs and relatively stable delinquencies in our commercial and consumer loan portfolios during the third quarter of year 2005, when compared to the same period in 2004, as explained before. For the nine months ended September 30, 2005, the provision for possible loan losses amounted to $17.0 million, down from $30.1 million for the nine months ended September 30, 2004, a decrease of $13.1 million or 43.60%. The allowance for possible loan losses reached $86.6 million as of September 30, 2005.
Net loans charged-off in the third quarter of 2005 were $3.8 million or 0.21% (annualized) to average loans, a significant improvement when compared to $6.2 million or 0.44% (annualized) to average loans for the same period in 2004, a decrease of $2.4 million or 37.95%. For the nine months ended September 30, 2005, net charge-offs amounted to $10.5 million or 0.21% (annualized) to average loans, also a decrease of $4.7 million, when compared to $15.2 million or 0.38% (annualized) to average loans in 2004. The decrease in net loans charged-off for the third quarter of 2005 when compared to the same quarter in 2004, is principally attributed to lower net charge-offs of consumer loans. Loans charged-off by the Expresso of Westernbank division, the principal component of the consumer loans charged-off, decreased from $3.2 million during the third quarter of 2004, to $2.4 million for the third quarter of 2005, a decrease of $821,000 or 25.31%.
On a linked quarter comparison, loans charged-off by the Expresso of Westernbank division have stabilized at lower levels when compared to the higher write-off experienced in the first half of 2004, being $2.5 million in the fourth quarter of 2004, $2.1 million in the first quarter of 2005, $2.4 million in the second quarter of 2005, and $2.4 million in the third quarter of 2005. Management strategy of stabilizing charge offs and increasing the yield of the Expresso loan portfolio by continuously revising its underwriting policies, increasing the level of collateralized loans, and increasing the overall rates charged has resulted in lower levels in net charge offs and a higher yield. The average yield of the Expresso of Westernbank loan portfolio was 22.89% at September 30, 2005. Also, the loan portfolio of Expresso of Westernbank collateralized by real estate at September 30, 2005, already accounts for 14% of the outstanding balance.
Non-performing loans stand at $51.7 million or 0.69% (less than 1%) of Westernbank's loan portfolio at September 30, 2005, an increase of $17.5 million, when compared to $ 34.3 million at December 31, 2004. The increase in non-performing loans mainly comes from the Company's commercial loans portfolio. Non-performing loans on the commercial loan portfolio increased by $ 14.1 million, when compared to December 31, 2004. The increase is mainly attributed to one borrower with four loans with an aggregate principal balance of $ 8.4 million and two additional loans with principal balances of $1.5 million and $1.1 million, respectively. All loans are fully collateralized by real estate properties and did not require any valuation allowance. At September 30, 2005, none of the additional non-performing loans exceeded $1.0 million in outstanding principal balance.
At September 30, 2005, the allowance for possible loan losses was 167.41% of total non-performing loans (reserve coverage). Moreover, of the total allowance of $86.6 million, $11.1 million is for our specific allowance and the remaining $75.5 million is for our general allowance.
Total Loans, Investments and Deposits
Loans receivable-net, grew $1.5 billion or 24.61%, to $7.4 billion at September 30, 2005, compared to $5.9 billion at December 31, 2004, and $1.7 billion or 29.50% compared to $5.7 billion at September 30, 2004. These increases reflect the Company's emphasis on continued growth in its variable rate loan portfolio mainly through commercial real estate and commercial business and others, including asset-based and residential real estate. As a result, commercial real estate loans increased from $3.0 billion as of September 30, 2004, to $3.2 billion as of December 31, 2004, and to $3.9 billion as of September 30, 2005, an increase of $913.5 million or 30.95% on a year to year basis, and $710.3 million or 22.51%, when compared to December 31, 2004. Other commercial loans not collateralized by real estate, increased from $741.5 million at September 30, 2004, to $768.6 million at December 31, 2004, and to $989.2 million at September 30, 2005, up by $247.7 million or 33.40% on a year to year basis, and $220.6 million or 28.70%, when compared to December 31, 2004. Residential real estate mortgage loans portfolio increased from $902.9 million at December 31, 2004, to $1.3 billion at September 30, 2005, an increase of $445.7 million or 49.36%. This increase is mainly due to the purchase during the first two quarters of 2005 of residential mortgage loans on a floating rate basis from other mortgage originators in Puerto Rico, as part of the management strategy of emphasizing in growing its variable rate loans, in light of the current rising interest rate scenario. No such purchase was made during the quarter ended September 30, 2005. Attached as Exhibit IV is a supplemental unaudited data schedule providing additional information on W Holding loan portfolio.
W Holding's investment portfolio, excluding short-term money market instruments, stands at $7.0 billion at September 30, 2005, increasing slightly by $58.4 million or 0.84% in comparison to December 31, 2004. The change in the investment portfolio is attributable to approximately $150.0 million previously invested in money market instruments that were reinvested into $150.0 million of U.S. Government and agencies obligations on a short-term basis. In light of the current rising interest rate scenario, the Company's strategy has shifted to reposition its balance sheet by continuing the emphasis on growing its floating rate loans, while remaining on the sideline on the investment side until new investment opportunities arise. The investment portfolio at September 30, 2005, had an average contractual maturity of 47 months.
The Company's interest rate risk model takes into consideration the callable feature of certain investment securities. Assuming that all call features are exercised, the investment portfolio as of September 30, 2005, had a remaining average maturity of 6 months. However, no assurance can be given that such levels will be maintained in future periods.
As of September 30, 2005, total deposits reached $7.9 billion, from $6.2 billion at December 31, 2004, an increase of $1.7 billion or 26.54%, while federal funds purchased and repurchase agreements decreased to $6.3 billion, from $6.7 billion at December 31, 2004, a decrease of $366.8 million or 5.49%. During the nine months ended September 30, 2005, the Bank has continued extending a portion of its liabilities to lock-in the rate for a period of up to three years. This strategy is part of the process adopted by the Bank in mid 2004, whereby similar transactions were executed during the third and fourth quarter of 2004.
This press release may contain some information that constitutes "forward-looking statements." Such information can be identified by the use of forward-looking terminology such as "may," "will," "should," "expect," "anticipate," "estimate," "intend," "continue," or "believe" or the negatives or other variations of these terms or comparable terminology. Forward-looking statements with respect to future financial conditions, results of operations and businesses of the Company are always subject to various risk and market factors out of management's control which could cause future results to differ materially from current management expectations or estimates and as such should be understood. Such factors include particularly, but are not limited; to the possibility of prolonged adverse economic conditions or that an adverse interest rate environment could develop. Except as required by applicable law, the Company does not intend, and specifically disclaims any obligation, to update forward-looking statements.
WESTERNBANK PUERTO RICO, a wholly-owned subsidiary of W HOLDING COMPANY, INC., is the second largest commercial bank in Puerto Rico, based on total assets, operating throughout 53 full fledged branches, including 33 in the Southwestern region of Puerto Rico, 7 in the Northeastern region, 12 at the San Juan Metropolitan area of Puerto Rico and one in the Eastern region of Puerto Rico, and a fully functional banking site on the Internet. W HOLDING COMPANY, INC. also owns Westernbank Insurance Corp., a general insurance agent placing property, casualty, life and disability insurance, whose results of operations and financial condition are reported on a consolidated basis.
Messrs. Frank C. Stipes, Esq., Chairman of the Board and Chief Executive Officer of W Holding Company, Inc., Freddy Maldonado, President of W Holding Company, Inc., Jose M. Biaggi, Esq. President and Chief Executive Officer of Westernbank Puerto Rico, Ricardo Hernandez, Chief Financial Officer and Carmen T. Casellas, Investor Relations, are available to answer appropriate questions regarding this press release. You may contact any of the above officers at (787) 834-8000; or via internet at or URL: http://www.w-holding.com/ .
W HOLDING COMPANY, INC. EXHIBIT I
FINANCIAL HIGHLIGHTS
(UNAUDITED)
Three Months Ended Nine Months Ended
September 30, September 30,
2005 2004 2005 2004
(Amounts in thousands, except per share data)
Income Statement Data
Interest income:
Loans,
including
loan fees $ 126,690 $ 82,645 $ 341,258 $ 232,710
Investment
securities 62,433 55,159 184,425 153,542
Mortgage-
backed
securities 7,741 9,162 25,006 28,660
Money market
instruments 8,483 4,579 27,369 12,056
Total
interest
income 205,347 151,545 578,058 426,968
Interest expense:
Deposits 62,367 36,858 161,340 102,282
Federal
funds
purchased
and
repurchase
agreements 60,437 35,874 167,113 97,250
Advances
from Federal
Home Loan
Bank 1,870 1,767 5,693 4,621
Total
interest
expense 124,674 74,499 334,146 204,153
Net interest
income 80,673 77,046 243,912 222,815
Provision for
loan losses 6,000 10,379 17,000 30,141
Net interest
income after
provision
for loan losses 74,673 66,667 226,912 192,674
Noninterest
income:
Service and
other charges
on loans 2,916 2,546 7,599 7,344
Service
charges on
deposit
accounts 2,153 2,054 6,303 5,974
Other fees
and
commissions 3,326 2,930 9,542 8,089
Net gain on
sales and
valuation
of loans,
securities,
and other
assets 100 594 414 867
Gain (loss)
on derivative
instruments (188) 249 (124) 12
Total
noninterest
income 8,307 8,373 23,734 22,286
Total net
interest income
and noninterest
income 82,980 75,040 250,646 214,960
Noninterest
expenses:
Salaries and
employees'
benefits 11,866 9,701 34,045 27,846
Equipment 2,488 2,179 7,051 6,981
Deposit
insurance
premium and
supervisory
examination 843 753 2,468 2,112
Occupancy 1,976 1,536 5,611 4,882
Advertising 1,925 3,031 6,743 8,895
Printing,
postage,
stationery,
and supplies 730 817 2,328 2,490
Telephone 457 577 1,512 1,764
Net (gain)
loss from
operations
of foreclosed
real estate
held for sale (80) (58) (287) 515
Municipal
taxes 1,276 1,078 3,432 2,875
Other 6,103 5,694 16,476 15,835
Total
noninterest
expenses 27,584 25,308 79,379 74,195
Income before
provision for
income taxes 55,396 49,732 171,267 140,765
Provision for
income taxes:
Current 16,258 6,308 39,557 19,861
Deferred (878) (819) (2,670) (4,856)
Total
provision
for income
taxes 15,380 5,489 36,887 15,005
Net income $ 40,016 $ 44,243 $ 134,380 $ 125,760
Net income
available to
common
stockholders $ 30,784 $ 37,510 $ 106,625 $ 105,509
Basic earnings
per common
share $ 0.19 $ 0.23 (1) $ 0.65 $ 0.65 (1)
Diluted earnings
per common share $ 0.18 $ 0.22 (1) $ 0.63 $ 0.62 (1)
Cash dividends
declared per
common share (2) $ 0.05 $ 0.04 (1) $ 0.14 $ 0.11 (1)
Period end
number of common
shares
outstanding 164,066 163,477 (1) 164,066 163,477 (1)
Weighted average
number of
common shares
outstanding 164,057 163,397 (1) 164,010 163,215 (1)
Weighted average
number of
common shares
outstanding on
a diluted basis 170,706 170,816 (1) 170,747 170,669 (1)
Cash dividends
declared on:
Common stock $ 7,793 $ 5,875 $ 22,781 $ 17,611
Preferred
stock $ 9,232 $ 6,733 $ 27,755 $ 20,251
(1) Adjusted to reflect the three-for-two stock split and a 2% stock
dividend on our common stock declared in December 2004 and both
distributed on January 10, 2005.
(2) Cash dividend amounts in the table are rounded.
W HOLDING COMPANY, INC. EXHIBIT II
FINANCIAL HIGHLIGHTS
(UNAUDITED)
Balance Sheet Data September 30, December 31, September 30,
2005 2004 2004
(In thousands)
At Period End
Cash and due
from banks $ 95,583 $ 77,752 $ 89,495
Money market
instruments:
Federal
funds sold
and resell
agreements 792,741 1,017,303 680,078
Interest-bearing
deposits in banks 105,613 49,476 51,799
Investment
securities available
for sale, at fair
value 680 7,881 12,226
Investment securities
held to maturity,
at amortized
cost 6,987,013 6,921,379 6,613,078
Federal Home
Loan Bank
stock, at cost 35,300 52,195 57,105
Residential
mortgage
loans held
for sale,
at lower of
cost or fair value 1,483 1,633 1,714
Loans -- net 7,403,514 5,941,233 5,716,931
Accrued
interest
receivable 96,264 88,285 78,442
Premises and
equipment, net 114,656 110,051 108,340
Deferred income
taxes, net 33,697 31,027 29,787
Other assets 44,958 38,447 39,863
Total Assets $15,711,502 $14,336,662 $13,478,858
Liabilities:
Deposits:
Noninterest-
bearing $ 288,929 $ 249,368 $ 240,841
Interest-bearing
and related
accrued interest
payable 7,596,237 5,981,843 5,991,784
Total deposits 7,885,166 6,231,211 6,232,625
Federal funds
purchased
and repurchase
agreements 6,316,767 6,683,527 6,011,735
Advances
from Federal
Home Loan Bank 172,000 211,000 211,000
Mortgage
note
payable 36,544 36,858 36,960
Securities
purchased
but not yet
received - - 5,020
Accrued
expenses
and other
liabilities 115,398 92,387 62,729
Total Liabilities 14,525,875 13,254,983 12,560,069
Stockholders' equity 1,185,627 1,081,679 918,789
Total Liabilities and
Stockholders' Equity $ 15,711,502 $ 14,336,662 $ 13,478,858
Quarter to Date Averages (1) Year to Date Averages (1)
Average
Balances September 30, September 30, September 30, September 30,
2005 2004 2005 2004
(In thousands)
Cash and due
from banks $ 100,638 $ 83,591 $ 86,668 $ 91,153
Money market
instruments:
Federal
funds sold
and resell
agreements 775,161 633,802 905,022 664,965
Interest-
bearing
deposits
in banks 80,215 61,509 77,545 44,783
Trading
securities - 1,291 - -
Investment
securities
available
for sale 1,436 67,588 4,281 33,653
Investment
securities
held to
maturity 6,945,921 6,567,005 6,954,196 6,168,394
Federal Home
Loan Bank
stock 35,300 49,178 43,748 48,428
Residential
mortgage
loans held
for sale 1,560 1,185 1,558 2,135
Loans -- net 7,259,457 5,557,402 6,672,374 5,200,025
Accrued
interest
receivable 97,503 81,345 92,275 77,004
Premises and
equipment,
net 113,224 107,712 112,354 105,855
Deferred
income
taxes, net 33,259 29,374 32,362 27,348
Other assets 48,103 41,662 41,703 35,408
Total Assets $15,491,777 $13,282,644 $15,024,086 $12,499,151
Liabilities:
Deposits:
Noninterest-
bearing $ 291,597 $ 257,345 $ 269,149 $ 216,801
Interest-
bearing and
related
accrued
interest
payable 7,402,111 5,897,064 6,789,040 5,592,250
Total
deposits 7,693,708 6,154,409 7,058,189 5,809,051
Federal
funds
purchased and
repurchase
agreements 6,303,087 5,927,527 6,500,147 5,528,891
Advances
from
Federal Home
Loan Bank 172,000 193,500 191,500 178,500
Mortgage
note payable 36,595 37,006 36,701 37,097
Securities
purchased
but not yet
received - 2,510 - 2,510
Accrued
expenses
and other
liabilities 112,356 65,107 103,896 69,453
Total
Liabilities 14,317,746 12,380,059 13,890,433 11,625,502
Stockholders'
equity 1,174,031 902,585 1,133,653 873,649
Total
Liabilities and
Stockholders'
Equity $15,491,777 $13,282,644 $15,024,086 $12,499,151
(1) Average balances have been computed using beginning and period-end
balances.
W HOLDING COMPANY, INC. EXHIBIT III a
YIELDS EARNED AND RATES PAID
THREE MONTHS ENDED SEPTEMBER 30,
(UNAUDITED)
2005
Annualized
Average Average
Interest Balance (1) Yield/Rate
(Dollars in thousands)
Normal spread:
Interest-earning assets:
Loans, including loan fees (2) $ 126,690 $7,226,415 6.96 %
Investment securities (3) 62,433 6,332,947 3.91
Mortgage-backed securities (3) 7,741 731,220 4.20
Money market instruments 8,483 835,937 4.03
Total 205,347 15,126,519 5.39
Interest-bearing liabilities:
Deposits 62,367 7,609,348 3.25
Federal funds purchased and
repurchase agreements 60,437 6,330,813 3.79
Advances from FHLB 1,870 172,000 4.31
Total 124,674 14,112,161 3.50
Net interest income $ 80,673
Interest rate spread 1.89 %
Net interest-earning assets $1,014,358
Net yield on interest-earning
assets (4) 2.12 %
Ratio of interest-earning assets
to interest-bearing liabilities 107.19%
Tax equivalent spread:
Interest-earning assets $205,347 $15,126,519 5.39 %
Tax equivalent adjustment 7,609 - 0.20
Interest-earning assets
-- tax equivalent 212,956 $15,126,519 5.59
Interest-bearing liabilities 124,674 $14,112,161 3.50
Net interest income $ 88,282
Interest rate spread 2.09 %
Net yield on interest --
earning assets (4) 2.32 %
2004
Annualized
Average Average
Interest Balance (1) Yield/Rate
Normal spread:
Interest-earning assets:
Loans, including loan fees (2) $ 82,645 $ 5,565,089 5.91 %
Investment securities (3) 55,159 5,618,796 3.91
Mortgage-backed securities (3) 9,162 910,848 4.00
Money market instruments 4,579 651,355 2.80
Total 151,545 12,746,088 4.73
Interest-bearing liabilities:
Deposits 36,858 6,046,809 2.42
Federal funds purchased and
repurchase agreements 35,874 5,743,827 2.48
Advances from FHLB 1,767 187,747 3.74
Total 74,499 11,978,383 2.47
Net interest income $ 77,046
Interest rate spread 2.26 %
Net interest-earning assets $ 767,705
Net yield on interest-earning
assets (4) 2.40 %
Ratio of interest-earning assets
to interest-bearing liabilities 106.41%
Tax equivalent spread:
Interest-earning assets $ 151,545 $12,746,088 4.73 %
Tax equivalent adjustment 13,907 - 0.43
Interest-earning assets
-- tax equivalent 165,452 $12,746,088 5.16
Interest-bearing liabilities 74,499 $11,978,383 2.47
Net interest income $ 90,953
Interest rate spread 2.69 %
Net yield on interest
-- earning assets (4) 2.84 %
(1) Average balances on interest-earning assets and on interest-bearing
liabilities are computed using daily monthly average balances during
the period.
(2) Average loans exclude non-performing loans. Loan fees, net amounted to
$5.2 million and $3.1 million for the three-month periods ended
September 30, 2005 and 2004, respectively.
(3) Includes trading and available for sale securities.
(4) Annualized net interest income divided by average interest-earning
assets.
W HOLDING COMPANY, INC. EXHIBIT III b
YIELDS EARNED AND RATES PAID
NINE MONTHS ENDED SEPTEMBER 30,
(UNAUDITED)
2005
Annualized
Average Average
Interest Balance (1) Yield/Rate
(Dollars in thousands)
Normal spread:
Interest-earning assets:
Loans, including loan fees (2) $ 341,258 $6,757,577 6.75 %
Investment securities (3) 184,425 6,273,567 3.93
Mortgage-backed securities (3) 25,006 779,106 4.29
Money market instruments 27,369 939,062 3.90
Total 578,058 14,749,312 5.24
Interest-bearing liabilities:
Deposits 161,340 7,142,636 3.02
Federal funds purchased and
repurchase agreements 167,113 6,439,478 3.47
Advances from FHLB 5,693 188,249 4.04
Total 334,146 13,770,363 3.24
Net interest income $ 243,912
Interest rate spread 2.00 %
Net interest-earning assets $ 978,949
Net yield on interest-earning
assets (4) 2.21 %
Ratio of interest-earning assets
to interest-bearing liabilities 107.11%
Tax equivalent spread:
Interest-earning assets $ 578,058 $14,749,312 5.24 %
Tax equivalent adjustment 34,189 - 0.31
Interest-earning assets
-- tax equivalent 612,247 $14,749,312 5.55
Interest-bearing liabilities 334,146 $13,770,363 3.24
Net interest income $ 278,101
Interest rate spread 2.31 %
Net yield on interest
-- earning assets (4) 2.52 %
2004
Annualized
Average Average
Interest Balance (1) Yield/Rate
Normal spread:
Interest-earning assets:
Loans, including loan fees (2) $ 232,710 $ 5,237,517 5.93 %
Investment securities (3) 153,542 5,206,047 3.94
Mortgage-backed securities (3) 28,660 961,326 3.98
Money market instruments 12,056 680,406 2.37
Total 426,968 12,085,296 4.72
Interest-bearing liabilities:
Deposits 102,282 5,791,741 2.36
Federal funds purchased and
repurchase agreements 97,250 5,433,281 2.39
Advances from FHLB 4,621 148,547 4.16
Total 204,153 11,373,569 2.40
Net interest income $ 222,815
Interest rate spread 2.32 %
Net interest-earning assets $ 711,727
Net yield on interest-earning
assets (4) 2.46 %
Ratio of interest-earning assets
to interest-bearing liabilities 106.26%
Tax equivalent spread:
Interest-earning assets $ 426,968 $12,085,296 4.72 %
Tax equivalent adjustment 39,893 - 0.44
Interest-earning assets
-- tax equivalent 466,861 $12,085,296 5.16
Interest-bearing liabilities 204,153 $11,373,569 2.40
Net interest income $ 262,708
Interest rate spread 2.76 %
Net yield on interest
-- earning assets (4) 2.90 %
(1) Average balances on interest-earning assets and on interest-bearing
liabilities are computed using daily monthly average balances during
the period.
(2) Average loans exclude non-performing loans. Loan fees, net amounted to
$14.8 million and $8.3 million for the nine-month periods ended
September 30, 2005 and 2004, respectively.
(3) Includes trading and available for sale securities.
(4) Annualized net interest income divided by average interest-earning
assets.
W HOLDING COMPANY, INC. EXHIBIT III c
CHANGES IN YIELDS EARNED AND RATES PAID
(UNAUDITED)
Three Months Ended Nine Months Ended
September 30, September 30,
2005 vs. 2004 2005 vs. 2004
Volume Rate Total Volume Rate Total
(In thousands)
Interest income:
Loans $27,633 $ 16,412 $44,045 $73,631 $34,917 $108,548
Investment
securities (1) 7,190 84 7,274 31,238 (355) 30,883
Mortgage-backed
securities (1) (1,898) 477 (1,421) (6,185) 2,531 (3,654)
Money market
instruments 1,530 2,374 3,904 5,671 9,642 15,313
Total increase in
interest income 34,455 19,347 53,802 104,355 46,735 151,090
Interest expense:
Deposits 10,998 14,511 25,509 26,826 32,232 59,058
Federal funds
purchased and
repurchase
agreements 4,007 20,556 24,563 20,330 49,533 69,863
Advances
from FHLB (127) 230 103 1,192 (120) 1,072
Total increase in
interest
expense 14,878 35,297 50,175 48,348 81,645 129,993
Increase
(decrease)
in net interest
income $19,577 $(15,950) $ 3,627 $56,007 $(34,910) $ 21,097
(1) Includes trading and available for sale securities.
W HOLDING COMPANY, INC. EXHIBIT IV
LOAN RECEIVABLE-NET
(UNAUDITED)
September December September
30, 31, 30,
2005 2004 2004
(In thousands)
Residential real estate:
Mortgage $1,348,630 $ 902,937 $ 938,637
Construction 449,156 328,145 294,916
Commercial, industrial and
agricultural (1):
Real estate 3,864,933 3,154,679 2,951,446
Business and others 989,179 768,604 741,518
Consumer and others (2) 838,212 866,934 867,002
Total Loans 7,490,110 6,021,299 5,793,519
Allowance for loan losses (86,596) (80,066) (76,588)
Loans -- net $7,403,514 $5,941,233 $5,716,931
(1) Includes $1.2 billion, $831.1 million and $795.5 million of
Westernbank Business Credit division outstanding loans at September
30, 2005, December 31, 2004 and September 30, 2004, respectively.
(2) Includes $135.9 million, $144.0 million and $144.6 million of Expresso
of Westernbank division outstanding loans at September 30, 2005,
December 31, 2004 and September 30, 2004, respectively.
W HOLDING COMPANY, INC. EXHIBIT V
NON-PERFORMING LOANS AND FORECLOSED
REAL ESTATE HELD FOR SALE
(UNAUDITED)
September December September
30, 2005 31, 2004 30, 2004
(Dollars in thousands)
Commercial, industrial and
agricultural loans $ 39,480 $ 25,417 $ 28,187
Consumer loans 8,616 7,122 8,309
Residential real estate mortgage and
construction loans 3,631 1,730 2,217
Total non-performing loans 51,727 34,269 38,713
Foreclosed real estate held for sale 4,096 3,811 4,444
Total non-performing loans and
foreclosed real estate held for sale $ 55,823 $ 38,080 $ 43,157
Interest that would have been
recorded if the loans had not
been classified as non-performing $ 4,195 $ 3,557 $ 3,062
Interest recorded on non-performing
loans $ 733 $ 243 $ 206
Total non-performing loans as a
percentage of total loans at end
of period 0.69% 0.57% 0.67%
Total non-performing loans and
foreclosed real estate held for sale
as a percentage of total assets at
end of period 0.36% 0.27% 0.32%
W HOLDING COMPANY, INC. EXHIBIT VI
CHANGES IN ALLOWANCE FOR LOAN LOSSES
(UNAUDITED)
September December September
30, 31, 30,
2005 2004 2004
(Dollars in thousands)
Balance, beginning of year $ 80,066 $ 61,608 $ 61,608
Loans charged-off:
Consumer loans (1) (9,608) (16,473) (12,889)
Commercial, industrial and
agricultural loans (2,784) (5,433) (4,658)
Real estate-mortgage and
construction loans (63) (297) (197)
Total loans charged-off (12,455) (22,203) (17,744)
Recoveries of loans previously
charged-off:
Consumer loans (2) 1,366 1,920 1,409
Commercial, industrial and
agricultural loans 443 1,844 1,102
Real estate-mortgage and
construction loans 176 206 72
Total recoveries of loans previously
charged-off 1,985 3,970 2,583
Net loans charged-off (10,470) (18,233) (15,161)
Provision for loan losses 17,000 36,691 30,141
Balance, end of period $ 86,596 $ 80,066 $ 76,588
Ratios:
Allowance for loan losses to total
loans at end of period 1.16% 1.33% 1.32%
Provision for loan losses to net
loans charged-off 162.37% 201.23% 198.81%
Recoveries of loans to loans
charged-off in previous period 11.95% (3) 26.71% 23.18% (3)
Net loans charged-off to average
total loans (4) 0.21% (3) 0.34% 0.38% (3)
Allowance for loan losses to
non-performing loans 167.41% 233.64% 197.84%
(1) Includes $6.9 million and $9.9 million of Expresso of Westernbank
loans charged-offs for the nine-month periods ended September 30, 2005
and September 30, 2004, respectively, and $12.4 million for the year
ended December 31, 2004.
(2) Includes $712,000 and $683,000 of Expresso of Westernbank loans
recoveries for the nine-month periods ended September 30, 2005 and
September 30, 2004, respectively, and $1.0 million for the year ended
December 31, 2004.
(3) Net loans charged-off ratios are annualized for comparison purposes.
(4) Average loans were computed using beginning and period-end balances.
W HOLDING COMPANY, INC. EXHIBIT VII
SELECTED FINANCIAL RATIOS
(UNAUDITED)
Three Months Ended Nine Months Ended
September 30, September 30,
2005 2004 2005 2004
(Dollars and share data in thousands, except
per share data)
Per share data:
Dividend payout ratio 25.32% 15.66% 21.37% 16.69%
Book value per common
share $ 3.99 $ 3.29 (2) $ 3.99 $ 3.29 (2)
Preferred stock
outstanding at end of
period 18,163 15,245 18,163 15,245
Preferred stock equity at
end of period $531,006 $381,136 $531,006 $381,136
Performance ratios:
Return on assets (1) 1.03% 1.33% 1.19% 1.34%
Return on common
stockholders' equity (1) 19.15% 28.81% 23.22% 28.67%
Efficiency ratio 30.97% 29.92% 29.69% 30.38%
Operating expenses to
total end-of-period
assets 0.70% 0.75% 0.67% 0.73%
Capital ratios:
Total capital to risk-
weighted assets 14.58% 14.09% 14.58% 14.09%
Tier I capital to risk-
weighted assets 13.72% 13.15% 13.72% 13.15%
Tier I capital to average
assets 7.64% 7.00% 7.64% 7.00%
Equity-to-assets ratio (1) 7.58% 6.82% 7.55% 6.82%
Other selected data:
Total trust assets
managed $479,734 $388,932 $479,734 $388,932
Branch offices 53 51 53 51
Number of employees 1,266 1,141 1,266 1,141
Year Ended
December 31,
2004
Per share data:
Dividend payout ratio 16.24%
Book value per common share $ 3.48
Preferred stock outstanding at end
of period 17,794
Preferred stock equity at end of
period $511,744
Performance ratios:
Return on assets (1) 1.33%
Return on common stockholders'
equity (1) 28.55%
Efficiency ratio 30.51%
Operating expenses to total
end-of-period assets 0.70%
Capital ratios:
Total capital to risk-weighted
assets 15.70%
Tier I capital to risk-weighted
assets 14.78%
Tier I capital to average assets 7.72%
Equity-to-assets ratio (1) 7.39%
Other selected data:
Total trust assets managed $398,709
Branch offices 52
Number of employees 1,175
(1) The return on assets is computed by dividing annualized net income by
average total assets for the period. The return on common
stockholders' equity is computed by dividing annualized net income
less preferred stock dividends by average common stockholders' equity
for the period. The equity-to-asset ratio is computed by dividing
average equity by average total assets. Average balances have been
computed using beginning and period-end balances.
(2) Adjusted to reflect the three-for-two stock split and a 2% stock
dividend on our common stock declared in December 2004 and both
distributed on January 10, 2005.
DATASOURCE: W Holding Company, Inc.
CONTACT: W Holding Company, Inc., +1-787-834-8000, or
Web site: http://www.wbpr.com/
http://www.w-holding.com/