ADVFN Logo ADVFN

We could not find any results for:
Make sure your spelling is correct or try broadening your search.

Trending Now

Toplists

It looks like you aren't logged in.
Click the button below to log in and view your recent history.

Hot Features

Registration Strip Icon for discussion Register to chat with like-minded investors on our interactive forums.

WHI W.h. Ireland Group Plc

2.75
0.00 (0.00%)
03 Jan 2025 - Closed
Delayed by 15 minutes
Share Name Share Symbol Market Type Share ISIN Share Description
W.h. Ireland Group Plc LSE:WHI London Ordinary Share GB0009241885 ORD 1P
  Price Change % Change Share Price Bid Price Offer Price High Price Low Price Open Price Shares Traded Last Trade
  0.00 0.00% 2.75 2.50 3.00 2.75 2.75 2.75 0.00 08:00:00
Industry Sector Turnover Profit EPS - Basic PE Ratio Market Cap
Finance Services 21.04M -5.94M -0.0252 -1.09 6.49M

W Holding Company, Inc., the Financial Holding Company of Westernbank Puerto Rico, Reports an Increase in Net Income of 20.87% f

24/01/2005 9:44pm

PR Newswire (US)


W.h. Ireland (LSE:WHI)
Historical Stock Chart


From Jan 2020 to Jan 2025
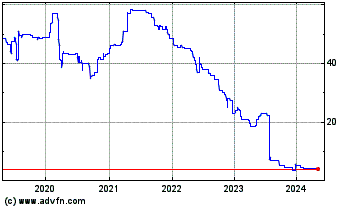
Click Here for more W.h. Ireland Charts.
W Holding Company, Inc., the Financial Holding Company of Westernbank Puerto Rico, Reports an Increase in Net Income of 20.87% for the Fourth Quarter and 51.67% for the Year Ended December 31, 2004 MAYAGUEZ, Puerto Rico, Jan. 24 /PRNewswire-FirstCall/ -- W Holding Company, Inc. (NYSE: "WHI"), the financial holding company of Westernbank Puerto Rico, reported today its results for the fourth quarter and year ended December 31, 2004. W Holding reported a net income of $46.1 million or $0.24 earnings per basic common share ($0.23 on a diluted basis) for the quarter ended December 31, 2004, as compared to a net income of $38.1 million or $0.19 earnings per basic and diluted common share for the same period in 2003, after giving effect to the three-for-two (3x2) stock split and a two percent (2%) stock dividend declared on December 6, 2004, and December 13, 2004, respectively, and distributed both on January 10, 2005. This is an increase of $8.0 million or 20.87% over the prior year quarter. For the year ended December 31, 2004, W Holding reported a net income of $171.9 million or $0.89 earnings per basic common share ($0.86 on a diluted basis), as compared to a net income of $113.3 million or $0.57 earnings per basic common share ($0.55 on a diluted basis) (as adjusted) for the same period in 2003, an increase of $58.6 million or 51.67%. The $113.3 million net income reported for the year ended December 31, 2003, was affected by a loss of $22.7 million ($17.0 million net of tax) on valuation and disposition of the Company's investment in CBO's and CLO's, as previously reported. The return on assets (ROA) and the return on common stockholders' equity (ROCE) for the quarter ended December 31, 2004, were 1.33% and 28.31%, respectively, as compared to 1.37% and 29.44% reported for the same quarter in 2003. For the year ended December 31, 2004, the ROA and the ROCE were 1.33% and 28.55%, respectively, compared to 1.15% and 22.79%, for the same period in prior year. The ratios for the comparable year ended December 31, 2003, were affected by the loss referred to in the previous paragraph. At December 31, 2004, driven by strong increases in W Holding activities, total assets ended at $14.3 billion, surpassing our year end goal of reaching $14.0 billion in total assets. Total assets grew $2.8 billion or 24.46%, from $11.5 billion at December 31, 2003. Loans receivable-net, grew by $1.3 billion or 26.86%, from $4.7 billion at December 31, 2003, as a result of the Company's continued strategy of growing its loan portfolio through commercial real estate, construction and land acquisition, asset-based and other commercial loans. The investment portfolio, excluding short-term money market instruments, grew by $1.2 billion or 19.91%, from $5.8 billion at December 31, 2003, to $6.9 billion at December 31, 2004. Stockholders' equity increased to $1.1 billion as of December 31, 2004, compared to $828.5 million as of December 31, 2003. Such increase resulted principally from the combination of the issuance of 2,675,500 shares of the Company's Series H Preferred Stocks completed on December 21, 2004, providing a net capital infusion of $129.3 million, plus the net income of $171.9 million generated during the year ended December 31, 2004, partially offset by dividends paid during the year of $23.5 million and $27.2 million on our common and preferred shares, respectively, and a decrease of $721,000 in other comprehensive loss, net of tax, on the mark to market of our portfolio of investment securities available for sale at December 31, 2004, when compared to December 31, 2003. The period-end number of common shares outstanding increased from 106,290,294 as of December 31, 2003, to 163,918,835 as of December 31, 2004, as a result of the issuance of 56,781,960 common shares for the stock split and stock dividend declared in December 2004 and distriuted both on January 10, 2005, the conversion of 276,994 shares of the Company's convertible preferred stock series A, into 631,831 shares of the Company's common stock, and the issuance of 214,750 common shares from the exercise of stock options. Net Interest Income Net interest income for the fourth quarter ended December 31, 2004, was $76.7 million, an increase of $5.4 million or 7.63%, from $71.3 million for the same period of last year. This increase mainly resulted from the net interest-earning assets of $786.1 million, which contributed a $15.1 million positive volume variance, which was partially offset by a $9.6 million negative rate variance. Average interest-earning assets for the fourth quarter of 2004 increased by $2.8 billion or 25.89%, compared to the same quarter in previous year, mainly driven by increases in the average loan portfolio of $1.2 billion, particularly in the commercial real estate, construction and land acquisition, asset-based and other commercial loan portfolios, and in the average investment portfolio, excluding short-term money market instruments, which increased also by $1.2 billion. The increase in the investment portfolio, excluding short-term money market instruments, was primarily in tax exempt securities, such as U.S. Government and agencies obligations. For the year ended December 31, 2004, net interest income increased from $239.3 million in 2003, to $299.5 million, an increase of $60.2 million or 25.17%. This increase mainly resulted from the net interest-earning assets of $734.1 million, which contributed a $66.4 million positive volume variance, which was partially offset by a $6.1 million negative rate variance. Average interest-earning assets increased by $3.1 billion or 33.06%. This increase in average interest-earning assets was driven by increases in the average loan portfolio of $1.1 billion, mainly in the commercial real estate, construction and land acquisition, asset-based and other commercial loan portfolios, and in the average investment portfolio, excluding short-term money market instruments, of $1.8 billion, primarily in tax exempt securities, such as U.S. Government and agencies obligations. The average yield earned in interest- earning assets decreased from 4.87% to 4.85% and from 4.92% to 4.74%, for the quarter and year ended December 31, 2004, respectively, when compared to prior year periods. The decrease in the average yield was mainly due to a lower average yield earned on the loans portfolio, due to a higher volume of commercial real estate loans and other commercial loans with floating rates. The decrease in the average yield earned on the loans portfolio was partially offset by higher reinvestment rates on matured and called securities and higher yields earned in money market instruments. Reinvestment rates for new securities were higher when compared to the previous periods, except for the last quarter of 2004, as the U.S. Treasury yield curve initially steepened ahead of the reaction by the Federal Reserve, which started to increase interest rates in the second week of August 2004. As a result of this lagging factor, yields earned on floating rate loans were not adjusted as fast as on investment securities since the Prime Rate (an index used by the Bank to re- price most of its loans) was raised at a slower pace following the Federal Reserve action. More recently, during last quarter of 2004, reinvestment rates decreased, primarily due to the flattening of the U.S. Treasury yield curve. Our overall cost of rates paid increased 35 basis points, from 2.39% to 2.74%, for the quarter ended December 31, 2004, when compared to the prior year quarter. The increase on the overall cost of rates paid was primarily due to increases of 40 and 33 basis points on the average interest rate paid on deposits and on federal funds purchased and repurchase agreements, respectively. Average interest paid on deposits increased from 2.25% for the quarter ended December 31, 2003, to 2.65% for the same period in 2004, while average interest rate paid on federal funds purchased and repurchase agreements increased from 2.48% for the quarter ended December 31, 2003, to 2.81% for the same period in 2004. The increase in the overall cost of rates paid was partially offset by lower cost of rates in advances from the Federal Home Loan Bank, which decreased 44 basis points from 4.11% for the quarter ended December 31, 2003, to 3.67% for the same period in 2004. On a year to year comparison, the overall cost of rates paid decreased 5 basis points from 2.53% for the year ended December 31, 2003, to 2.48% for the year ended December 31, 2004. Average interest rates paid on federal funds purchased and repurchase agreements decreased 12 basis points from 2.61% for the year ended December 31, 2003, to 2.49% for the year ended December 31, 2004, while the average interest rate paid on advances from the Federal Home Loan Bank decreased 38 basis points from 4.38% for the year ended December 31, 2003, to 4.00% for the year ended December 31, 2004. The decrease of 5 basis points on a year to year comparison is mainly due to certain liabilities that became due during the current year that were of longer terms and higher costs. These liabilities were part of the strategy in previous periods of increasing the maturities of a portion of the Bank's liabilities in anticipation of rising interest rates. As explained in the preceding paragraph, cost of rates for deposits adjusted immediately as the LIBOR rate (an index used by the Bank to re-price its deposits) increased by market conditions following the change in the U.S. Treasury yield curve. The strong growth in average interest-earning assets between both periods was in part offset by increases in the average interest-bearing liabilities of $2.7 billion or 26.84%, and $2.9 billion or 33.49%, for the quarter and year ended December 31, 2004, respectively. Deposits grew on average by $1.2 billion and $1.1 billion, during the quarter and the year ended December 31, 2004, while other borrowings (federal funds purchased, repurchase agreements, advances from FHLB and other borrowings) on average rose by $1.5 billion and $1.8 billion for the same periods, respectively. Net Interest Margin Our net interest margin decreased 38 basis points during the fourth quarter of 2004, to 2.26% from 2.64% in the fourth quarter of 2003. On a tax equivalent basis our net interest margin also decreased 30 basis points, from 2.96% to 2.66% for the same period. The decrease in our net interest margin obeyed to a decrease in our loan portfolio average yield, coupled with an increase in the cost of rates for deposits and other borrowings, as previously explained. We attribute this contraction primarily to the flattening of the yield curve, whereby the 10-year U.S. Treasury yield remained relatively flat, while the short end of the curve increased. On a linked quarterly comparison, our net interest margin decreased by 14 basis points, from 2.40% in the third quarter of 2004. On a tax equivalent basis, our net interest margin also decreased 18 basis points, from 2.84% in the third quarter of 2004. For the year ended December 31, 2004, our net interest margin decreased 15 basis points, and on a tax equivalent basis, decreased by 6 basis point, when compared to the year ended December 31, 2003. The decrease in the net interest margin was mainly attributed to a decrease in our loan portfolio yield and an increase in the rate paid in our deposits. This decrease was partially offset by an increase in the investment securities yield and a decrease in the rate paid in our borrowings, as previously explained. Under a flat interest rate scenario for the next twelve month period, based on our asset and liability composition as of December 31, 2004, we estimate our net interest margin will be approximately 2.26% during said period. Assuming an instantaneous 100 basis points decrease in the fed funds rate, we estimate our net interest margin will fluctuate within a range of 2.11% to 2.24% during said period. Assuming a 100 basis points increase in the fed funds rate, we estimate our net interest margin will fluctuate within a range of 1.98% to 2.26%. Furthermore, a 200 basis points increase in the fed funds rate will cause our net interest margin to fluctuate between a range of 1.74% to 2.30%. Accordingly, the repricing of the Bank's deposits and other borrowings coupled to the flattening of the yield curve could contract the net interest margin for year 2005. The lower and higher values of such range meaning the lowest and highest net interest margin for any given quarter within the said twelve month period. These ranges are management's estimates based on instantaneous rate shocks of 100 and 200 basis points and does not consider any asset/liability management strategy it could undertake given such interest rate changes. Attached as Exhibits IIIa, IIIb and IIIc are supplemental unaudited data schedules providing additional information on the net interest margin including average balances and average rates for both interest-earning assets and interest-bearing liabilities, as well as changes in volumes and rates for the periods presented. Noninterest Income Noninterest income increased $1.8 million for the three month period ended December 31, 2004, when compared to the same period in 2003. This increase was mainly the result of an increase of $1.7 million on the net gain on sales and valuation of loans, securities and other assets. The increase on the net gain on sales and valuation of loans, securities and other assets was primarily due to realized gains of $525,000 on investment securities and $1.2 million on loans securitized or sold in the secondary market. For the year ended December 31, 2004, noninterest income increased $24.6 million, when compared to the same period in 2003. The increase was mainly due to the net loss of $22.7 million recorded during the same period in 2003, relating to our investment in CBO's and CLO's, and included in loss on sales and valuation of loans, securities and other assets, as previously reported. Noninterest Expenses Total noninterest expenses increased $1.9 million or 8.11% for the three- month period ended December 31, 2004, and $15.3 million or 18.04% for the year ended December 31, 2004, when compared to the corresponding periods in 2003. Salaries and employees' benefits, which is the largest component of total noninterest expenses, increased $1.4 million or 15.93% for the fourth quarter of year 2004, and $4.5 million or 13.23% for the year ended December 31, 2004, as compared to the corresponding periods in 2003. Such increases are attributed to the continued expansion of the Company, including increases in personnel, normal salary increases and related employees' benefits, principally attributed to our continued expansion in the San Juan Metropolitan area. At December 31, 2004, the Company had 1,252 full-time employees, including its executive officers, an increase of 160 employees or 14.65%, since December 31, 2003. Advertising expense decreased by $102,000 or 5.95% for the three months ended December 31, 2004, and increased $3.8 million or 56.88% for the year ended December 31, 2004, when compared to the same periods in 2003. The increase for the full year is principally due to various radio, newspaper and television campaigns promoting Westernbank's institutional image and positioning the Company for its strategy in the San Juan Metropolitan area, as well as 2004 promotional campaigns for several Bank's products. The decrease during the three months ended December 31, 2004, is attributed to fewer promotional efforts during the election period. Noninterest expenses, other than salaries and employees' benefits, and advertising discussed above, increased $610,000 or 4.61% for the fourth quarter of 2004, and $7.0 million or 15.85% for the year ended December 31, 2004, resulting primarily from costs associated with the Company's growth and expansion. Despite such increases in noninterest expenses, the Company maintained the same at adequate levels, and achieved an efficiency ratio of 30.90% for the fourth quarter of year 2004, and 30.51% for the year ended December 31, 2004. Provision for Income Taxes The current provision for Puerto Rico income taxes for the three month and the year ended December 31, 2004, amounted to $8.3 million and $28.2 million, compared to $9.0 million and $29.3 million in the same periods of 2003, respectively. The increase in the income before the provision for income taxes includes a significant increase in the Company's exempt interest income derived from the investment in tax exempt securities, primarily in U.S. Government and Agencies Obligations, as previously explained. The deferred income tax credit decreased in 2004 when compared to 2003, since in 2003 the Company recorded a deferred income tax asset related to a capital loss carryforward on the liquidation of the Company's CBO's and CLO's portfolio which is available to offset capital gains in future years. The change in the deferred provision for the quarter ended December 31, 2004, when compared to the prior year quarter, is attributable to other timing differences in the recognition of certain items for tax and books, principally changes in the allowance for loan losses. Therefore, the Company's effective tax rate is substantially below the statutory rate. Asset Quality W Holding's asset quality continues to be strong, in spite of the Company's continued aggressive loan portfolio growth, as measured by our reserves to total loans, non-performing loans as a percentage of total loans and net charge-offs to average loans. W Holding is essentially a secured lender having 83% of its loan portfolio as of December 31, 2004, secured by real estate. Our combined delinquency on all portfolios for the categories of 60 days and over continues to be below our benchmark of 1% for both periods, being 0.57% at December 31, 2004, and 0.74% at December 31, 2003, an improvement of 17 basis points from the prior year. The delinquency ratio on the commercial loan portfolio for the categories of 60 days and over, also improved 29 basis points to 0.55% (less than 1%), when compared to 0.84% reported for the year ago period, our lowest delinquency ratio since year 2000. The delinquency ratio on the consumer loan portfolio, including the Expresso of Westernbank loan portfolio, for the categories of 60 days and over increased 14 basis points, to 1.03% at December 31, 2004, when compared to 0.89% for the comparable period last year. Such increase was mainly due to regular consumer loans past due over 90 days which are collateralized by real estate properties. The provision for possible loan losses amounted to $6.6 million for the quarter ended December 31, 2004, slightly up from $6.3 million for the same period in the previous year, an increase of $220,000 or 3.47%. Even though the loan portfolio grew between periods, this slight increase was attributed to lower net charge offs during the 2004 fourth quarter. For the year ended December 31, 2004, the provision for possible loan losses amounted to $36.7 million, up from $27.0 million for the year ended December 31, 2003, an increase of $9.6 million or 35.65% The allowance for possible loan losses reached $80.1 million as of December 31, 2004. The increase in the provision for loan losses is attributable to the overall growth in the Company's loan portfolio, particularly those of its commercial real estate loans portfolio, the loan portfolio of its asset-based lending division, Westernbank Business Credit, and the provision associated with the loan portfolio of the Expresso of Westernbank. The commercial real estate loan portfolio grew to $3.2 billion at December 31, 2004, an increase of $893.2 million or 39.50%, when compared to December 31, 2003. Westernbank Business Credit loan portfolio grew to $831.1 million at December 31, 2004, an increase of $192.5 million or 30.15%, when compared to December 31, 2003. The Expresso of Westernbank loan portfolio decreased from $150.4 million at December 31, 2003, to $144.0 million at December 31, 2004, a decrease of $6.5 million or 4.30%. The decrease in the Expresso of Westernbank loan portfolio was mainly due to management's strategy of stabilizing charge-offs as the division portfolio matures and average yields continue to increase. The average yields of Westernbank Business Credit and the Expresso of Westernbank loan portfolios were 6.21% and 20.34%, respectively, for the year ended December 31, 2004. Non-performing loans stand at $34.3 million or 0.57% (less than 1%) of Westernbank's loan portfolio at December 31, 2004, an improvement of 9 basis points when compared to 0.66% reported at December 31, 2003. In absolute amounts, non-performing loans increased by $3.0 million, from $31.2 million as of December 31, 2003. The increase in non-performing loans primarily comes from the Company's commercial and regular consumer loan portfolios. Non- performing loans on the commercial loan portfolio increased by $1.3 million, when compared to December 31, 2003. This increase is mostly attributed to one commercial loan with a principal balance of $1.5 million, collateralized by real estate. At December 31, 2004, this loan did not require a valuation allowance. At December 31, 2004, the allowance for possible loan losses was 233.64% of total non-performing loans (reserve coverage), compared to the 197.17% reported at December 31, 2003. Moreover, of the total allowance of $80.1 million, $8.9 million is for our specific allowance and the remaining $71.2 million is for our general allowance. Net loans charge-off in the fourth quarter of 2004 were $3.1 million or 0.21% (annualized) to average loans, compared to $3.9 million or 0.33% to average loans for the same period in 2003, an decrease of $792,000. For the year ended December 31, 2004, net charge-offs amounted to $18.2 million or 0.34% to average loans, an increase of $5.7 million, when compared to $12.6 million or 0.29% to average loans in 2003. The decrease in net loans charge-off for the fourth quarter of 2004 when compared to the same quarter in 2003, is principally attributed to lower net charge-offs of consumer loans. The increase for the full year is primarily due to loans charged-off in the ordinary course of business, mainly in our consumer loan portfolio. The increase in consumer loans charged-off for the year ended December 31, 2004, was principally due to loans charged-off by the Expresso of Westernbank division, which amounted to $12.4 million for the year ended December 31, 2004, when compared to $7.9 million for the year ago period. On a linked quarter comparison, loans charged-off by the Expresso of Westernbank division continued its decreasing trend from $3.2 million for the third quarter of 2004, to $2.5 million for the fourth quarter of 2004. The delinquency ratio of the Expresso of Westernbank division portfolio at December 31, 2004, was 1.88% for the categories of 60 days and over. This ratio is slightly above management's estimate and accordingly, management is emphasizing an increase in the overall yield charged on such loans, continuously revising its underwriting policies, as well as increasing the level of collateralized loans, to compensate for such higher delinquency. Efforts in this regard have resulted in a decreasing trend in net charge offs during the last three quarters as measures begins to yield positive results. Also, the loan portfolio of Expresso of Westernbank collateralized by real estate at December 31, 2004, accounts for 12% of the outstanding balance, attaining our goal of having at least 10% of the Expresso loan portfolio collateralized by real estate. Total Loans, Investments and Deposits Loans receivable-net, grew $1.3 billion or 26.86%, to $5.9 billion at December 31, 2004, compared to $4.7 billion at December 31, 2003. This increase reflects the Company's emphasis on continued growth in its loan portfolio through commercial real estate, other commercial asset-based, consumer and construction lending. As a result, the portfolio of real estate loans secured by first mortgages, increased from $3.4 billion as of December 31, 2003, to $4.4 billion as of December 31, 2004, up by $1.0 billion or 30.60%. Commercial real estate loans secured by first mortgages increased from $2.3 billion as of December 31, 2003, to $3.2 billion as of December 31, 2004, an increase of $893.2 million or 39.50%. Other loans portfolio, including commercial loans not collateralized by real estate, consumer loans (including the Expresso of Westernbank loans portfolio), loans on deposits and credit cards, increased from $1.4 billion as of December 31, 2003, to $1.6 billion as of December 31, 2004, up by $248.8 million or 17.95%. The unsecured portion of the Expresso of Westernbank loan portfolio remained relatively unchanged increasing by $3.1 million or 2.40%, from $128.9 million at December 31, 2003, to $132.0 million at December 31, 2004, as management has sought to stabilize charge offs as the portfolio matures and average yields continue to increase. Attached as Exhibit IV is a supplemental unaudited data schedule providing additional information on W Holding loan portfolio. W Holding investment portfolio, excluding short-term money market instruments, stands at $6.9 billion at December 31, 2004, growing $1.2 billion or 19.91% in comparison to December 31, 2003. Such growth is focused principally on tax-exempt securities guaranteed by the United States Government and agencies, accounting for 98.75% of our investment portfolio as of December 31, 2004. The investment portfolio at December 31, 2004, had an average contractual maturity of 53 months. The Company's interest rate risk model, takes into consideration the callable feature of certain investment securities. Taking into consideration the callable features of these securities, the investment portfolio as of December 31, 2004, had a remaining average maturity of 10 months. However, no assurance can be given that such levels will be maintained in future periods. As of December 31, 2004, total deposits reached $6.2 billion, from $5.4 billion at December 31, 2003, representing an increase of $845.7 million or 15.70%, while federal funds purchased and repurchase agreements increased to $6.7 billion, from $5.0 billion at December 31, 2003, an increase of $1.6 billion or 32.45%, mainly to fund W Holding strong loans portfolio growth of 26.86% and investments growth, excluding short-term money market instruments, of 19.91%. Commenting on the financial results of the Company, and more specifically those of its main subsidiary, Westernbank, Mr. Frank C. Stipes, Esq., Chairman of the Board, President and Chief Executive Officer of both companies, stated, "We are very pleased with our results for 2004 with an excellent combination of continued growth coupled with very strong asset quality. We were able to surpass our goal of $14 billion in total assets at December 31, 2004, achieved our goal of reaching $170 million in net income for the year and above all, we were able to produce such outstanding asset quality with an overall delinquency ratio of 0.57%. Furthermore, our commercial loan portfolio delinquency ratio was an outstanding 0.55% down from the year ago ratio of 0.84% and our lowest delinquency ratio since year 2000. Our consumer loan delinquency continued at an outstanding 1.03% even including our Expresso loans. These numbers are definitely the results of our dedicated, talented and very hard working employees' group and further sustain our view that we can grow at a fast pace while at the same time producing quality growth above our peers both in Puerto Rico and abroad. We have said it before and we are very proud to produce such outstanding results." Mr. Stipes continued saying: "We believe Westernbank is in a position to continue gaining market share in Puerto Rico as it builds out its branch network in the San Juan Metroplex and east coast regions. These plans include the opening in February 2005 of a new mega-branch in Humacao, where it has no presence, and likewise another new mega-branch in the Condado area within the next 120 to 150 days. Concurrently, we will be building five more mega- branches in Hato Rey, Isla Verde, Cupey, Rexville and in Ponce. As we have recently expressed, we also intend to expand and extend our success story into the continental United States in the next 18 to 30 months, where we will be soliciting authorization to conduct business specifically in the states of New York, Massachusetts, Georgia and Florida." Referring to the Company's continued success, Mr. Freddy Maldonado, Chief Financial Officer and Vice President of Finance and Investment of the Company, indicated: "Our Company has had the largest organic loan market share gain in Puerto Rico over the past five years. Year 2004 was not the exception and we intend to keep gaining market share over the coming years. Our consistent level of growth, evidenced by the results reported herewith, is further confirmed by the most recent statistics provided by the Office of the Commissioner of Financial Institutions of Puerto Rico. Westernbank is by far the largest real estate commercial lender in Puerto Rico with an overall market dominance of 38.84%. In regard to overall lending activities, we are the dominant market leader in what is called the NORTHWESTERN region of Puerto Rico, which includes the cities of Mayaguez and Aguadilla, among others, holding 59% of the market; and in the SOUTHWESTERN region, which includes the cities of Ponce and Yauco, among others, holding 51% of the market. In the San Juan metroplex market, which is unquestionably Puerto Rico's richest and most populated, we hold a market share of 8.20%, with enormous growth potential". This press release may contain some information that constitutes "forward- looking statements." Such information can be identified by the use of forward- looking terminology such as "may," "will," "should," "expect," "anticipate," "estimate," "intend," "continue," or "believe" or the negatives or other variations of these terms or comparable terminology. Forward-looking statements with respect to future financial conditions, results of operations and businesses of the Company are always subject to various risk and market factors out of management's control which could cause future results to differ materially from current management expectations or estimates and as such should be understood. Such factors include particularly, but are not limited to, the possibility of prolonged adverse economic conditions or that an adverse interest rate environment could develop. Westernbank Puerto Rico, a wholly owned subsidiary of W Holding Company, Inc., is the second largest commercial bank in Puerto Rico, based on total assets, operating through 52 full-fledged branches, including 33 in the Southwestern region of Puerto Rico, 7 in the Northeastern region, and 12 in the San Juan Metropolitan area of Puerto Rico, and a fully functional banking site on the Internet. W Holding Company, Inc. also owns Westernbank Insurance Corp., a general insurance agent placing property, casualty, life and disability insurance, whose results of operations and financial condition are reported on a consolidated basis. Messrs. Frank C. Stipes, Chief Executive Officer, and Freddy Maldonado, Chief Financial Officer, are available to answer appropriate questions regarding this press release. You may contact any of the above officers at (787) 834-8000; or e-mail , or the web http://www.w-holding.com/. W HOLDING COMPANY, INC. EXHIBIT I FINANCIAL HIGHLIGHTS (UNAUDITED) Three Months Ended December 31, Year Ended December 31, 2004 2003 2004 2003 (Dollars in thousands, except share data) Income Statement and Share Data Interest income: Loans, including loan fees $89,454 $72,626 $322,164 $275,848 Investment securities 58,672 44,946 212,213 134,273 Mortgage and asset-backed securities 8,829 11,003 37,489 40,140 Money market instruments 7,453 3,028 19,510 11,633 Total interest income 164,408 131,603 591,376 461,894 Interest expense: Deposits 41,578 28,769 143,860 114,755 Federal funds purchased and repurchase agreements 44,164 30,040 141,414 101,652 Advances from FHLB 1,947 1,513 6,568 6,037 Other borrowings -- -- -- 142 Total interest expense 87,689 60,322 291,842 222,586 Net interest income 76,719 71,281 299,534 239,308 Provision for loan losses 6,550 6,330 36,691 27,048 Net interest income after provision for loan losses 70,169 64,951 262,843 212,260 Noninterest income: Service charges on deposit accounts 1,996 1,769 7,969 7,053 Other fees and commissions 5,209 5,465 20,642 20,778 Loss on derivative instruments (20) (82) (7) (236) Net gain (loss) on sales and valuation of loans, securities, and other assets 1,762 35 2,629 (20,949) Total noninterest income 8,947 7,187 31,233 6,646 Total net interest income and noninterest income 79,116 72,138 294,076 218,906 Noninterest expenses: Salaries and employees' benefits 10,470 9,032 38,317 33,840 Equipment 2,464 2,330 9,445 9,044 Deposit insurance premium and supervisory examination 795 665 2,907 2,392 Occupancy 1,812 1,680 6,694 6,603 Advertising 1,613 1,715 10,508 6,698 Printing, postage, stationery, and supplies 716 727 3,206 3,253 Telephone 551 572 2,315 2,279 Municipal taxes 1,078 900 3,953 3,600 Other 6,431 6,363 22,780 17,112 Total noninterest expenses 25,930 23,984 100,125 84,821 Income before provision for income taxes 53,186 48,154 193,951 134,085 Provision for income taxes: Current 8,321 8,995 28,182 29,346 Deferred (1,240) 1,016 (6,096) (8,575) Total provision for income taxes 7,081 10,011 22,086 20,771 Net income $46,105 $38,143 $171,865 $113,314 Net income attributable to common stockholders $39,198 $31,318 $144,707 $91,721 Basic earnings per common share $0.24 $0.19(1) $0.89 $0.57(1) Diluted earnings per common share $0.23 $0.19(1) $0.86 $0.55(1) Cash dividends declared per common share (2) $0.04(1) $0.03(1) $0.14(1) $0.11(1) Period end number of common shares outstanding 163,918,835 162,624,150(1) 163,918,835 162,624,150(1) Weighted average number of common shares outstanding 163,743,684 161,821,918(1) 163,347,939 160,734,184(1) Weighted average number of common shares outstanding on a diluted basis 171,035,485 169,905,083(1) 170,443,393 165,329,870(1) Cash dividends declared on: Common stock $5,891 $4,727 $23,502 $18,322 Preferred stock $6,907 $6,825 $27,158 $21,593 (1) Adjusted to reflect the three-for-two stock split and a 2% stock dividend on our common stock declared on December 6, 2004 and December 13, 2004, respectively, and distributed both on January 10, 2005. (2) Cash dividend amounts in the table are rounded. W HOLDING COMPANY, INC. EXHIBIT II FINANCIAL HIGHLIGHTS (UNAUDITED) Dec. 31, Dec. 31, Balance Sheet Data 2004 2003 (In thousands) At Period End Cash and due from banks $77,752 $92,811 Money market instruments: Federal funds sold and resell agreements 1,017,303 649,852 Interest-bearing deposits in banks 49,476 37,767 Investment securities available for sale, at fair value 7,881 55,080 Investment securities held to maturity, at amortized cost 6,921,379 5,723,710 FHLB stock, at cost 52,195 39,750 Mortgage loans held for sale, at lower of cost or fair value 1,633 2,555 Loans - net 5,941,233 4,683,118 Accrued interest receivable 88,285 75,567 Premises and equipment, net 110,051 103,370 Deferred income taxes, net 31,027 24,910 Other assets 38,447 30,950 Total Assets $14,336,662 $11,519,440 Deposits: Noninterest-bearing $249,368 $192,760 Interest-bearing 5,981,843 5,192,716 Total deposits 6,231,211 5,385,476 Federal funds purchased and repurchase agreements 6,683,527 5,046,045 Advances from FHLB 211,000 146,000 Mortgage note 36,858 37,234 Accrued expenses and other liabilities 92,387 76,176 Total Liabilities 13,254,983 10,690,931 Stockholders' equity 1,081,679 828,509 Total Liabilities and Stockholders' Equity $14,336,662 $11,519,440 Quarter to Date Averages (1) Year to Date Averages (1) Dec. 31, Dec. 31, Dec. 31, Dec. 31, Average Balances 2004 2003 2004 2003 (In thousands) Cash and due from banks $83,623 $90,803 $85,281 $84,446 Federal funds sold and resell agreements 848,691 556,565 833,577 554,500 Interest-bearing deposits in banks 50,638 49,585 43,621 27,613 Trading securities -- 1,317 -- -- Investment securities available for sale 10,053 68,461 31,481 107,983 Investment securities held to maturity 6,767,229 5,512,320 6,322,545 4,612,384 FHLB stock 54,650 39,750 45,973 41,536 Due from brokers -- 8,291 -- -- Mortgage loans held for sale 1,673 4,130 2,094 5,000 Loans - net 5,829,082 4,608,498 5,312,175 4,218,738 Accrued interest receivable 83,363 67,407 81,926 61,110 Premises and equipment, net 109,196 102,839 106,711 99,789 Deferred income taxes, net 30,407 25,423 27,968 20,618 Other assets 39,155 30,863 34,699 28,542 Total Assets $13,907,760 $11,166,252 $12,928,051 $9,862,259 Deposits: Noninterest- bearing $245,104 $205,274 $221,064 $174,451 Interest-bearing 5,986,814 4,987,887 5,587,280 4,667,659 Total deposits 6,231,918 5,193,161 5,808,344 4,842,110 Federal funds purchased and repurchase agreements 6,347,631 4,900,791 5,864,786 4,071,693 Advances from FHLB 211,000 146,000 178,500 133,000 Mortgage note 36,909 37,285 37,046 37,528 Securities purchased but not yet received 2,510 -- -- -- Accrued expenses and other liabilities 77,558 75,886 84,281 71,299 Total Liabilities 12,907,526 10,353,123 11,972,957 9,155,630 Stockholders' equity 1,000,234 813,129 955,094 706,629 Total Liabilities and Stockholders' Equity $13,907,760 $11,166,252 $12,928,051 $9,862,259 (1) Average balances have been computed using beginning and period-end balances. W HOLDING COMPANY, INC. EXHIBIT III a YIELDS EARNED AND RATES PAID THREE MONTHS ENDED DECEMBER 31, (UNAUDITED) 2004 Annualized Average Average Interest Balance(1) Yield/ Rate (Dollars in thousands) Normal spread: Interest-earning assets: Loans, including loan fees (2) $89,454 $5,859,661 6.07% Investment securities (3) 58,672 5,889,373 3.96% Mortgage and asset- backed securities (3) 8,829 864,226 4.06% Money market instruments 7,453 883,192 3.36% Total 164,408 13,496,452 4.85% Interest-bearing liabilities: Deposits 41,578 6,241,345 2.65% Federal funds purchased and repurchase agreements 44,164 6,258,052 2.81% Advances from FHLB 1,947 211,000 3.67% Total 87,689 12,710,397 2.74% Net interest income $76,719 Interest rate spread 2.11% Net interest-earning assets $786,055 Net yield on interest-earning assets (4) 2.26% Interest-earning assets to interest-bearing liabilities ratio 106.18% Tax equivalent spread: Interest-earning assets $164,408 $13,496,452 4.85% Tax equivalent adjustment 13,662 -- 0.40% Interest-earning assets - tax equivalent 178,070 13,496,452 5.25% Interest-bearing liabilities 87,689 $12,710,397 2.74% Net interest income $90,381 Interest rate spread 2.51% Net yield on interest - earning assets (4) 2.66% 2003 Annualized Average Average Interest Balance(1) Yield/ Rate (Dollars in thousands) Normal spread: Interest-earning assets: Loans, including loan fees (2) $72,626 $4,614,269 6.24% Investment securities (3) 44,946 4,436,079 4.02% Mortgage and asset- backed securities (3) 11,003 1,122,153 3.89% Money market instruments 3,028 548,181 2.19% Total 131,603 10,720,682 4.87% Interest-bearing liabilities: Deposits 28,769 5,075,144 2.25% Federal funds purchased and repurchase agreements 30,040 4,799,717 2.48% Advances from FHLB 1,513 146,000 4.11% Total 60,322 10,020,861 2.39% Net interest income $71,281 Interest rate spread 2.48% Net interest-earning assets $699,821 Net yield on interest-earning assets (4) 2.64% Interest-earning assets to interest-bearing liabilities ratio 106.98% Tax equivalent spread: Interest-earning assets $131,603 $10,720,682 4.87% Tax equivalent adjustment 8,769 -- 0.32% Interest-earning assets - tax equivalent 140,372 10,720,682 5.19% Interest-bearing liabilities 60,322 $10,020,861 2.39% Net interest income $80,050 Interest rate spread 2.80% Net yield on interest - earning assets (4) 2.96% (1) Average balance on interest-earning assets and interest-bearing liabilities is computed using daily monthly average balances during the periods. (2) Average loans exclude non-performing loans. Loan fees amounted to $2.5 million and $2.4 million for the three-months ended December 31, 2004, and 2003, respectively. (3) Includes trading and available for sale securities. (4) Annualized net interest income divided by average interest-earning assets. W HOLDING COMPANY, INC. EXHIBIT III b YIELDS EARNED AND RATES PAID YEARS ENDED DECEMBER 31, (UNAUDITED) 2004 Average Average Interest Balance(1) Yield/Rate (Dollars in thousands) Normal spread: Interest-earning assets: Loans, including loan fees (2) $322,164 $5,401,955 5.96% Investment securities (3) 212,213 5,400,997 3.93% Mortgage and asset- backed securities (3) 37,489 935,421 4.01% Money market instruments 19,510 745,828 2.62% Total 591,376 12,484,201 4.74% Interest-bearing liabilities: Deposits 143,860 5,909,274 2.43% Federal funds purchased and repurchase agreements 141,414 5,676,595 2.49% Advances from FHLB 6,568 164,245 4.00% Other borrowings -- -- -- Total 291,842 11,750,114 2.48% Net interest income $299,534 Interest rate spread 2.26% Net interest-earning assets $734,087 Net yield on interest-earning assets (4) 2.40% Interest-earning assets to interest-bearing liabilities ratio 106.25% Tax equivalent spread: Interest-earning assets $591,376 $12,484,201 4.74% Tax equivalent adjustment 53,555 -- 0.43% Interest-earning assets - tax equivalent 644,931 12,484,201 5.17% Interest-bearing liabilities 291,842 $11,750,114 2.48% Net interest income $353,089 Interest rate spread 2.69% Net yield on interest - earning assets (4) 2.83% 2003 Average Average Interest Balance(1) Yield/ Rate (Dollars in thousands) Normal spread: Interest-earning assets: Loans, including loan fees (2) $275,848 $4,278,468 6.45% Investment securities (3) 134,273 3,571,299 3.76% Mortgage and asset- backed securities (3) 40,140 998,257 4.02% Money market instruments 11,633 534,444 2.18% Total 461,894 9,382,468 4.92% Interest-bearing liabilities: Deposits 114,755 4,768,490 2.41% Federal funds purchased and repurchase agreements 101,652 3,891,972 2.61% Advances from FHLB 6,037 137,838 4.38% Other borrowings 142 3,698 3.85% Total 222,586 8,801,998 2.53% Net interest income $239,308 Interest rate spread 2.39% Net interest-earning assets $580,470 Net yield on interest-earning assets (4) 2.55% Interest-earning assets to interest-bearing liabilities ratio 106.59% Tax equivalent spread: Interest-earning assets $461,894 $9,382,468 4.92% Tax equivalent adjustment 31,522 -- 0.34% Interest-earning assets - tax equivalent 493,416 9,382,468 5.26% Interest-bearing liabilities 222,586 $8,801,998 2.53% Net interest income $270,830 Interest rate spread 2.73% Net yield on interest - earning assets (4) 2.89% (1) Average balance on interest-earning assets and interest-bearing liabilities is computed using daily monthly average balances during the periods. (2) Average loans exclude non-performing loans. Loan fees amounted to $10.9 million and $8.7 million for the years ended December 31, 2004 and 2003, respectively. (3) Includes trading and available for sale securities. (4) Net interest income divided by average interest-earning assets. W HOLDING COMPANY, INC. EXHIBIT III c CHANGES IN YIELDS EARNED AND RATES PAID (UNAUDITED) Three Months Ended December 31, 2004 vs. 2003 Volume Rate Total (In thousands) Interest income: Loans $18,731 $(1,903) $16,828 Investment securities (1) 14,341 (615) 13,726 Mortgage and asset-backed securities (1) (2,700) 526 (2,174) Money market instruments 2,366 2,059 4,425 Total increase (decrease) in interest income 32,738 67 32,805 Interest expense: Deposits 7,211 5,598 12,809 Federal funds purchased and repurchase agreements 9,877 4,247 14,124 Advances from FHLB 572 (138) 434 Other borrowings -- -- -- Total increase (decrease) in interest expense 17,660 9,707 27,367 Increase (decrease) in net interest income $15,078 $(9,640) $5,438 Year Ended December 31, 2004 vs. 2003 Volume Rate Total Interest income: Loans $64,831 $(18,515) $46,316 Investment securities (1) 71,641 6,299 77,940 Mortgage and asset-backed securities (1) (2,519) (132) (2,651) Money market instruments 5,216 2,661 7,877 Total increase (decrease) in interest income 139,169 (9,687) 129,482 Interest expense: Deposits 27,757 1,348 29,105 Federal funds purchased and repurchase agreements 44,217 (4,455) 39,762 Advances from FHLB 972 (441) 531 Other borrowings (142) -- (142) Total increase (decrease) in interest expense 72,804 (3,548) 69,256 Increase (decrease) in net interest income $66,365 $(6,139) $60,226 (1) Includes trading and available for sale securities. W HOLDING COMPANY, INC. EXHIBIT IV LOANS RECEIVABLE-NET (UNAUDITED) Dec. 31, Dec. 31, 2004 2003 (In thousands) REAL ESTATE LOANS SECURED BY FIRST MORTGAGES: Commercial real estate $3,167,439 $2,269,380 Residential real estate, mainly one-to-four family residences 903,967 894,695 Construction and land acquisition 331,221 207,593 Total 4,402,627 3,371,668 Plus (less): Undisbursed portion of loans in process (3,076) (4,993) Premium on loans purchased 690 1,016 Deferred loan fees - net (14,480) (9,615) Total (16,866) (13,592) Real estate loans - net 4,385,761 3,358,076 OTHER LOANS: Commercial loans 768,845 526,105 Consumer loans: Loans on deposits 29,587 30,805 Credit cards 53,268 54,832 Other 789,095 777,573 Plus (less): Premium on loans purchased 1,337 2,281 Deferred loan fees - net (6,594) (4,946) Other loans - net 1,635,538 1,386,650 TOTAL LOANS 6,021,299 4,744,726 ALLOWANCE FOR LOAN LOSSES (80,066) (61,608) LOANS - NET $5,941,233 $4,683,118 W HOLDING COMPANY, INC. EXHIBIT V NON-PERFORMING LOANS AND FORECLOSED REAL ESTATE HELD FOR SALE (UNAUDITED) December December 31, 2004 31, 2003 (Dollars in thousands) Commercial, industrial and agricultural loans $25,417 $24,142 Consumer loans 7,122 4,845 Residential real estate mortgage and construction loans 1,730 2,259 Total non-performing loans 34,269 31,246 Foreclosed real estate held for sale 3,811 4,082 Total non-performing loans and foreclosed real estate held for sale $38,080 $35,328 Interest that would have been recorded if the loans had not been classified as non-performing $3,557 $2,500 Interest recorded on non-performing loans $243 $583 Total non-performing loans as a percentage of total loans at end of period 0.57% 0.66% Total non-performing loans and foreclosed real estate held for sale as a percentage of total assets at end of period 0.27% 0.31% W HOLDING COMPANY, INC. EXHIBIT VI CHANGE IN ALLOWANCE FOR LOAN LOSSES (UNAUDITED) December December 31, 2004 31, 2003 (Dollars in thousands) Balance, beginning of year $61,608 $47,114 Loans charged-off: Consumer loans (1) (16,473) (12,203) Commercial, industrial and agricultural loans (5,433) (2,479) Real estate-mortgage and construction loans (297) (184) Total loans charged-off (22,203) (14,866) Recoveries of loans previously charged-off: Consumer loans (2) 1,920 799 Commercial, industrial and agricultural loans 1,844 1,141 Real estate-mortgage and construction loans 206 372 Total recoveries of loans previously charged-off 3,970 2,312 Net loans charged-off (18,233) (12,554) Provision for loan losses 36,691 27,048 Balance, end of period $80,066 $61,608 Ratios: Allowance for loan losses to total loans at end of period 1.33% 1.30% Provision for loan losses to net loans charged-off 201.23% 215.45% Recoveries of loans to loans charged- off in previous period 26.71% 29.03% Net loans charged-off to average total loans (3) 0.34% 0.29% Allowance for loan losses to non-performing loans 233.64% 197.17% (1) Includes $12.4 million and $7.9 million of Expresso of Westernbank loans charged-offs for the years ended December 31, 2004 and 2003, respectively. (2) Includes $1.0 million and $17,000 of Expresso of Westernbank recoveries for the years ended December 31, 2004 and 2003, respectively. (3) Average loans were computed using beginning and period-end balances. W HOLDING COMPANY, INC. EXHIBIT VII SELECTED FINANCIAL RATIOS (UNAUDITED) Three Months Ended Year Ended December 31, December 31, 2004 2003 2004 2003 (Dollars in thousands, except share data) Per share data: Dividend payout ratio 15.03% 15.09% 16.24% 19.97% Book value per common share $3.48 $2.73 (2) $3.48 $2.73 (2) Preferred stock outstanding at end of period 17,794,251 15,395,745 17,794,251 15,395,745 Preferred stock equity at end of period $511,744 $384,894 $511,744 $384,894 Performance ratios: Return on average assets (1) 1.33% 1.37% 1.33% 1.15% Return on average common stockholders ' equity (1) 28.31% 29.44% 28.55% 22.79% Efficiency ratio 30.90% 30.55% 30.51% 31.75% Operating expenses to end-of- period assets 0.72% 0.83% 0.70% 0.74% Capital ratios: Total capital to risk- weighted assets 15.70% 14.87% 15.70% 14.87% Tier I capital to risk- weighted assets 14.78% 13.98% 14.78% 13.98% Tier I capital to average assets 7.72% 7.22% 7.72% 7.22% Equity-to- assets ratio 7.54% 7.19% 7.54% 7.19% Other selected data: Total trust assets managed $398,709 $326,527 $398,709 $326,527 Branch offices 52 51 52 51 Number of employees 1,252 1,092 1,252 1,092 (1) The return on average assets is computed by dividing net income by average total assets for the period. The return on average common stockholders' equity is computed by dividing net income less preferred stock dividends by average common stockholders' equity. Average balance have been computed using beginning and period-end balances. (2) Adjusted to reflect the three-for-two stock split and a 2% stock dividend on our common stock declared on December 6, 2004 and December 13, 2004, respectively, and distributed both on January 10, 2005. DATASOURCE: W Holding Company, Inc. CONTACT: Frank C. Stipes, Chief Executive Officer, or Freddy Maldonado, Chief Financial Officer, both of W Holding Company, Inc., +1-787-834-8000 Web site: http://www.wbpr.com/

Copyright

1 Year W.h. Ireland Chart

1 Year W.h. Ireland Chart

1 Month W.h. Ireland Chart

1 Month W.h. Ireland Chart

Your Recent History

Delayed Upgrade Clock