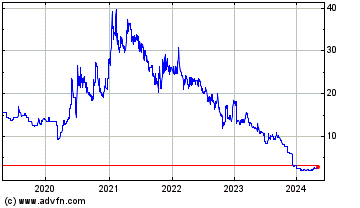
Landore Resources (LSE:LND)
Historical Stock Chart
From Jan 2020 to Jan 2025
Delaware Investments Announces Quarterly Updates for Ten Closed-End Funds
PHILADELPHIA, Dec. 15 /PRNewswire-FirstCall/ -- Delaware Investments presents
the following information:
Fund Information Update
Lincoln National Income Fund
Fund Information *
NYSE Symbol LND
NAV $14.190
Market Price $13.350
Premium/(Discount) -5.92%
Total Net Assets (000) $143,292
Common Shares Outstanding 7,281,092
Inception Date November 10, 1972
% Leveraged to Total Net Assets 27.92%
Dividends** Paid Quarterly
Dividend Declared $0.265
Ex-Dividend Date October 15, 2003
Record Date October 11, 2003
Payment Date October 25, 2003
Total Distributions 2002 $1.17
Total Distributions 2001 $0.76
Total Distributions 2000 $0.91
Total Distributions 1999 $0.99
Total Distributions 1998 $1.04
Total Distributions 1997 $0.95
Total Distributions 1996 $1.21
Total Distributions 1995 $0.84
Total Distributions 1994 $1.28
Asset Allocation* % of Total Net Assets
Public Preferred 1.56%
Public Debt 94.35%
Private Debt 3.78%
Short Term 0.91%
Other Assets/(Liabilities) -0.60%
Portfolio Statistics*
Average Coupon Rate 6.59%
Average Maturity 12.51
Dividend Yield (annualized) 7.94%
Quality Breakdown* % of Total Net Assets
AAA 8.54%
AA 9.88%
A 23.22%
BBB 37.22%
BB 9.56%
B 7.05%
CCC+ or Lower 0.70%
Not Rated 3.83%
Top 5 Sectors* % of Total Net Assets
Financials 36.99%
Miscellaneous 24.32%
Utilities- Electric, Gas, Other 16.79%
Foreign Bonds 9.89%
Energy 7.90%
Top Ten Holdings* % of Total Net Assets
U.S. TREASURY NOTE 2.57%
UFJ FINANCE ARUB 2.57%
FORD MOTOR 1.91%
GMAC 1.88%
ILLINOIS ST TXBL 1.71%
CAPITAL ONE BANK 1.71%
CENTAUR FUNDING PFD 1.71%
GOLDMAN SACHS 1.70%
SPRINT CAP 1.62%
REPUBLIC OF SOUTH AFRICA 1.49%
*Data as of September 30, 2003
**Data as of October 31, 2003
Lincoln National Convertible Securities Fund
Fund Information *
NYSE Symbol LNV
NAV $14.150
Market Price $12.9800
Premium/(Discount) -8.27%
Total Net Assets (000) $82,508
Shares Outstanding 5,832,823
Inception Date June 19, 1986
Leverage No
Dividends** Paid Quarterly
Dividend Declared $0.250
Ex-Dividend Date October 15, 2003
Record Date October 11, 2003
Payment Date October 25, 2003
Total Distributions 2002 $0.930
Total Distributions 2001 $0.778
Total Distributions 2000 $0.88
Total Distributions 1999 $0.86
Total Distributions 1998 $0.96
Total Distributions 1997 $1.00
Total Distributions 1996 $0.98
Total Distributions 1995 $0.96
Total Distributions 1994 $1.08
Asset Allocation* % of Total Net Assets
Convertible Bonds 55.49%
Convertible Preferred Stock 29.26%
Common Stock 9.34%
Preferred Stock 0.00%
Short-Term Investments 6.18%
Other Assets/(Liabilities) -0.27%
Portfolio Statistics*
Average Coupon Rate 3.13%
Average Maturity 9.45
Dividend Yield (annualized) 7.70%
Quality Breakdown* % of Total Net Assets
AAA 0.00%
AA 3.15%
A 10.19%
BBB 26.74%
BB 4.06%
B and Lower 27.72%
Not Rated 12.89%
Equities 15.25%
Top 5 Sectors* % of Total Net Assets
Retail 11.31%
Insurance 8.82%
Pharmaceuticals 7.77%
Media 6.79%
Electric 5.63%
Top Ten Holdings* % of Total Net Assets
AMKOR TECHNOLOGY 3.50%
CHUBB CNV PFD 2.92%
MEDIACOM COMMUNICATIONS 2.91%
WASHNGTN MUT 5.375% 2.82%
EASYLINK - (RESTRICTED) 2.75%
GENERAL MILLS CNV 2.59%
SCHOOL SPECIALTY CNV 2.49%
TOWER AUTO 6.75% CNV PFD 2.47%
CENTERPOINT ENERGY CNV 2.35%
SOVEREIGN BANCORP 2.32%
*Data as of September 30, 2003
**Data as of October 31, 2003
Fund Information Update
Delaware Investments Arizona Municipal Income Fund (VAZ)
Fund Information*
Net Asset Value $15.26
Market Price $15.45
Premium (Discount) 1.25%
Total Net Assets $70.5 million
Shares Outstanding 2,982,200
Inception Date February 26, 1993
% Leveraged to Total Net Assets 35.46%
Dividends** Paid Monthly
Last Dividend Declared $0.080000
Ex-Dividend Date October 15, 2003
Record Date October 11, 2003
Payment Date October 25, 2003
YTD Distributions $0.7200
Total Distributions 2002 $0.9100
Total Distributions 2001 $0.8000
Total Distributions 2000 $0.7725
Total Distributions 1999 $0.7725
Total Distributions 1998 $0.7725
Undistributed Income* $1,117,400
Call Schedule*
2003 0.00%
2004 1.00%
2005 4.06%
2006 3.50%
2007 7.14%
Portfolio Statistics*
Average Effective Maturity
8.57 years
Average Duration 6.37 years
Average Coupon 5.41%
Average Price $104.97
Percentage AMT 9.99%
Current Yield (NAV) 6.29%
Current Yield (Market) 6.21%
Credit Quality*
AAA 72.69%
AA 10.66%
A 11.38%
BBB 5.28%
BB 0.00%
Top Holdings*
Puerto Rico Hwy D 5.00% 7/1/2032 12.35%
PR Infrastructure A 5.50% 10/1/2040 6.92%
Glendale Ariz Muni Pty 5.00% 7/1/2033 4.97%
Maricopa County Sch Dist #6 5.375% 7/1/2013 4.90%
Ariz Trans Highway Rev 5.75% 7/1/2018 3.91%
Top Sectors*
Territorial Revenue 22.17%
Hospitals 18.27%
School Districts 14.06%
Miscellaneous 11.23%
Escrowed to Maturity 10.72%
Delaware Investments Colorado Insured Municipal Income Fund (VCF)
Fund Information*
Net Asset Value $15.86
Market Price $16.05
Premium (Discount) 1.20%
Total Net Assets $116.7 million
Shares Outstanding 4,837,100
Inception Date July 29, 1993
% Leveraged to Total Net Assets 34.28%
Dividends** Paid Monthly
Last Dividend Declared $0.080000
Ex-Dividend Date October 15, 2003
Record Date October 11, 2003
Payment Date October 25, 2003
YTD Distributions $0.7200
Total Distributions 2002 $0.9100
Total Distributions 2001 $0.8025
Total Distributions 2000 $0.7350
Total Distributions 1999 $0.7350
Total Distributions 1998 $0.7350
Undistributed Income* $1,961,922
Call Schedule*
2003 0.00%
2004 5.84%
2005 2.67%
2006 11.76%
2007 6.87%
Portfolio Statistics*
Average Effective Maturity 6.36 years
Average Duration 5.19 years
Average Coupon 5.41%
Average Price $106.28
Percentage AMT 0.00%
Current Yield (NAV) 6.05%
Current Yield (Market) 5.98%
Credit Quality*
AAA 100.00%
AA 0.00%
A 0.00%
BBB 0.00%
BB 0.00%
Top Holdings*
Denver Co City & Cnty Arpt 5.25% 11/15/2023 6.76%
Denver Co City & Cnty 5.00% 9/1/2020 5.84%
Co Springs Revenue 5.375% 6/1/2032 4.51%
N W Parkway SR-Series A 5.25% 6/15/2041 4.43%
Boulder Dev Univ of Co 5.00% 9/1/2026 3.92%
Top Sectors*
Higher Education 34.74%
Municipal Lease 22.11%
School District 17.42%
Turnpike/Toll Roads 13.50%
Dedicated Tax and Fees 11.25%
Delaware Investments Florida Insured Municipal Income Fund (VFL)
Fund Information*
Net Asset Value $16.21
Market Price $15.40
Premium (Discount) -5.00%
Total Net Assets $59.3 million
Shares Outstanding 2,422,200
Inception Date February 26, 1993
% Leveraged to Total Net Assets 33.75%
Dividends** Paid Monthly
Last Dividend Declared $0.085000
Ex-Dividend Date October 15, 2003
Record Date October 11, 2003
Payment Date October 25, 2003
YTD Distributions $0.7250
Total Distributions 2002 $0.9100
Total Distributions 2001 $0.7845
Total Distributions 2000 $0.7575
Total Distributions 1999 $0.7575
Total Distributions 1998 $0.7575
Undistributed Income* $1,027,015
Call Schedule*
2003 0.00%
2004 0.00%
2005 14.32%
2006 41.50%
2007 3.64%
Portfolio Statistics*
Average Effective Maturity 5.75 years
Average Duration 4.50 years
Average Coupon 5.66%
Average Price $107.96
Percentage AMT
18.78%
Current Yield (NAV) 6.05%
Current Yield (Market) 6.36%
Credit Quality*
AAA 100.00%
AA 0.00%
A 0.00%
BBB 0.00%
BB 0.00%
Top Holdings*
Escambia FL Sch Cop 5.50% 02/01/2022 9.14%
Escambia Health VHA Prog 5.95% 07/01/2020 5.59%
Orange Co FL-Pub Srvc Tax 6.00% 10/01/2024 5.56%
Sunrise FL Utility System 5.75% 10/01/2026 4.80%
Venice FL Bon Secours 5.60% 08/15/2016 4.49%
Top Sectors*
Hospitals 28.25%
Municipal Leases 23.58%
Housing Multi-family 23.06%
Dedicated Tax and Fees 22.72%
Pre-Refunded 22.44%
Delaware Investments Minnesota Municipal Income Fund (VMN)
Fund Information*
Net Asset Value $15.18
Market Price $15.15
Premium (Discount) -0.20%
Total Net Assets $59.4 million
Shares Outstanding 2,594,700
Inception Date May 1, 1992
% Leveraged to Total Net Assets 33.68%
Dividends** Paid Monthly
Last Dividend Declared $0.080000
Ex-Dividend Date October 15, 2003
Record Date October 11, 2003
Payment Date October 25, 2003
YTD Distributions $0.6800
Total Distributions 2002 $0.8750
Total Distributions 2001 $0.8400
Total Distributions 2000 $0.8450
Total Distributions 1999 $0.9250
Total Distributions 1998 $0.9300
Undistributed Income* $828,742
Call Schedule*
2003 3.95%
2004 7.59%
2005 7.05%
2006 2.38%
2007 2.85%
Portfolio Statistics*
Average Effective Maturity 8.96 years
Average Duration 6.76 years
Average Coupon 5.93%
Average Price $107.84
Percentage AMT 14.72%
Current Yield (NAV) 6.06%
Current Yield (Market) 6.07%
Credit Quality*
AAA 62.48%
AA 11.12%
A 18.11%
BBB 2.85%
BB 5.44%
Top Holdings*
Dakota & Washington Cty 8.375% 9/1/2021 6.33%
So Minn Power Agency 8.96% 1/1/2014 5.34%
Minn Agric Board Rev 6.375% 11/15/2029 4.54%
Minneapolis Airport 5.25% 1/1/2032 4.33%
Western Minn Muni Power Agy 5.000% 1/1/2030 4.28%
Top Sectors*
Public Power 25.46%
Hospitals 20.60%
Escrowed to Maturity 13.16%
School District 13.15%
Housing Multi-Family 10.07%
Delaware Investments Minnesota Municipal Income Fund II (VMM)
Fund Information*
Net Asset Value $15.04
Market Price $15.59
Premium (Discount) 3.66%
Total Net Assets $169.1 million
Shares Outstanding 7,252,200
Inception Date February 26, 1993
% Leveraged to Total Net Assets 35.48%
Dividends** Paid Monthly
Last Dividend Declared $0.085000
Ex-Dividend Date October 15, 2003
Record Date October 11, 2003
Payment Date October 25, 2003
YTD Distributions $0.7250
Total Distributions 2002 $0.9100
Total Distributions 2001 $0.8325
Total Distributions 2000 $0.8175
Total Distributions 1999 $0.8175
Total Distributions 1998 $0.8175
Undistributed Income* $3,507,215
Call Schedule*
2003 6.31%
2004 13.36%
2005 14.27%
2006 7.52%
2007 5.57%
Portfolio Statistics*
Average Effective Maturity 7.27 years
Average Duration 5.34 years
Average Coupon 5.94%
Average Price $106.57
Percentage AMT 16.67%
Current Yield (NAV) 6.52%
Current Yield (Market) 6.29%
Credit Quality*
AAA 55.88%
AA 18.73%
A 15.40%
BBB 1.10%
BB 8.90%
Top Holdings*
Dakota & Washington Cty 8.375% 9/01/2021 4.78%
Bass Brook Minn Poll Cont 6.00% 7/1/2022 4.53%
Duluth Minn EDA Health 6.00% 2/15/2020 3.63%
Minn Agric Health A 5.75% 11/15/2026 3.54%
St. Paul Civic Center 5.55% 11/01/2023 2.54%
Top Sectors*
Hospitals 24.41%
Pre-Refunded 16.31%
Escrowed to Maturity 13.17%
Housing Multi-Family 12.64%
School District 8.31%
Delaware Investments Minnesota Municipal Income Fund III (VYM)
Fund Information*
Net Asset Value $14.31
Market Price $13.96
Premium (Discount) -2.45%
Total Net Assets $41.3 Million
Shares Outstanding 1,837,200
Inception Date October 29, 1993
% Leveraged to Total Net Assets 36.33%
Dividends** Paid Monthly
Last Dividend Declared $0.075000
Ex-Dividend Date October 15, 2003
Record Date October 11, 2003
Payment Date October 25, 2003
YTD Distributions $0.6350
Total Distributions 2002 $0.8150
Total Distributions 2001 $0.7594
Total Distributions 2000 $0.7575
Total Distributions 1999 $0.7575
Total Distributions 1998 $0.7575
Undistributed Income* $762,838
Call Schedule*
2003 6.05%
2004 6.99%
2005 13.04%
2006 13.44%
2007 0.00%
*Data as of September 30, 2003
**Data as of October 31, 2003
Portfolio Statistics*
Average Effective Maturity 8.86 years
Average Duration 6.06 years
Average Coupon 6.00%
Average Price $106.64
Percentage AMT 12.65%
Current Yield (NAV) 6.01%
Current Yield (Market) 6.16%
Credit Quality*
AAA 59.24%
AA 10.08%
A 17.32%
BBB 5.81%
BB 7.55%
Top Holdings*
Univ of Minn Hospital 6.75% 12/1/2016 7.93%
Minn Public Facilities 5.40% 3/1/2015 5.72%
Esko Minn Indpt School Dist 5.75% 4/1/2017 5.54%
Burnsville Minn Mtg Revenue 7.10% 1/1/2030 4.97%
So Minn Power Agency 8.96% 1/1/2014 4.61%
Top Sectors*
Pre-Refunded 18.29%
Hospitals 14.50%
Escrowed to Maturity 12.45%
Public Power 11.94%
Continuing Care/Retirement 11.77%
Fund Information Update
Delaware Investments Dividend and Income Fund, Inc.
Fund Information *
NYSE Symbol DDF
Net Asset Value $11.21
Market Price $11.180
Premium (Discount) -0.27%
Total Net Assets $199,331,761
Shares Outstanding 12,876,300
Inception Date March 26, 1993
% Leveraged to Total Net Assets 27.55%
Dividends* Paid Monthly
Last Dividend Declared $0.08000
Ex-Dividend Date October 15, 2003
Record Date October 11, 2003
Payment Date October 25, 2003
Total Distributions 2002 $0.0815
Total Distributions 2001 $1.5000
Total Distributions 2000 $1.5000
Total Distributions 1999 $1.5000
Total Distributions 1998 $2.2550
Total Distributions 1997 $1.9080
Total Distributions 1996 $1.6250
Total Distributions 1995 $1.1810
Total Distributions 1994 $1.2600
Asset Allocation * % of Total Net Assets
Common Stocks 55.95%
Preferred Stocks 2.98%
Convertible Preferred Stock 4.12%
Foreign Bonds 0.00%
Convertible Bonds 2.94%
Corporate Bonds 30.80%
Short-Term Instruments & Other Assets 3.21%
Credit Quality Breakdown* % of Fixed Income Assets
A 0.16%
AAA 2.49%
B 16.91%
BB 8.64%
BBB 1.93%
CC 0.11%
CCC 5.10%
N/R 64.66%
Common Stock - Top Five Holdings* % of Total Net Assets
DOW CHEMICAL 1.63%
MORGAN STANLEY 1.45%
GENERAL MILLS 1.39%
BANK OF AMERICA 1.34%
STARWOOD HOTELS & RESORTS 1.33%
Convertible Preferred Stocks & Bonds % of Total Net Assets
Top Five Holdings*
NEWELL TRUST CNV PFD 5.25% 1.11%
PUBLIC SERVICE ENTERPRISE GRP 0.82%
NATL AUST BK 7.875% CNV PFD 0.72%
CRESCENT REAL 6.75% CNV PFD 0.64%
NORTHROP GRUMMAN 7.25% CNV PFD 0.52%
Corporate Bonds - Top Five Holdings* % of Total Net Assets
CHARTER COMMUNICATIONS 0.74%
GEORGIA-PACIFIC 0.54%
INSIGHT COMMUNICATIONS 0.46%
UNITED COMPONENT 0.46%
WARNACO INC 144A 0.42%
Top Sectors*
BANKING & FINANCE 11.96%
ENERGY 6.55%
REAL ESTATE 6.11%
UTILITIES 6.02%
HEALTHCARE & PHARMACEUTICALS 5.39%
*Data as of September 30, 2003
**Data as of October 31, 2003
Delaware Investments Global Dividend and Income Fund, Inc.
Fund Information *
NYSE Symbol DGF
Net Asset Value $11.43
Market Price $11.300
Premium (Discount) -1.14%
Total Net Assets $89,412,558
Shares Outstanding 5,985,582
Inception Date March 4, 1994
% Leveraged to Total Net Assets 23.49%
Dividends* Paid Monthly
Last Dividend Declared $0.08000
Ex-Dividend Date October 15, 2003
Record Date October 11, 2003
Payment Date October 25, 2003
Total Distributions 2002 $1.1040
Total Distributions 2001 $1.5000
Total Distributions 2000 $1.5000
Total Distributions 1999 $1.5000
Total Distributions 1998 $1.6450
Total Distributions 1997 $1.7790
Total Distributions 1996 $1.6250
Total Distributions 1995 $1.1928
Total Distributions 1994 $0.9520
Asset Allocation * % of Total Net Assets
US Equity 36.05%
US Fixed Income 19.14%
International Equity 19.05%
International Fixed Income 18.15%
Short-term Instruments & Other Assets 7.60%
Credit Quality Breakdown* % of Fixed Income Assets
A 1.38%
AA 3.57%
AAA 23.11%
B 8.01%
BB 4.02%
BBB 2.18%
CC 0.05%
CCC 2.52%
N/R 55.16%
U.S. Equity -Top Five Holdings* % of Total Net Assets
GENERAL GROWTH PROPERTIES 1.95%
SOVEREIGN BANCORP 1.44%
DOW CHEMICAL 0.93%
MORGAN STANLEY 0.89%
RAMCO-GERSHENSON PROPERTIES 0.89%
Foreign Equity - Top Five Holdings* % of Total Net Assets
HBOS PLC 0.69%
BAYER 0.67%
ROYAL DUTCH PETROLEUM 0.67%
BOOTS GROUP PLC 0.67%
LLOYDS TSB GROUP 0.67%
U.S. Fixed Income - Top Five Holdings* % of Total Net Assets
FANNIE MAE GLOBAL 1.00%
MASCOTECH CNV 0.76%
GAP CNV 144A 0.67%
MERISTAR HOSPITALITY 0.34%
MERCURY INTERACTIVE CNV 144A 0.31%
Foreign Fixed Income
- Top Five Holdings* % of Total Net Assets
DEUTSCHLAND REPUBLIC 2.18%
REPUBLIC OF ITALY 1.80%
KINGDOM OF BELGIUM 1.76%
OESTERREICH KONTROLLBANK 1.59%
CANADA GOVERNMENT 1.52%
Top Five Foreign Countries* % of Total Net Assets
United Kingdom 5.86%
Germany 5.17%
Australia 4.51%
France 3.46%
Italy 2.39%
Top Sectors*
BANKING & FINANCE 13.85%
ENERGY 5.98%
UTILITIES 5.26%
HEALTHCARE & PHARMACEUTICALS 4.44%
FOOD, BEVERAGE & TOBACCO 3.73%
*Data as of September 30, 2003
**Data as of October 31, 2003
DATASOURCE: Delaware Investments
CONTACT: Tom Gariepy of Delaware Investments, +1-215-255-1495
Web site: http://www.delawareinvestments.com/