ADVFN Logo ADVFN

We could not find any results for:
Make sure your spelling is correct or try broadening your search.

Trending Now

Toplists

It looks like you aren't logged in.
Click the button below to log in and view your recent history.

Hot Features

Registration Strip Icon for charts Register for streaming realtime charts, analysis tools, and prices.

HVT Heavitree Brewery Plc

265.00
0.00 (0.00%)
17 Jul 2024 - Closed
Delayed by 15 minutes
Share Name Share Symbol Market Type Share ISIN Share Description
Heavitree Brewery Plc LSE:HVT London Ordinary Share GB0004182506 ORD 5P
  Price Change % Change Share Price Bid Price Offer Price High Price Low Price Open Price Shares Traded Last Trade
  0.00 0.00% 265.00 230.00 300.00 265.00 265.00 265.00 0.00 07:36:31
Industry Sector Turnover Profit EPS - Basic PE Ratio Market Cap
Drinking Places (alcoholic) 7.56M 1.5M 0.2835 9.35 14.01M

Haverty Furniture Reports Results for Second Quarter 2005

02/08/2005 2:06am

PR Newswire (US)


Heavitree Brewery (LSE:HVT)
Historical Stock Chart


From Jul 2019 to Jul 2024
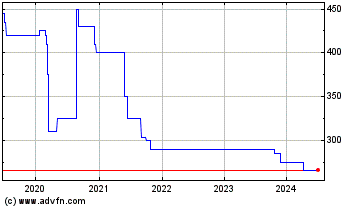
Click Here for more Heavitree Brewery Charts.
Haverty Furniture Reports Results for Second Quarter 2005 ATLANTA, Aug. 1 /PRNewswire-FirstCall/ -- HAVERTY FURNITURE COMPANIES, INC. (NYSE: HVT; HVT.A) today reported earnings for the second quarter ended June 30, 2005. Net income for the second quarter was $1.3 million or $0.06 per diluted share of Common Stock, as compared to the second quarter 2004 net income of $3.6 million or $0.16 per diluted share of Common Stock. For the six months ended June 30, 2005, net income was $4.5 million or $0.20 per diluted share of Common Stock versus net income of $9.7 million or $0.42 per diluted share of Common Stock for the same period in 2004. Net sales for the second quarter of 2005 were $192.4 million, an increase of 7.1% over sales of $179.6 million for the corresponding quarter in 2004. As previously reported, comparable-store sales increased 2.3% for the quarter. Clarence H. Smith, president and chief executive officer, said, "We noted in our June sales release that our second quarter earnings would be significantly below the prior year's quarter. These disappointing results were due to weak sales during May and June and exacerbated by the increased fixed costs associated with our distribution system. We believe that sales for big- ticket furniture items have been hampered by a number of factors including: rising fuel costs, continued negative impressions concerning the economy in the media, and heavy promotional activity by the automobile industry. Our marketing and merchandising teams have developed a slightly more promotional strategy for implementation in the second half of the year to more aggressively compete for our customers' dollars. We believe that we will have improvement in our gross profit margins during the third and fourth quarters as all of the planned closures of local market warehouses and related inventory liquidations have been completed. "Our second quarter total SG&A costs have risen sharply compared to last year but decreased 4.6% from the first quarter level. Second quarter sales, normally the seasonally weakest of the year, fell 7.3% on a sequential quarter basis, more than is typical. The distribution system that we now operate is effective but the fixed costs are higher. To properly leverage these costs we must generate greater sales volume and not fall short of the sales we are staffed and scheduled to serve. Our operations team is now able to assess the fully functional consolidated distribution system, and we expect to make certain refinements, reducing costs where possible. We anticipate that our total SG&A expenses for the second half will be at or slightly below last year's second half costs as a percent of sales if we can achieve a total sales increase of approximately seven percent. "We are pleased to announce that Steven Langer has joined our team as Assistant Vice President, Supply Chain. He has developed considerable expertise in this field during his career working with global companies such as Georgia Pacific and Delta Airlines. Product flow is a key area of importance to us as we source from Asia and other parts of the world and expand to new markets. Steven fills the vacancy left by the retirement of a senior member of our team. "Actual net sales for July 2005 will be announced on Thursday, August 4th. Preliminary figures show sales of approximately $66.6 million, 5.5% below July last year in total and 8.8% lower on a comparable-store basis. Written orders in July were up approximately 3.2% in total versus last year with comps off 1%. The July 4th holiday weekend was disappointing, but written orders on a comp basis were modestly positive for the remainder of July. "There was one less delivery day in July this year as compared to last year which impacted total sales by an estimated 4%. Comp-store sales for July last year were up 9.9%, so the comparison was difficult. Comp-store sales for August and September last year were down 4.1% and 8.4% respectively, largely due to disruptions from four hurricanes, so the comparisons should be much easier. "During the fourth quarter we will be opening stores near Castleton Mall in Indianapolis, IN and by the Polaris Mall in Columbus, OH, both new markets for Havertys. Two older stores in Shreveport, LA will be replaced with a single, better-located showroom, and we will be expanding our Woodbridge, VA store in our growing presence in the Washington, DC metro market. We have decided to close our older, underperforming store on Airport Boulevard in Austin, TX in October and have a contract to sell the property for a profit. We are looking for a second store in Austin in the growing southwestern suburbs to compliment our beautiful store in the Lakeline Mall shopping district north of the city. The opening of our Ft. Lauderdale, FL store in the Sawgrass Mall area has been moved to early 2006. "Other new stores planned for 2006 include: Port Charlotte, FL, another new city for Havertys in the first quarter; a new store in the southeastern suburbs of Atlanta, GA near Stonecrest Mall in the second quarter; and in the third quarter, a new showroom in the Cedar Hill shopping area south of Dallas, TX," Smith concluded. Havertys is a full-service home furnishings retailer with 118 showrooms in 16 southern and central states providing its customers with a wide selection of quality merchandise in middle- to upper-middle price ranges. Additional information is available on the Company's website at htp://www.havertys.com. This release includes forward-looking statements, which are subject to risks and uncertainties. Factors that might cause actual results to differ materially from future results expressed or implied by such forward-looking statements include, but are not limited to, general economic conditions, the consumer spending environment for large ticket items, competition in the retail furniture industry and other uncertainties detailed from time to time in the Company's reports filed with the SEC. The company will sponsor a conference call Tuesday, August 2, 2005 at 10:00 a.m. Eastern Daylight Time to review the second quarter. Listen-only access to the call is available via the web at havertys.com (For Investors) and at streetevents.com (Individual Investor Center), both live and for a limited time, on a replay basis. Condensed Consolidated Statements of Income (Amounts in thousands except per share data) (Unaudited) Quarter Ended Six Months Ended June 30, June 30, 2004 2004 2005 (as restated(1)) 2005 (as restated(1)) Net sales $192,394 $179,614 $400,027 $369,915 Cost of goods sold 95,310 88,960 198,334 181,299 Gross profit 97,084 90,654 201,693 188,616 Credit service charges 875 1,163 1,865 2,467 Gross profit and other revenue 97,959 91,817 203,558 191,083 Expenses: Selling, general and administrative 95,249 85,149 195,138 174,151 Interest, net 397 964 1,298 2,089 Provision for doubtful accounts 311 198 517 329 Other expense (income), net 20 (264) (439) (853) Total expenses 95,977 86,047 196,514 175,716 Income before income taxes 1,982 5,770 7,044 15,367 Income taxes 673 2,124 2,561 5,675 Net income $1,309 $3,646 $4,483 $9,692 Basic earnings per share, net income(1): Common Stock $0.06 $0.16 $0.20 $0.44 Class A Common Stock $0.05 $0.15 $0.19 $0.41 Diluted earnings per share, net income(1): Common Stock $0.06 $0.16 $0.20 $0.42 Class A Common Stock $0.05 $0.15 $0.19 $0.40 Weighted average shares - basic Common Stock 18,431 18,221 18,403 18,154 Class A Common Stock 4,311 4,343 4,314 4,354 Weighted average shares - assuming dilution: Common Stock 22,913 23,048 22,956 23,116 Class A Common Stock 4,311 4,343 4,314 4,354 Cash dividends per common share: Common Stock $0.0625 $0.0625 $0.125 $0.125 Class A Common Stock $0.0575 $0.0575 $0.115 $0.115 (1) See additional details at the end of this release. Condensed Consolidated Balance Sheets (Amounts in thousands) (Unaudited) December 31, June 30, 2004 2005 (as restated(1)) Assets Cash and cash equivalents $861 $10,122 Auction rate securities -- 5,000 Accounts receivable, net of allowance 86,754 81,132 Inventories, at LIFO cost 110,359 110,812 Other current assets 16,663 23,356 Total Current Assets 214,637 230,422 Accounts receivable, long-term 9,220 9,396 Property and equipment, net 210,322 205,037 Other assets 11,700 12,711 $445,879 $457,566 Liabilities and Stockholders' Equity Notes payable to banks $11,350 $-- Accounts payable and accrued expenses 88,558 100,702 Current portion of long-term debt and capital lease obligations 12,816 20,270 Total Current Liabilities 112,724 120,972 Long-term debt and capital lease obligations 37,982 44,228 Other liabilities 19,662 20,108 Stockholders' equity 275,511 272,258 $445,879 $457,566 (1) See additional details at the end of this release. Condensed Consolidated Statements of Cash Flows (Amounts in thousands) (Unaudited) Six Months Ended June 30, 2004 2005 (as restated(1)) Operating Activities Net Income $4,483 $9,692 Adjustments to reconcile net income to net cash provided by operating activities: Depreciation and amortization 10,524 9,452 Provision for doubtful accounts 517 329 Loss on sale of property and equipment 32 94 Other 830 126 Changes in operating assets and liabilities (11,443) (14,095) Net cash provided by operating activities 4,943 5,598 Investing Activities Capital expenditures (15,937) (10,835) Purchases of auction rate securities -- (15,000) Proceeds from sale of auction rate securities 5,000 -- Proceeds from sale of property and equipment 96 911 Other investing activities 1,209 2,196 Net cash used in investing activities (9,632) (22,728) Financing Activities Net increase in borrowings under revolving credit facilities 11,350 -- Payments on long-term debt and capital lease obligations (13,700) (6,650) Proceeds from exercise of stock options 576 1,792 Dividends paid (2,798) (2,768) Net cash used in financing activities (4,572) (7,626) Decrease in cash and cash equivalents (9,261) (24,756) Cash and cash equivalents at beginning of period 10,122 31,591 Cash and cash equivalents at end of period $861 $6,835 (1) See additional details at the end of this release. Restatement Results for the six months ended June 30, 2005 and the Condensed Consolidated Balance Sheets as of December 31, 2004, included herein, have been restated in connection with the Company's review of its lease accounting as reported in its Form 10-K/A filed on June 27, 2005. The impact of the adjustments is outlined below for the periods noted (in thousands, except per share data): Quarter Ended Six Months Ended June 30, 2004 June 30, 2004 as previously as as previously as Income statement data reported restated reported restated Selling, general and administrative $84,946 $85,149 $173,737 $174,151 Income before income taxes 5,973 5,770 15,781 15,367 Income taxes 2,228 2,124 5,886 5,675 Net income 3,745 3,646 9,895 9,692 Diluted earnings per share - Common Stock $0.16 $0.16 $0.43 $0.42 As of December 31, 2004 as previously as Balance sheet data reported restated Accounts payable and accrued expenses, including customer deposits $105,826 $100,702 Other liabilities (long term) 13,286 20,108 Stockholders' equity 273,956 272,258 The liability for accrued straight-line rent has been reclassified from current to long-term in connection with the restatement in recognition of the portion which will be realized in periods beyond one year. Earnings per Share The following details how the number of shares in calculating the diluted earnings per share for Common Stock are derived under SFAS 128 and EITF 03-6 (shares in thousands): Quarter Ended Six Months Ended June 30 June 30 2005 2004 2005 2004 Common Stock: Weighted-average shares outstanding 18,431 18,221 18,403 18,154 Assumed conversion of Class A Common shares 4,311 4,343 4,314 4,354 Dilutive options and awards 171 484 239 608 Total weighted-average diluted common shares 22,913 23,048 22,956 23,116 The amount of earnings used in calculating diluted earnings per share of Common Stock is equal to net income since the Class A shares are assumed to be converted. Diluted earnings per share of Class A Common Stock includes the effect of dilutive common stock options which reduces the amount of undistributed earnings allocated to the Class A Common Stock. Contact: Dennis L. Fink, EVP & CFO or Jenny Hill Parker, VP, Secretary & Treasurer 404-443-2900 DATASOURCE: Haverty Furniture Companies, Inc. CONTACT: Dennis L. Fink, EVP & CFO, or Jenny Hill Parker, VP, Secretary & Treasurer, of +1-404-443-2900 Web site: http://www.havertys.com/

Copyright

1 Year Heavitree Brewery Chart

1 Year Heavitree Brewery Chart

1 Month Heavitree Brewery Chart

1 Month Heavitree Brewery Chart

Your Recent History

Delayed Upgrade Clock