ADVFN Logo ADVFN

We could not find any results for:
Make sure your spelling is correct or try broadening your search.

Trending Now

Toplists

It looks like you aren't logged in.
Click the button below to log in and view your recent history.

Hot Features

Registration Strip Icon for alerts Register for real-time alerts, custom portfolio, and market movers

CNCT Connect Group Plc

25.60
0.00 (0.00%)
26 Jul 2024 - Closed
Delayed by 15 minutes
Share Name Share Symbol Market Type Share ISIN Share Description
Connect Group Plc LSE:CNCT London Ordinary Share GB00B17WCR61 ORD 5P
  Price Change % Change Share Price Bid Price Offer Price High Price Low Price Open Price Shares Traded Last Trade
  0.00 0.00% 25.60 25.70 25.80 0.00 01:00:00
Industry Sector Turnover Profit EPS - Basic PE Ratio Market Cap
0 0 N/A 0

180 Connect Inc. announces third quarter 2007 results

13/11/2007 9:00pm

PR Newswire (US)


Connect (LSE:CNCT)
Historical Stock Chart


From Jul 2019 to Jul 2024
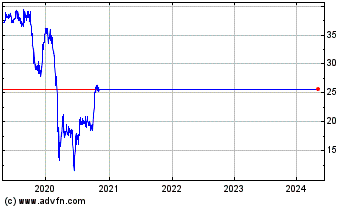
Click Here for more Connect Charts.
------------------------------------------------------------------------- Revenue increases to a record $102 million, representing a 14% increase from the prior year TORONTO and ENGLEWOOD, CO, Nov. 13 /PRNewswire-FirstCall/ -- 180 Connect Inc. ("180 Connect" or the "Company") (OTCBB: CNCT.OB, CNCTU.OB, CNCTW.OB), one of North America's largest providers of installation, integration and fulfillment services to the home entertainment, communication, and home integration service industries, today released its financial results for the third quarter ended September 30, 2007. Certain information contained in this news release constitutes forward-looking information, including anticipated growth and financial performance. See "Forward-Looking Information". Selected Financial Highlights - Third Quarter Ended September 30, 2007 For the three months ended September 30, 2007 as compared to the three months ended September 30, 2006: Third Quarter Highlights - Revenue grew to $102.5 million, an increase of $12.6 million, or 14.0%, compared to revenue of $89.9 million in 2006. - EBITDA from continuing operations(2) was $8.4 million, an increase of $1.9 million or 30% compared to $6.5 million in 2006. - Total cash provided by operating activities was $0.8 million, an increase of $7.1 million from the cash used by operating activities of $6.3 million in 2006. - Loss from continuing operations was $8.8 million, a decrease of $13.8 million compared to income from continuing operations of $5.0 million in 2006. - Net loss was $8.8 million, a decrease of $13.3 million compared to net income of $4.5 million in 2006. - Net income (loss) per share is as follows: - Net income (loss) from continuing operations was a loss of $(0.43) per share basic and diluted, respectively, compared to net income from continuing operations of $0.34 and $0.32 per share basic and diluted, respectively in 2006. - Net income (loss) was a loss of $(0.43) per share basic and diluted, respectively, compared to net income of $0.30 and $0.29 per share basic and diluted, respectively, in 2006. Peter Giacalone, President and Chief Executive Officer of the Company stated: "These results reflect another quarter of solid internal growth in our satellite and cable businesses, as well as contributions from 180 Network Services and 180 Home. We are particularly excited about the long term growth opportunities that can be realized from the recent projects announced in our Network Services business, representing a backlog of approximately $100 million - a market that is experiencing significant near term growth given current market conditions. The standout result from the completion of the merger with Ad.Venture Partners Inc. is the improved financial strength of the Company. The Company's stronger balance sheet provides the foundation for refinancing the balance of its debt and positions the Company to capitalize on attractive strategic acquisitions." Third Quarter 2007 Highlights Revenue in the third quarter increased to $102.5 million, up from $89.9 million for the same period in 2006. This 14% growth reflects volume increases across-the-board in both the satellite and cable businesses, as well as contributions from 180 Network Services and 180 Home, all of which benefited from a combination of strong internal growth and a disciplined operational management team. DIRECTV volume increased 14% from the prior year, largely attributable to increased high-definition sales and upgrade initiatives as DIRECTV continues to sell more advanced product. The Company is also very pleased to note that DIRECTV was ranked "Highest in Customer Satisfaction among Satellite/Cable TV Subscribers" in the Southern, Western and Eastern regions of the United States, according to the J.D. Power and Associates 2007 Residential Cable/Satellite TV Customer Satisfaction Study. As 180 Connect is the primary service provider for DIRECTV's western region, the Company believes that the award reflects its commitment and ability to deliver exceptional customer service. 180 Connect believes that its satellite business is on track to complete over 2.3 million work orders for DIRECTV alone this year. Cable revenues increased 6% from the prior year, as 180 Connect continues to benefit from solid market growth, increased market share and the Company's ability to leverage its competitive advantages in supporting its customer's triple play initiatives. 180 Network Services revenue increased 37% from the prior year and 180 Connect believes it is well positioned to continue its rapid growth. The Company's significant municipal fiber projects in Boise, Idaho and Ontario, Santa Clara and Shafter, California, currently underway, continue to deliver exceptional margins as well as showcase its capabilities to potential future customers. The Company expects that these projects in addition to recently announced contracts, including the City of Palo Alto, CA and Truckee Donner, CA, will more than double its annual revenues in its 180 Network Services business. 180 Home, 180 Connect's structured wiring business, continues to grow rapidly, with third quarter revenue increasing approximately 58% over the prior year. The Company continues to see significant opportunity to expand this business, as in-home technology has become an increasingly important factor in home buying decisions. EBITDA from continuing operations(2) excluding a non-cash stock based compensation charge of $0.2 million was $8.6 million for the third quarter of 2007, an increase of 33% over results reported for the same period in 2006. For the first nine months of 2007, EBITDA from continuing operations was $14.6 million, an increase of approximately 67% over the first nine months of 2006, on approximately 19% higher revenue. EBITDA from continuing operations(2) excluding US listing costs, restructuring charges and non-cash stock based compensation, for the nine months ended September 30, 2007 was $15.6 million. This increase was primarily due to the growth in work order volume in the Company's satellite and cable businesses, cost savings achieved by implementing better operational controls, as well as increased growth from its Network Services business, partially offset by the impact of higher fuel prices. Seasonally, the third and fourth quarters are the Company's strongest quarters from an EBITDA standpoint, as its customers marketing focus, primarily DIRECTV's NFL Ticket and high definition sales and upgrade initiatives, drive a favorable volume and mix shift in work performed. Looking Forward The Company's continued success in the third quarter was due to a relentless focus on business fundamentals under the leadership of a strong management team. Given the strength in demand across the satellite and cable businesses and the increase in non-operating costs the Company is revising its 2007 revenue guidance to between $380 million to $385 million and EBITDA of between $22.5 million to $23 million representing earnings growth between 63% and 67%. There are four primary factors contributing to the change in EBITDA guidance. First, costs associated with the investment in the quality of the Company's workforce were not offset with its customer's bonus programs. Despite the impact of higher costs, 180 Connect believes that these programs are vital and have been critical in protecting its franchise and maintaining its market share. Second, fuel costs represent a significant cost in the Company's business, with the spike in fuel prices resulting in approximately $750,000 of additional costs for the full year, exceeding its original estimates. The Company is in a constant dialog with its customers regarding these increased costs and will continue to negotiate a surcharge in order to share this burden. Third, the Company's roll out of an enhanced work force management system had a short term effect on efficiency and costs, affecting the Company's margins, however, the Company expects to recover the cost and productivity benefits of this enhanced system over the longer term. Fourth, 180 Network Services division continues to post impressive earning and margins, certain projects previously forecast to contribute in 2007 have been deferred to 2008 due to delays in municipal permitting, developer entitlements, public financing or vendor specifications. Nevertheless, the Company views these as deferrals of the earnings cycle and remains confident they will be delivered in 2008. Summary Results The following is a summary of the Company's selected consolidated financial and operating information for the three and nine months ended September 30, 2007 and 2006 and should be read in conjunction with the accompanying unaudited consolidated financial statements for the three and nine months ended September 30, 2007. The amounts presented below have been reclassified to reflect the adjustments associated with the discontinued operations of the Company. Selected Unaudited Consolidated Financial and Operating Data: Three Months Three Months Ended Ended % Sept 30, 2007 Sept 30, 2006 Change Revenue $102,521,340 $ 89,908,346 14.0% Expenses Direct 89,914,862 78,711,246 14.2% General and administrative 4,054,289 4,712,862 -14.0% Stock-based compensation 227,019 - 100.0% Foreign exchange loss (gain) (72,760) (469) - Restructuring costs - - - Depreciation 3,058,116 3,433,006 -10.9% Amortization of customer contracts 920,376 929,727 -1.0% Interest expense 7,801,006 2,898,538 169.1% (Gain) loss on fair market value of derivatives 887,062 (4,599,330) -119.3% Gain on extinguishment of debt - (1,233,001) -100.0% Other expense 4,379,459 - 100.0% (Gain) loss on sale of assets (7,336) 135,696 -105.4% ------------------------------------------- Income (loss) from continuing operations before income taxes (8,640,753) 4,920,071 -275.6% Income tax expense (recovery) 130,583 (96,965) -234.7% ------------------------------------------- Gain (loss) from continuing operations (8,771,336) 5,017,036 -274.8% Loss from discontinued operations, net of income taxes of nil - (538,899) -100.0% ------------------------------------------- Net income (loss) and total comprehensive income (loss) for the period (8,771,336) 4,478,137 -295.9% ------------------------------------------- ------------------------------------------- Nine Months Nine Months Ended Ended % Sept 30, 2007 Sept 30, 2006 Change Revenue $283,615,672 $239,245,733 18.6% Expenses Direct 254,853,816 216,089,499 17.9% General and administrative 13,802,266 13,933,478 -0.9% Stock-based compensation 227,019 91,214 100.0% Foreign exchange loss (gain) (113,442) 3,033 - Restructuring costs 275,000 392,879 -30.0% Depreciation 8,574,819 10,013,336 -14.4% Amortization of customer contracts 2,761,122 2,789,180 -1.0% Interest expense 14,012,024 6,925,495 102.3% (Gain) loss on fair market value of derivatives 5,576,723 (3,433,755) -262.4% Gain on extinguishment of debt - (1,233,001) -100.0% Other expense 4,379,459 - 100.0% (Gain) loss on sale of assets 491,884 (1,114,467) -144.1% ------------------------------------------- Income (loss) from continuing operations before income taxes (21,225,018) (5,211,158) 307.3% Income tax expense (recovery) 383,027 (58,165) -758.5% ------------------------------------------- Gain (loss) from continuing operations (21,608,045) (5,152,993) 319.3% Loss from discontinued operations, net of income taxes of nil (79,527) (1,876,694) -95.8% ------------------------------------------- Net income (loss) and total comprehensive income (loss) for the period (21,687,572) (7,029,687) 208.5% ------------------------------------------- ------------------------------------------- Per Share data Three Three Nine Nine Months Months Months Months Ended Ended Ended Ended Sept 30, Sept 30, Sept 30, Sept 30, 2007 2006 2007 2006 ------------ ------------ ------------ ------------ Income (loss) from continuing operations: Basic............. $ (0.43) $ 0.34 $ (1.27) $ (0.35) Diluted........... $ (0.43) $ 0.32 $ (1.27) $ (0.35) Net income (loss) for the period: Basic............. $ (0.43) $ 0.30 $ (1.27) $ (0.48) Diluted........... $ (0.43) $ 0.29 $ (1.27) $ (0.48) Weighted average number of shares: Basic............. 20,243,082 14,685,976 17,011,000 14,625,856 Weighted average number of shares: Diluted........... 20,243,082 15,510,667 17,011,000 14,625,856 Selected Consolidated Balance Sheet Data For the period ended: Sept 30, December 31, 2007 2006 ---------------------------- Cash and cash equivalents.................. $ 969,285 $ 2,904,098 Working capital deficit.................... 15,625,580 11,684,299 Total assets............................... 158,370,876 165,443,572 Total debt and capital lease obligations... 51,074,549 73,289,517 Total shareholders' equity................. $ 17,318,538 $ 9,402,081 A copy of the interim unaudited consolidated financial statements of the Company for the three and nine months ended September 30, 2007 are attached to this news release. The Company will be releasing its third quarter report on November 14, 2007 which will be available on EDGAR and the Company's website. Additional information relating to the Company is available on EDGAR at http://www.sec.gov/edgar.shtml, on SEDAR at http://www.sedar.com/ and on the Company's website at http://www.180connect.net/. Non-GAAP Measures: (1) The term "Direct Contribution Margin" ("DCM") consists of revenue less direct expense and excludes general and administrative expense, foreign exchange loss (gain), stock-based compensation, (gain) loss in sale of investments and assets, depreciation, amortization of customer contracts, interest and expense, (gain) loss on fair market value of derivatives, gain on extinguishment of debt, interest expense, and income tax expense (recovery). DCM, as referred to in this news release, is a non-GAAP measure which does not have any standardized meaning prescribed by US GAAP and is therefore unlikely to be comparable to similar measures presented by other issuers. We believe that this term provides a better assessment of the contribution of the field operations dealing directly with our customers' subscribers by eliminating: (1) the general and administrative costs that are not part of the direct costs of generating revenue; (2) the charge for the amortization of customer contracts and depreciation and stock based compensation which are non-cash expense items; and (3) (gain) or loss on sale of assets, (gain) loss on fair market value of derivatives, gain on extinguishment of debt, and other expense, which are not considered to be in the normal course of operating activity. Investors should be cautioned, however, that DCM should not be construed as an alternative to income (loss) from continuing operations determined in accordance with US GAAP as an indicator of our performance. For a reconciliation of DCM to the comparable US GAAP measure, loss from continuing operations, see "Direct Contribution Margin" Following is a reconciliation of DCM to loss from continuing operations: Three Three Nine Nine Months Months Months Months Ended Ended Ended Ended Sept 30, Sept 30, Sept 30, Sept 30, 2007 2006 2007 2006 ------------ ------------ ------------ ------------ Direct contribution margin(1) $12,606,478 $11,197,100 $28,761,856 $23,156,234 General and administrative 4,054,289 4,712,862 13,802,266 13,933,478 Non-cash stock-based compensation 227,019 - 227,019 91,214 Foreign exchange loss (gain) (72,760) (469) (113,442) 3,033 Restructuring costs - - 275,000 392,879 Depreciation 3,058,116 3,433,006 8,574,819 10,013,336 Amortization of customer contracts 920,376 929,727 2,761,122 2,789,180 Interest expense 7,801,006 2,898,538 14,012,024 6,925,495 Gain on extinguishment of debt - (1,233,001) - (1,233,001) (Gain) loss on sale of assets (7,336) 135,696 491,884 (1,114,467) (Gain) loss on change in fair value of derivative liabilities 887,062 (4,599,330) 5,576,723 (3,433,755) Other expense 4,379,459 - 4,379,459 - Income tax expense (recovery) 130,583 (96,965) 383,027 (58,165) ------------ ------------ ------------ ------------ Income (loss) from continuing operations ($8,771,336) $5,017,036 ($21,608,045) ($5,152,993) ------------ ------------ ------------ ------------ ------------ ------------ ------------ ------------ (2) The term "EBITDA from continuing operations" refers to income from continuing operations before deducting depreciation, amortization of customer contracts, (gain) loss in sale assets, interest expense, (gain) loss on fair market value of derivatives, gain on extinguishment of debt, other expense, and income tax expense (recovery). EBITDA from continuing operations, as referred to in this news release, is a non-GAAP measure which does not have any standardized meaning prescribed by US GAAP and is therefore unlikely to be comparable to similar measures presented by other issuers. Management believes that EBITDA from continuing operations provides a better assessment of cash flow from the Company's operations by eliminating: (1) the charge for depreciation, amortization of customer contracts and stock-based compensation, which are non-cash expense items and (2) (gain) or loss on sale of assets, (gain) loss on fair market value of derivatives, gain on extinguishment of debt, and other expense, which are not considered to be in the normal course of operating activity. In addition, financial analysts and investors use a multiple of EBITDA from continuing operations for valuing companies within the same sector, in order to eliminate the differences in accounting treatment from one company to the next. Given that the Company is in a growth stage, we believe the focus on EBITDA from continuing operations gives the investor or reader of the Company's consolidated financial statements and MD&A more insight into the operating capabilities of management and its utilization of the Company's operating assets. Management further believes that EBITDA from continuing operations is also the best metric for measuring the Company's valuation. Investors should be cautioned, however, that EBITDA from continuing operations should not be construed as an alternative to income (loss) from continuing operations determined in accordance with US GAAP as an indicator of the Company's performance. For a reconciliation of EBITDA from continuing operations to the comparable GAAP measure, being income (loss) from continuing operations, see "EBITDA from Continuing Operations." Following is a reconciliation of EBITDA from continuing operations to net loss from continuing operations: Three Three Nine Nine Months Months Months Months Ended Ended Ended Ended Sept 30, Sept 30, Sept 30, Sept 30, 2007 2006 2007 2006 ------------ ------------ ------------ ------------ EBITDA from continuing operations(2) 8,397,930 6,484,707 14,571,013 8,735,630 Depreciation 3,058,116 3,433,006 8,574,819 10,013,336 Amortization of customer contracts 920,376 929,727 2,761,122 2,789,180 Interest expense 7,801,006 2,898,538 14,012,024 6,925,495 Gain on extinguishment of debt - (1,233,001) - (1,233,001) (Gain) loss on sale of assets (7,336) 135,696 491,884 (1,114,467) (Gain) loss on change in fair value of derivative liabilities 887,062 (4,599,330) 5,576,723 (3,433,755) Other expense 4,379,459 - 4,379,459 - Income tax expense (recovery) 130,583 (96,965) 383,027 (58,165) ------------ ------------ ------------ ------------ Income (loss) from continuing operations ($8,771,336) $5,017,036 ($21,608,045) ($5,152,993) ------------ ------------ ------------ ------------ ------------ ------------ ------------ ------------ Conference Call Information A live webcast of 180 Connect Inc.'s third quarter 2007 earnings call will be available at http://www.180connect.net/. The call will begin at 4:30 p.m. EST, November 13, 2007. The dial-in numbers for the call are international dial 617.213.8857 and toll free at 866.831.6267, participant pass code is 81992339. The webcast will be archived on the Company's website and a replay of the call will be available beginning at 6:30 p.m. EST on Tuesday, November 13, 2007 through to 11:59 p.m. EST Tuesday, November 20, 2007. The dial-in numbers for the replay are 617.801.6888 International Dial and toll free at 888.286.8010 pass code 27422392. 180 Connect Inc. 180 Connect Inc. is one of North America's largest providers of installation, integration and fulfillment services to the home entertainment, communications and home integration service industries. With more than 4,000 skilled technicians and 750 support personnel based in over 85 operating locations, 180 Connect is well positioned as the only pure play national residential service provider in the market. 180 Connect shares are traded under the name of 180 Connect Inc. on the OTCBB under the symbols CNCT.OB, CNCTU.OB and CNCTW.OB. Forward-Looking Information This news release contains forward-looking statements which reflect management's expectations regarding the Company's future growth, results of operations, performance and business prospects and opportunities. Statements about the Company's future plans and intentions, results, levels of activity, performance, goals or achievements or other future events constitute forward-looking statements. Wherever possible, words such as "will be", "may", "should", "could", "expect", "plan", "intend", "anticipate", "believe", "estimate", "predict" or "potential" or the negative or other variations of these words, or other similar words or phrases, have been used to identify these forward-looking statements. These statements reflect management's current beliefs and are based on information currently available to management. Forward-looking statements involve significant risk, uncertainties and assumptions. Many factors, including those discussed under section 1A "Risk Factors" of the Report Form 10-Q could cause actual results, performance or achievements to differ materially from the results discussed or implied in the forward-looking statements. These factors should be considered carefully and prospective investors should not place undue reliance on the forward-looking statements. Although the forward-looking statements contained in this news release are based upon what management believes to be reasonable assumptions, the Company cannot assure investors that actual results will be consistent with these forward-looking statements. These forward-looking statements are made as of the date of this news release and the Company assumes no obligation to update or revise them to reflect new events or circumstances, except as required by law. 180 Connect Inc. Consolidated Balance Sheets (in United States Dollars) (Unaudited) As at ---------------------------- September 30, December 31, 2007 2006 ---------------------------- Assets Current Assets Cash and cash equivalents $ 969,285 $ 2,904,098 Accounts receivable (less allowance for doubtful accounts of $1,652,894 and $2,506,637, respectively) 52,009,680 48,934,952 Inventory 18,388,807 15,816,148 Restricted cash 11,859,300 14,503,000 Prepaid expenses and other assets 7,523,344 7,910,255 ---------------------------- TOTAL CURRENT ASSETS 90,750,416 90,068,453 Property, plant and equipment 31,375,700 34,882,890 Goodwill 11,034,723 11,034,723 Customer contracts, net 22,311,634 25,072,756 Deferred tax asset 276,608 - Other assets 2,621,795 4,384,750 ---------------------------- TOTAL ASSETS $158,370,876 $165,443,572 ---------------------------- ---------------------------- Liabilities and Shareholders' Equity Current liabilities Accounts payable and accrued liabilities $ 81,395,821 $ 78,686,245 Current portion of long-term debt 6,817,352 5,967,674 Fair value of derivative financial instruments 8,194,756 4,065,729 Current portion of capital lease obligations 9,968,067 13,033,104 ---------------------------- TOTAL CURRENT LIABILITIES 106,375,996 101,752,752 Income tax liability 387,212 - Long-term debt 18,667,844 32,799,043 Convertible debt - 6,276,584 Capital lease obligations 15,621,286 15,213,112 ---------------------------- TOTAL LIABILITIES 141,052,338 156,041,491 Shareholders' Equity Common stock $.0001 par value; authorized 100,000,000, at September 30, 2007 and December 31, 2006 issued and outstanding shares 25,500,152 and 14,685,976, respectively 2,550 1,469 Paid- in capital 121,698,780 91,871,813 Treasury stock, 500,000 shares and nil at September 30, 2007 and December 31, 2006 respectively (224,019) - Deficit (104,643,803) (82,956,231) Accumulated other comprehensive income 485,030 485,030 ---------------------------- TOTAL SHAREHOLDERS' EQUITY 17,318,538 9,402,081 ---------------------------- TOTAL LIABILITIES AND SHAREHOLDERS' EQUITY $158,370,876 $165,443,572 ---------------------------- ---------------------------- 180 Connect Inc. Consolidated Statements of Operations and Comprehensive Income (Loss) (in United States Dollars) (Unaudited) Three Months Three Months Nine Months Nine Months Ended Ended Ended Ended September 30, September 30, September 30, September 30, 2007 2006 2007 2006 ---------------------------------------------------------- Revenue $102,521,340 $ 89,908,346 $283,615,672 $239,245,733 Expenses Direct expenses 89,914,862 78,711,246 254,853,816 216,089,499 General and administra- tive 4,054,289 4,712,862 13,802,266 13,933,478 Non-cash stock- based compen- sation 227,019 - 227,019 91,214 Foreign exchange loss (gain) (72,760) (469) (113,442) 3,033 Restructur- ing costs - - 275,000 392,879 Depreciation 3,058,116 3,433,006 8,574,819 10,013,336 Amortization of customer contracts 920,376 929,727 2,761,122 2,789,180 Other (income) expense Interest and loan fees 7,801,006 2,898,538 14,012,024 6,925,495 Gain on extinguish- ment of debt - (1,233,001) - (1,233,001) (Gain) loss on sale of investments and assets (7,336) 135,696 491,884 (1,114,467) (Gain) loss on change in fair value of derivative liabilities 887,062 (4,599,330) 5,576,723 (3,433,755) Other expense 4,379,459 - 4,379,459 - ---------------------------------------------------------- Income (loss) from continu- ing opera- tions before income tax expense (8,640,753) 4,920,071 (21,225,018) (5,211,158) Income tax expense (recovery) 130,583 (96,965) 383,027 (58,165) ---------------------------------------------------------- Income (loss) from continu- ing opera- tions (8,771,336) 5,017,036 (21,608,045) (5,152,993) Loss from discontinued operations, net of income taxes of nil - (538,899) (79,527) (1,876,694) ---------------------------------------------------------- Net income (loss) and comprehensive income (loss) for the period $ (8,771,336) $ 4,478,137 $(21,687,572) $ (7,029,687) ---------------------------------------------------------- ---------------------------------------------------------- Net income (loss) per share from continuing operations: Basic $ (0.43) $ 0.34 $ (1.27) $ (0.35) Diluted $ (0.43) $ 0.32 $ (1.27) $ (0.35) Net income (loss) per share: Basic $ (0.43) $ 0.30 $ (1.27) $ (0.48) Diluted $ (0.43) $ 0.29 $ (1.27) $ (0.48) Weighted average number of shares outstand- ing - basic 20,243,082 14,685,976 17,011,000 14,625,856 Weighted average number of shares outstand- ing - diluted 20,243,082 15,510,667 17,011,000 14,625,856 180 Connect Inc. Consolidated Statements of Cash Flows (in United States Dollars) (Unaudited) Three Months Ended Nine Months Ended ---------------------------- ---------------------------- September 30, September 30, September 30, September 30, ------------- ------------- ------------- ------------- 2007 2006 2007 2006 ------------- ------------- ------------- ------------- Cash provided by (used in) the follow- ing activi- ties: Operating Income (loss) from contin- uing opera- tions $ (8,771,336) $ 5,017,036 $(21,608,045) $ (5,152,993) Add (deduct) items not affecting cash: Deprecia- tion and amortiza- tion 3,978,492 4,362,733 11,335,941 12,802,516 Non-cash interest expense 4,680,713 1,008,180 6,865,837 2,124,570 Stock- based compensa- tion 227,019 - 227,019 91,214 Future income taxes - (180,000) - (180,000) Settlement of deriv- ative liability (2,766,573) - (2,766,573) - Gain on extinguish- ment of debt - (1,233,001) - (1,233,001) (Gain) loss on change in fair value of derivative liabili- ties 887,062 (4,599,330) 5,576,723 (3,433,755) (Gain) loss on sale of invest- ments and assets (7,336) 135,696 491,884 (1,114,467) Other 34,067 961 73,993 3,106 Changes in non-cash working capital balances related to operations: Accounts receivable (11,009,290) (13,939,349) (3,074,728) 4,339,502 Inventory (3,624,307) (5,004,743) (2,572,659) 2,522,490 Other current assets (320,110) (419,655) (700,259) (305,961) Insurance premium deposits (3,289,009) (525,317) 1,316,723 (2,827,125) Other assets 918,776 (58,765) (453,287) (38,063) Restricted cash - - 2,643,700 247,366 Accounts payable and accrued liabilities 19,886,709 9,613,919 2,593,371 (6,123,210) Operating cash flows from dis- continued operations - (472,882) (60,507) (1,529,897) ------------- ------------- ------------- ------------- Total cash provided by (used in) operating activities 824,877 (6,294,517) (110,867) 192,292 ------------- ------------- ------------- ------------- Investing Purchase of property, plant and equipment (360,421) (630,210) (2,052,529) (2,091,671) Net proceeds from disposi- tion of investments - - - 1,327,693 ------------- ------------- ------------- ------------- Total cash used in investing activities (360,421) (630,210) (2,052,529) (763,978) ------------- ------------- ------------- ------------- Financing Repayment of capital lease obli- gations (1,755,783) (3,533,928) (9,241,450) (11,378,009) Repayment of long-term debt (7,000,001) - (10,333,336) (7,350,000) Proceeds from share issuance 14,704 - 61,372 259,712 Net proceeds from reverse merger 37,933,165 - 37,933,165 - Issuance costs on reverse merger (6,976,440) - (6,976,440) - Redemption of convert- ible debt (10,393,577) - (10,393,577) - Increase (decrease) in borrow- ings under long-term debt (11,418,105) 1,098,488 (3,993,853) 1,098,488 Issuance costs on long-term debt - (3,414,390) - (3,515,471) Net proceeds from refinancing of vehicles - - 3,470,714 - Proceeds from issuance of convertible debt - - - 10,686,101 Proceeds from refinancing of long-term debt - 42,140,497 - 42,140,497 Extinguishment of long-term debt - (32,863,525) - (32,863,525) Repurchase of common stock (224,019) - (224,019) - Issuance costs paid on convertible debt - - - (1,388,985) ------------- ------------- ------------- ------------- Total cash provided by (used in) financing activities 179,944 3,427,142 302,578 (2,311,192) ------------- ------------- ------------- ------------- Effect of exchange rates on cash and cash equivalents (34,067) (19,892) (73,993) (22,037) ------------- ------------- ------------- ------------- Net increase (decrease) in cash and cash equivalents during the period 610,333 (3,517,477) (1,934,813) (2,904,915) Cash and cash equivalents, beginning of period 358,952 3,966,014 2,904,098 3,353,452 ------------- ------------- ------------- ------------- Cash and cash equivalents, end of period $ 969,285 $ 448,537 $ 969,285 $ 448,537 ------------- ------------- ------------- ------------- ------------- ------------- ------------- ------------- Supplemental cash flow information: Interest paid $ 1,691,880 $ 1,425,122 $ 6,102,000 $ 4,504,060 ------------- ------------- ------------- ------------- ------------- ------------- ------------- ------------- Income taxes paid $ 76,715 $ 228,935 $ 219,298 $ 323,292 ------------- ------------- ------------- ------------- ------------------------------------------------------------------------- ------------------------------------------------------------------------- Supplemental disclosure of non-cash investing and financing transactions: For the nine months ended September 30, 2007 and September 30, 2006, the Company had additional capital lease obligations for vehicles of $3,182,956 and $6,797,554, respectively. DATASOURCE: 180 Connect Inc. CONTACT: please contact the following or visit our website at http://www.180connect.net/. Claudia A. Di Maio, Director Investor Relations, TEL: (866) 995-8888, DIRECT LINE: (416) 930-7710, EMAIL: ; Devlin Lander, Integrated Corporate Relations, TEL.: (415) 292-6855

Copyright

1 Year Connect Chart

1 Year Connect Chart

1 Month Connect Chart

1 Month Connect Chart

Your Recent History

Delayed Upgrade Clock