ADVFN Logo ADVFN

We could not find any results for:
Make sure your spelling is correct or try broadening your search.

Trending Now

Toplists

It looks like you aren't logged in.
Click the button below to log in and view your recent history.

Hot Features

Registration Strip Icon for monitor Customisable watchlists with full streaming quotes from leading exchanges, such as LSE, NASDAQ, NYSE, AMEX, Bovespa, BIT and more.

COA Coats Group Plc

87.60
-0.90 (-1.02%)
19 Jul 2024 - Closed
Delayed by 15 minutes
Share Name Share Symbol Market Type Share ISIN Share Description
Coats Group Plc LSE:COA London Ordinary Share GB00B4YZN328 ORD 5P
  Price Change % Change Share Price Bid Price Offer Price High Price Low Price Open Price Shares Traded Last Trade
  -0.90 -1.02% 87.60 87.10 87.20 88.00 86.90 87.60 725,604 16:35:17
Industry Sector Turnover Profit EPS - Basic PE Ratio Market Cap
Textile Goods, Nec 1.42B 56.5M 0.0355 24.56 1.41B

/C O R R E C T I O N -- NCI Building Systems, Inc./

01/09/2005 4:17pm

PR Newswire (US)


Coats (LSE:COA)
Historical Stock Chart


From Jul 2019 to Jul 2024
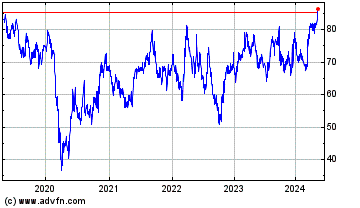
Click Here for more Coats Charts.
In the news release, NCI Building Systems (NYSE: NCS) Reports Third- Quarter Results, issued yesterday, Aug. 31, by NCI Building Systems, Inc. over PR Newswire, the following financial table has been updated, and should read as follows: HOUSTON, Aug. 31 /PRNewswire-FirstCall/ -- NCI Building Systems, Inc. (NYSE:NCS) today announced financial results for the third quarter and nine months ended July 30, 2005. Sales were $292.7 million for the third quarter compared with $295.8 million for the third quarter of fiscal 2004. Net income for the third quarter of fiscal 2005 was $14.7 million, or $0.70 per diluted share, up from $8.4 million, or $0.41 per diluted share, for the third quarter of fiscal 2004. Results for the third quarter of fiscal 2004 include a charge for debt refinancing costs of $9.9 million ($5.8 million, or $0.28 per diluted share, after tax). Sales for the first nine months of fiscal 2005 were $788.5 million compared with $765.9 million for the first nine months of fiscal 2004. Net income increased to $36.1 million, or $1.73 per diluted share, for the latest nine-month period from $21.9 million, or $1.09 per diluted share, for the comparable period in fiscal 2004. Net income for the first nine months of 2005 includes the effect of an after-tax benefit of $1.1 million, or $0.06 per diluted share, related to more favorable group medical claims experience than expected, which was recognized in the first quarter of fiscal 2005. A.R. Ginn, Chairman and Chief Executive Officer of NCI, commented, "Our third-quarter results met our earnings guidance in an environment that remains challenging. Our performance is attributable to the continued expansion of both the sales and operating profit margin of our Engineered Buildings business compared with the comparable prior-year quarter. We were also pleased that even with the seasonal increase in Buildings sales from the second quarter of 2005, our bookings for the quarter enabled us to record modest growth in our backlog of 4.3%, which ended the third quarter at $204 million. Third-quarter results for our components business and, consequently, our coatings business, continued to reflect our adherence to a disciplined pricing strategy in a period of less-than-anticipated industry demand. "Illustrating the overall industry environment, McGraw-Hill's Dodge Report indicates that square footage of new nonresidential construction projects in our industry segments declined 8.3% for calendar 2005 through July compared with the same period in 2004. The Dodge Report notes sequential improvements in square footage for the months of June and July and anticipates that growth in square footage throughout the second half of calendar 2005 will bring total square footage for the year to a level approximating the total for 2004. Our results remained stronger than general industry trends, although the year-to- date decline in industry square footage, as well as the improvements as the third quarter progressed, were relatively consistent with our experience. "The profitability of our operations produced a further strengthening of our financial position during the third quarter. Our cash flow from operations for the nine months ending July 30, 2005 was up $46.3 million to $70.2 million compared to $23.9 million for the nine months ending July 31, 2004. Furthermore, our trailing twelve months adjusted EBITDA increased by 28.9% to 140.3 million over the same period in 2004. As a result, although we completed the third quarter with debt to total capitalization of 44.9% compared with 35.1% at October 30, 2004, our net debt (debt minus cash) to total capitalization (net debt plus shareholders' equity) has improved to 28.0% at the end of the third quarter compared with 30.9% at the end of the second quarter of fiscal 2005 and 34.2% at the end of fiscal 2004. "Based on NCI's results of operations for the third quarter and first nine months of fiscal 2005, as well as lower expectations for industry performance during the full fiscal year, we today established our guidance for fourth- quarter net income per diluted share in a range of $0.93 to $1.03. As a result of this guidance, we have reduced our guidance for full-year fiscal 2005 to a range of $2.60 to $2.70. Our guidance excludes the effect of the first-quarter after-tax benefit of $1.1 million, or $0.06 per diluted share." Mr. Ginn concluded, "We continue to expect to achieve record sales, net income and net income per share for fiscal 2005. In spite of the weakness in the nonresidential construction industry for the first seven months of calendar 2005, combined with reduced visibility for our fiscal fourth quarter, we remain cautiously optimistic that our fourth-quarter results will improve significantly on a sequential-quarter basis over the third quarter just ended. Supporting these expectations, the strengths that underlie NCI's position of industry leadership -- the broadest line of innovative metal construction products; commitment to customer service; an integrated, nationwide network of plants and distribution centers; and state-of-the-art design and manufacturing capabilities producing the highest quality products and the lowest cost infrastructure -- have positioned us well to continue outperforming the industry." This release contains forward-looking statements concerning NCI's business and operations and industry conditions, including among others industry trends, steel pricing, growth expectations and margin expansion. Forward- looking statements involve a number of risks and uncertainties, and NCI's actual performance may differ materially from that projected in such statements. Among the factors that could cause actual results to differ materially are industry cyclicality and seasonality, fluctuations in demand and prices for steel, the financial condition of NCI's raw material suppliers, competitive activity and pricing pressure, ability to execute NCI's acquisition strategy and general economic conditions affecting the construction industry. These and other factors that could affect NCI's financial position and results of operations are described in further detail in NCI's filings with the Securities and Exchange Commission. NCI expressly disclaims any obligation to release publicly any updates or revisions to these forward-looking statements to reflect any changes in its expectations. NCI Building Systems, Inc. is one of North America's largest integrated manufacturers of metal products for the nonresidential building industry. The Company operates manufacturing and distribution facilities located in 16 states and Mexico. Three Months Ended Three Months Ended July 30, 2005 July 31, 2004 % Tot % Tot Sales: Metal components $ 151,298 52 $ 153,975 52 Engineered building systems 115,018 39 113,714 38 Metal coil coating 26,418 9 28,125 10 Intersegment sales 59,716 20 62,604 21 Eliminations (59,716) (20) (62,604) (21) Total net sales $292,734 100 $295,814 100 Operating income: % Sale % Sale Metal components $18,945 13 $20,889 14 Engineered building systems 13,572 12 8,218 7 Metal coil coating 3,430 13 7,568 27 Corporate (8,915) -- (9,166) -- Total operating income (% of sales) $27,032 9 $27,509 9 Nine Months Ended Nine Months Ended July 30, 2005 July 31, 2004 % Tot % Tot Sales: Metal components $ 413,418 52 $ 416,764 54 Engineered building systems 296,932 38 259,530 34 Metal coil coating 78,194 10 89,612 12 Intersegment sales 159,997 20 138,045 18 Eliminations (159,997) (20) (138,045) (18) Total net sales $788,544 100 $765,906 100 Operating income: % Sale % Sale Metal components $54,057 13 $50,185 12 Engineered building systems 29,679 10 12,735 5 Metal coil coating 11,537 15 20,622 23 Corporate (28,040) -- (25,137) -- Total operating income (% of sales) $67,233 9 $58,405 8 NCI BUILDING SYSTEMS, INC. STATEMENTS OF INCOME (Unaudited) (In thousands, except per share data) For the Three For the Nine Months Ended Months Ended July 30, July 31, July 30, July 31, 2005 2004 2005 2004 Sales $292,734 $295,814 $788,544 $765,906 Cost of sales 221,572 227,578 597,113 589,835 Gross profit 71,162 68,236 191,431 176,071 24.3% 23.1% 24.3% 23.0% Selling, general and administrative expenses 44,130 40,727 124,198 117,666 Income from operations 27,032 27,509 67,233 58,405 Interest expense (3,993) (3,736) (10,712) (12,618) Loss on debt refinancing -- (9,879) -- (9,879) Other income, net 1,737 1,184 4,191 1,939 Income before income taxes 24,776 15,078 60,712 37,847 Provision for income taxes 10,087 6,683 24,569 15,991 40.7% 44.3% 40.5% 42.3% Net income $14,689 $8,395 $36,143 $21,856 Net income per share: Basic $0.71 $0.42 $1.76 $1.11 Diluted $0.70 $0.41 $1.73 $1.09 Average shares outstanding: Basic 20,738 19,937 20,565 19,589 Diluted 21,012 20,236 20,919 19,863 Increase (decrease) in sales -1.0% 3.0% Increase in diluted earnings per share 70.7% 58.7% Gross profit percentage 24.3% 23.1% 24.3% 23.0% Selling, general and administrative expenses percentage 15.1% 13.8% 15.8% 15.4% Income from operations percentage 9.2% 9.3% 8.5% 7.6% NCI BUILDING SYSTEMS, INC. COMPUTATION OF EARNINGS BEFORE INTEREST, TAXES, DEPRECIATION, AMORTIZATION AND OTHER NONCASH ITEMS ("ADJUSTED EBITDA") (Unaudited) (In thousands) Trailing 12 Months July 30, July 31, 2005 2004 Net income $59,177 $31,968 Add: Provision for income taxes 38,345 22,143 Interest expense, net of interest income and amortization on deferred financing costs 13,220 17,697 Depreciation and amortization 23,838 23,110 401(k) noncash contributions 5,754 3,723 Loss on debt refinancing -- 9,879 (1) Non-cash real estate -- 391 Adjusted EBITDA (2) $140,334 $108,911 (1) The loss on debt refinancing was treated as extraordinary per the provisions of SFAS No. 4, "Reporting Gains and Losses from Extinguishment of Debt," which were applicable during fiscal year 2002. (2) The Company discloses adjusted EBITDA, which is a non-GAAP measure, because it is a widely accepted financial indicator in the metal construction industry of a company's profitability, ability to finance its operations, and meet its growth plans. This measure is also used by NCI internally to make acquisition and investment decisions. Adjusted EBITDA is calculated based on the terms contained in the Company's credit agreement. Adjusted EBITDA should not be considered in isolation or as a substitute for net income determined in accordance with generally accepted accounting principles in the United States. RECONCILIATION OF ADJUSTED NET INCOME AND NET INCOME PER DILUTED SHARE TO NET INCOME AND NET INCOME PER DILUTED SHARE (Unaudited) (In thousands) For the Nine Months Ended July 30, July 31, 2005 2004 Net income $36,143 $21,856 Add loss on debt refinancing - 5,769 Subtract gain on group medical claims experience (1,114) - Adjusted net income $35,029 $27,625 Net income per diluted share $1.73 $1.09 Adjusted net income per diluted share $1.67 $1.39 Diluted shares outstanding 20,919 19,863 Adjusted net earnings and adjusted earnings per diluted share (the "adjusted items") are non-GAAP financial measures. The Company excludes the loss on debt refinancing and the gain on group medical claims experience to improve the comparability of the results and because both management and most industry analysts rely on the adjusted items as a primary measure to review and assess the ongoing operating performance of the Company. The Company believes it is useful to investors to provide disclosures of its operating results on the same basis as that used by management and most industry analysts. The adjusted items should not be considered in isolation or as a substitute for net earnings or earnings per diluted share determined in accordance with generally accepted accounting principles in the United States. NCI BUILDING SYSTEMS, INC. CONDENSED BALANCE SHEETS (In thousands) July 30, October 30, 2005 2004 (Unaudited) ASSETS Cash $195,085 $8,222 Accounts receivable, net 96,062 108,869 Inventories 110,753 138,363 Deferred taxes 13,352 12,873 Prepaids 3,744 6,491 Total current assets 418,996 274,818 Property, net 186,997 185,687 Excess of cash over fair value of acquired net assets 337,244 318,247 Other assets 21,417 4,105 Total assets $964,654 $782,857 LIABILITIES AND SHAREHOLDERS' EQUITY Current portion of long-term debt $2,000 $2,000 Accounts payable 40,374 57,569 Accrued expenses 68,606 88,012 Total current liabilities 110,980 147,581 Long-term debt, noncurrent portion 371,500 214,700 Deferred income taxes 23,942 19,399 Equity 458,232 401,177 Total Liabilities and Shareholders' Equity $964,654 $782,857 NCI BUILDING SYSTEMS, INC. CONDENSED STATEMENTS OF CASH FLOWS (Unaudited) (In thousands) For the Nine Months Ended July 30, 2005 July 31, 2004 Net income $36,143 $21,856 Adjustments to reconcile net income to net cash provided by operating activities: Loss on debt refinancing 9,879 Depreciation and amortization 18,115 17,209 Loss on sale of fixed assets 135 156 Provision for doubtful accounts 27 2,026 Deferred income tax benefit -- (170) (Increase)/decrease in current assets 54,082 (73,210) Increase/(decrease) in current liabilities (38,324) 46,128 Net cash provided by operating activities 70,178 23,874 Cash flows from investing activities: Acquisitions (27,145) -- Capital expenditures (14,555) (6,715) Proceeds from sale of fixed assets 1,580 558 Other (162) 1,729 Net cash used in investing activities (40,282) (4,428) Cash flows from financing activities: Proceeds from stock option exercises 4,957 15,988 Issuance of convertible debt 180,000 -- Net borrowings/(payments) on revolving lines of credit (16,700) 10,600 Borrowing of long-term debt -- 200,000 Payments on long-term debt (6,500) (243,750) Payment of refinancing costs (4,790) (8,060) Net cash provided by (used in) financing activities 156,967 (25,222) Net increase (decrease) in cash 186,863 (5,776) Cash at beginning of period 8,222 14,204 Cash at end of period $195,085 $8,428 DATASOURCE: NCI Building Systems, Inc. CONTACT: Norman C. Chambers, President & Chief Operating Officer, +1-281-897-7788

Copyright

1 Year Coats Chart

1 Year Coats Chart

1 Month Coats Chart

1 Month Coats Chart

Your Recent History

Delayed Upgrade Clock