ADVFN Logo ADVFN

We could not find any results for:
Make sure your spelling is correct or try broadening your search.

Trending Now

Toplists

It looks like you aren't logged in.
Click the button below to log in and view your recent history.

Hot Features

Registration Strip Icon for default Register for Free to get streaming real-time quotes, interactive charts, live options flow, and more.

AGM Applied Graphene Materials Plc

5.25
0.00 (0.00%)
Last Updated: 01:00:00
Delayed by 15 minutes
Share Name Share Symbol Market Type Share ISIN Share Description
Applied Graphene Materials Plc LSE:AGM London Ordinary Share GB00BFSSB742 ORD 2P
  Price Change % Change Share Price Bid Price Offer Price High Price Low Price Open Price Shares Traded Last Trade
  0.00 0.00% 5.25 0.00 01:00:00
Industry Sector Turnover Profit EPS - Basic PE Ratio Market Cap
0 0 N/A 0

Farmer Mac Reports Third Quarter Results

28/10/2004 12:19am

PR Newswire (US)


Applied Graphene Materials (LSE:AGM)
Historical Stock Chart


From Jul 2019 to Jul 2024
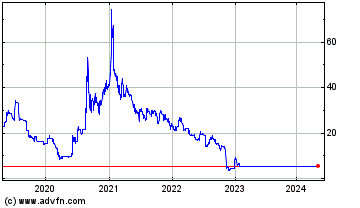
Click Here for more Applied Graphene Materials Charts.
Farmer Mac Reports Third Quarter Results WASHINGTON, Oct. 27 /PRNewswire-FirstCall/ -- The Federal Agricultural Mortgage Corporation (Farmer Mac), (NYSE: AGM; AGM.A) today reported U.S. GAAP net income for third quarter 2004 of $8.6 million or $0.70 per diluted share, compared to $2.0 million or $0.16 per diluted share for second quarter 2004 and $3.3 million or $0.28 per diluted share for third quarter 2003. For the nine months ended September 30, 2004, net income was $18.4 million or $1.50 per diluted share, compared to $20.1 million or $1.68 per diluted share for the nine months ended September 30, 2003. Core earnings were $5.4 million or $0.44 per diluted share for third quarter 2004, compared to $6.2 million or $0.51 per diluted share for second quarter 2004 and $5.5 million or $0.46 per diluted share for third quarter 2003. For the nine months ended September 30, 2004, core earnings were $17.5 million or $1.43 per diluted share, compared to $17.2 million or $1.43 per diluted share for the corresponding period in the prior year. Farmer Mac reports its "core earnings," a non-GAAP measure, in addition to GAAP earnings. Farmer Mac uses the core earnings measure to present net income available to common stockholders less the after-tax effects of unrealized gains and losses on financial derivatives resulting from the application of the derivative accounting standards. Farmer Mac President and Chief Executive Officer Henry D. Edelman stated, "The portfolio of loans underlying Farmer Mac's guarantees and LTSPCs continues to perform well, underscoring the effectiveness of Farmer Mac's ongoing credit risk management and the strength of the U.S. agricultural economy. We are pleased that, as of September 30, 2004, 90-day delinquencies in Farmer Mac's portfolio remained at low levels, in terms of both dollars and percentages. Those delinquencies totaled $47.6 million, representing 1.01 percent of the portfolio, compared to $47.1 million and 0.98 percent as of September 30, 2003, and $79.8 million and 1.77 percent as of September 30, 2002. Real estate owned (REO) was reduced to $7.3 million as of September 30, 2004, from $16.4 million as of September 30, 2003. "For third quarter 2004, new business volume was $145.3 million. As in recent quarters, Farmer Mac's new business continued to be slowed by certain economic factors, particularly the increased liquidity of agricultural borrowers, the increased available capital and liquidity of agricultural lenders, and regulatory conditions. Looking ahead, Farmer Mac is implementing a new strategic alliance and sees additional longer-term opportunities that could lead to more vigorous growth in business volume. "The annuity-like nature of our income streams and the demonstrated credit strength of the loans underlying our guarantees and LTSPCs, though offset by Farmer Mac's reduced business volume, increased expenses, and current market and regulatory conditions, lead us to continue to believe the Corporation's 2004 core earnings per diluted share will be at approximately the same level as in 2003." Non-GAAP Performance Measures Farmer Mac reports its financial results in accordance with GAAP. In addition to GAAP measures, Farmer Mac presents certain non-GAAP performance measures. Farmer Mac uses the latter measures to develop financial plans, to gauge corporate performance and to set incentive compensation because, in management's view, the non-GAAP measures more accurately represent Farmer Mac's economic performance, transaction economics and business trends. Investors and the investment analyst community have previously relied upon similar measures to evaluate Farmer Mac's historical and future performance. Farmer Mac's disclosure of non-GAAP measures is not intended to replace GAAP information but, rather, to supplement it. "Core earnings" is one such non-GAAP measure that Farmer Mac developed to present net income available to common stockholders less the after-tax effects of unrealized gains and losses on financial derivatives resulting from Statement of Financial Accounting Standards No. 133, Accounting for Derivative Instruments and Hedging Activities ("FAS 133"). The GAAP measure most comparable to core earnings is net income available to common stockholders. Unlike core earnings, however, the GAAP measure is heavily influenced by unrealized gains or losses in the value of financial derivatives used to hedge interest rate risk in Farmer Mac's mortgage portfolio. Due in part to the effects of FAS 133, Farmer Mac's GAAP net income available to common stockholders increased to $8.6 million for third quarter 2004, compared to $3.3 million for third quarter 2003, while its core earnings were $5.4 million for third quarter 2004, compared to $5.5 million for third quarter 2003. Because the effects of financial derivatives under FAS 133 included in the GAAP measure are driven by fluctuations in interest rates that cannot reliably be predicted, Farmer Mac does not project GAAP net income available to common stockholders. The reconciliation of GAAP net income available to common stockholders to core earnings is presented in the following table: Reconciliation of GAAP Net Income Available to Common Stockholders to Core Earnings Three Months Ended September 30, September 30, 2004 2003 (in thousands, except per share amounts) Per Per Diluted Diluted Share Share GAAP net income available to common stockholders $8,604 $0.70 $3,345 $0.28 Less the effects of FAS 133: Unrealized gains/(losses) on financial derivatives and trading assets, net of tax 3,144 0.25 (2,269) (0.19) Benefit from non-amortization of premium payments on financial derivatives, net of tax 76 0.01 76 0.01 Core earnings $5,384 $0.44 $5,538 $0.46 Nine Months Ended September 30, September 30, 2004 2003 (in thousands, except per share amounts) Per Per Diluted Diluted Share Share GAAP net income available to common stockholders $18,391 $1.50 $20,139 $1.68 Less the effects of FAS 133: Unrealized gains/(losses) on financial derivatives and trading assets, net of tax 633 0.05 2,695 0.23 Benefit from non-amortization of premium payments on financial derivatives, net of tax 228 0.02 238 0.02 Core earnings $17,530 $1.43 $17,206 $1.43 Later in this release, Farmer Mac provides additional information about the impact of FAS 133, which increased GAAP net income available to common stockholders by $3.2 million in third quarter 2004. Net Interest Income Net interest income, which does not include guarantee fees from loans purchased and retained prior to April 1, 2001 (the effective date of Statement of Financial Accounting Standards No. 140, Accounting for Transfers and Servicing of Financial Assets and Extinguishments of Liabilities ("FAS 140")), was $8.0 million for third quarter 2004, compared to $7.8 million for second quarter 2004 and $8.9 million for third quarter 2003. The net interest yield was 84 basis points for third quarter 2004, compared to 81 basis points for second quarter 2004 and 89 basis points for third quarter 2003. The effect of FAS 140 for third quarter 2004 was the reclassification of guarantee fee income as interest income in the amount of $1.0 million (10 basis points), compared to $1.1 million (11 basis points) in each of second quarter 2004 and third quarter 2003. Farmer Mac classifies the net interest income and expense realized on financial derivatives that are not in fair value or cash flow hedge relationships as gains and losses on financial derivatives and trading assets. This classification resulted in reductions of the net interest yield of 5 basis points, 5 basis points and 1 basis point for third quarter 2004, second quarter 2004 and third quarter 2003, respectively. The net interest yields for third quarter 2004, second quarter 2004 and third quarter 2003 included the benefits of yield maintenance payments of 19 basis points, 13 basis points and 11 basis points, respectively. For third quarter 2004, yield maintenance payments increased net income by $1.1 million or $0.09 per diluted share, compared to $0.8 million or $0.07 per diluted share for second quarter 2004 and $0.7 million or $0.06 per diluted share for third quarter 2003. Guarantee and Commitment Fees Guarantee and commitment fees were $5.3 million for third quarter 2004, compared to $5.3 million for second quarter 2004 and $5.1 million for third quarter 2003. As discussed above, $1.0 million of guarantee fee income was classified as interest income in third quarter 2004, compared to $1.1 million in each of second quarter 2004 and third quarter 2003. Miscellaneous Income Miscellaneous income for third quarter 2004 was $0.7 million, compared to $2.0 million for second quarter 2004 and $0.4 million for third quarter 2003. Of the $2.0 million for second quarter 2004, $1.8 million represented recoveries from two sellers for breaches of representations and warranties associated with prior sales of agricultural mortgage loans to Farmer Mac and no such recoveries occurred in third quarter 2004 or 2003. Farmer Mac had previously charged off these amounts as losses on the related loans. Operating Expenses Compensation and employee benefits for third quarter 2004 were $1.7 million, compared to $1.7 million for second quarter 2004 and $1.6 million for third quarter 2003. General and administrative expenses for third quarter 2004 were $2.0 million, compared to $1.8 million for second quarter 2004 and $1.6 million for third quarter 2003. The year-to-year increases in compensation and employee benefits and general and administrative expenses were due, in large part, to greater staffing levels necessary for increased corporate governance and regulatory compliance activities, including requirements of the Sarbanes-Oxley Act of 2002 and the Farm Credit Administration (FCA), as well as heightened focus on the regulatory environment for government-sponsored enterprises generally. Regulatory fees for third quarter 2004 were $0.5 million, compared to $0.6 million for second quarter 2004 and $0.4 million for third quarter 2003. FCA's regulatory fees charged to Farmer Mac for the federal fiscal year ended September 30, 2004 were $2.0 million, and FCA has advised the Corporation that its fees for the federal fiscal year ended September 30, 2005 will be $2.3 million. Farmer Mac expects all of the above-mentioned expenses to continue at or above current levels through 2005. Farmer Mac's net REO operating costs for third quarter 2004 resulted in income of $0.1 million, compared to costs of $0.3 million for second quarter 2004. Net REO operating costs in prior periods were nominal. Discussion of the provision for losses is covered under the topic of "Credit" later in this release. Capital Farmer Mac's core capital totaled $233.6 million as of September 30, 2004, compared to $226.3 million as of June 30, 2004 and $206.4 million as of September 30, 2003. The regulatory methodology for calculating core capital excludes the effects on capital of Statement of Financial Accounting Standards No. 115, Accounting for Certain Investments in Debt and Equity Securities ("FAS 115") and FAS 133, which are reported on Farmer Mac's balance sheet as accumulated other comprehensive income/(loss). Farmer Mac's core capital as of September 30, 2004 exceeded the statutory minimum capital requirement of $128.1 million by $105.5 million. Farmer Mac is required to meet the capital standards of a risk-based capital stress test promulgated by FCA ("RBC test") pursuant to federal statute. The RBC test determines the amount of regulatory capital (core capital plus the allowance for losses excluding the REO valuation allowance) Farmer Mac would need to maintain positive capital during a ten-year stress period while incurring credit losses equivalent to the highest historical two- year agricultural mortgage loss rates and an interest rate shock at the lesser of 600 basis points or 50 percent of the ten-year U.S. Treasury note rate. The RBC test then adds to the resulting capital requirement an additional 30 percent for management and operational risk. As of September 30, 2004, the RBC test generated an estimated risk-based capital requirement of $43.5 million, compared to the risk-based capital requirement of $49.3 million as of June 30, 2004. Farmer Mac's regulatory capital of $256.1 million as of September 30, 2004 exceeded the RBC requirement by approximately $212.6 million. Farmer Mac is required to hold capital at the higher of the statutory minimum capital requirement or the amount required by the RBC test. During third quarter 2004, Farmer Mac repurchased 70,951 shares of its Class C Non-Voting Common Stock, at an average price of $19.88 per share, pursuant to the Corporation's previously announced stock repurchase program. These repurchases reduced the Corporation's capital by approximately $1.4 million. Credit As of September 30, 2004, Farmer Mac's 90-day delinquencies totaled $47.6 million, representing 1.01 percent of the principal balance of all loans held and loans underlying post-Farm Credit System Reform Act ("1996 Act") Farmer Mac I Guaranteed Securities and LTSPCs, compared to $47.1 million (0.98 percent) as of September 30, 2003. The 90-day delinquencies are loans 90 days or more past due, in foreclosure, restructured after delinquency, or in bankruptcy, excluding loans performing under either their original loan terms or a court-approved bankruptcy plan. As of September 30, 2004, non-performing assets totaled $75.0 million, representing 1.58 percent of the principal balance of all loans held and loans underlying post-1996 Act Farmer Mac I Guaranteed Securities and LTSPCs, compared to $84.6 million (1.74 percent) as of September 30, 2003. Non- performing assets are loans 90 days or more past due, in foreclosure, restructured after delinquency, in bankruptcy, or REO. The principal balance of non-performing assets includes certain segments of the portfolio that have cycled through foreclosure and into the REO asset category, which completes the involuntary loan liquidation process. Also included is a group of loans that are current under the original loan terms or a court-approved bankruptcy plan, though the borrowers on those loans have filed for bankruptcy protection. From quarter to quarter, Farmer Mac anticipates that 90-day delinquencies and non-performing assets will fluctuate, both in dollars and as a percentage of the outstanding portfolio, with higher levels likely at the end of the first and third quarters of each year corresponding to the semi-annual (January 1st and July 1st) payment characteristics of many Farmer Mac I loans. As of September 30, 2004, Farmer Mac had $7.3 million of REO, compared to $9.2 million as of June 30, 2004 and $16.4 million as of September 30, 2003. The commodity and geographic diversification of the REO properties is consistent with the commodity and geographic diversification of the non- performing assets. Analysis of the portfolio by geographic and commodity distribution indicates that non-performing assets, including REO, have been and are expected to be most prevalent in the geographic areas and in agricultural commodities that do not receive significant government support. Prior to acquisition of property securing a loan, Farmer Mac develops a liquidation strategy that results in either an immediate sale or retention pending later sale. Farmer Mac evaluates these and other alternatives based upon the economics of the transactions and the requirements of local law. As of September 30, 2004, Farmer Mac analyzed the following three categories of assets for impairment, based on the fair value of the underlying collateral: (1) the $75.0 million of non-performing assets; (2) the $27.2 million of loans for which Farmer Mac has adjusted the timing of borrowers' payment schedules within the past three years, but still expects to collect all amounts due and has not made economic concessions; and (3) the additional $35.9 million of performing loans that have previously been delinquent or are secured by real estate that produces commodities currently under stress. Those individual assessments covered a total of $138.1 million of assets measured for impairment against updated appraised values, other updated collateral valuations or discounted values. Of the assets so analyzed, $126.6 million were found to be collateralized adequately and $11.5 million of assets were found not to be collateralized adequately, with individual collateral shortfalls totaling $1.3 million. Accordingly, Farmer Mac allocated specific allowances of $1.3 million to those under-collateralized assets as of September 30, 2004. After the allocation of specific allowances from the total allowance for losses of $22.5 million, the non-specific or general allowance and the contingent obligation for inherent probable losses totaled $21.2 million. During third quarter 2004, Farmer Mac charged off $1.1 million in losses against the allowance for losses, compared to $2.0 million in second quarter 2004 and $1.3 million in third quarter 2003. In certain collateral liquidation scenarios, Farmer Mac may recover amounts previously charged off or incur additional losses, if liquidation proceeds vary from previous estimates. During third quarter 2004, Farmer Mac recovered $0.1 million of previously charged off losses. Farmer Mac's total provision for losses was $1.6 million for third quarter 2004, compared to $1.6 million for second quarter 2004 and $2.2 million for third quarter 2003. As of September 30, 2004, Farmer Mac's allowance for losses and contingent obligation for probable losses totaled $22.5 million, or 47 basis points of the outstanding balance of loans held and loans underlying post-1996 Act Farmer Mac I Guaranteed Securities and LTSPCs, compared to $21.8 million (45 basis points) as of June 30, 2004 and $22.7 million (47 basis points) as of September 30, 2003. Based on Farmer Mac's analysis of its entire portfolio, individual loan-by-loan analyses, and loan collection experience, Farmer Mac believes that specific and inherent probable losses are covered adequately by its allowance for losses. The following table summarizes the changes in the components of Farmer Mac's allowance for losses and contingent obligation for probable losses for the three months ended September 30, 2004. The contingent obligation for probable losses is a component of Farmer Mac's guarantee and commitment obligation. Contingent Allowance REO Reserve Obligation for Loan Valuation for for Probable Losses Allowance Losses Losses Total (in thousands) Beginning balance $5,565 $545 $13,187 $2,501 $21,798 Provision for losses (144) 210 1,334 215 1,615 Net charge-offs (196) (755) - - (951) Ending balance $5,225 $- $14,521 $2,716 $22,462 Interest Rate Risk Farmer Mac measures its interest rate risk through several tests, including the sensitivity of its Market Value of Equity ("MVE") and Net Interest Income ("NII") to uniform or "parallel" yield curve shocks. As of September 30, 2004, a parallel increase of 100 basis points across the entire U.S. Treasury yield curve would have decreased MVE by 0.5 percent, while a parallel decrease of 100 basis points would have decreased MVE by 1.0 percent. As of September 30, 2004, a parallel increase of 100 basis points would have increased Farmer Mac's NII, a shorter-term measure of interest rate risk, by 9.4 percent, while a parallel decrease of 100 basis points would have decreased NII by 7.6 percent. Farmer Mac's duration gap, another measure of interest rate risk, was minus 0.2 months as of September 30, 2004. The economic effects of financial derivatives, including interest rate swaps, are included in the MVE, NII and duration gap analyses. As an alternative to long-term fixed-rate debt issuance, Farmer Mac issues short- term debt and enters into contracts to pay fixed rates of interest and receive floating rates of interest from counterparties. These "floating-to-fixed" interest rate swaps are used to adjust the characteristics of Farmer Mac's short-term debt to match more closely the cash flow and duration characteristics of its longer-term assets, thereby reducing interest rate risk, and also to derive an overall lower effective fixed-rate cost of borrowing than would otherwise be available in the conventional debt market. As of September 30, 2004, Farmer Mac had $614.6 million notional amount of floating-to-fixed interest rate swaps for terms ranging from 1 to 15 years. In addition, Farmer Mac enters into "fixed-to-floating" interest rate swaps and "basis swaps" to adjust the characteristics of its assets and liabilities to match more closely, on a cash flow and duration basis, thereby reducing interest rate risk. As of September 30, 2004, Farmer Mac had $905.7 million notional amount of such interest rate swaps. Farmer Mac uses financial derivatives for hedging purposes, not for speculative purposes. All of Farmer Mac's financial derivative transactions are conducted through standard, collateralized agreements that limit Farmer Mac's potential credit exposure to any counterparty. As of September 30, 2004, Farmer Mac had no uncollateralized net exposure to any counterparty. Financial Derivatives and Financial Statement Effects of FAS 133 Farmer Mac accounts for its financial derivatives under FAS 133, which became effective January 1, 2001. The implementation of FAS 133 resulted in significant accounting changes to both the consolidated statements of operations and balance sheets. During third quarter 2004, the increase in net after-tax income resulting from FAS 133 was $3.2 million and the net after-tax decrease in accumulated other comprehensive income was $10.6 million. During second quarter 2004, the decrease in net after-tax income resulting from FAS 133 was $4.3 million and the net after-tax increase in accumulated other comprehensive income was $27.1 million. For third quarter 2003, the decrease in net after-tax income resulting from FAS 133 was $2.2 million and the net after-tax increase in accumulated other comprehensive income was $11.5 million. Accumulated other comprehensive income is not a component of Farmer Mac's regulatory core capital. Regulatory Matters Regulatory actions continue to affect Farmer Mac's business outlook. Statements by either FCA, the federal regulator of both Farmer Mac and the primary lenders in the Farm Credit System (FCS), or the Farm Credit System Insurance Corporation (FCSIC), a U.S. Government controlled corporation managed by a three-member board of directors composed of the members of the FCA Board, or both, have cautioned FCS institutions about doing business with GSEs, including Farmer Mac, and have raised technical objections to FCS institutions' use of Farmer Mac AMBS swaps. During second quarter 2004, FCA published a proposed regulation relating to Farmer Mac's investments and liquidity. While Farmer Mac expects to be able to comply with the regulation if it is adopted in its current form, the Corporation disagrees with certain aspects of the proposed regulation and submitted comments on the proposal to FCA accordingly. On August 5, 2004, FCA published a proposed regulation that, if adopted as proposed, could adversely affect Farmer Mac's business by establishing a new risk-weight allocation of capital applicable to Farmer Mac transactions with FCS institutions, a major segment of Farmer Mac's customer base. That proposed regulation is subject to a 90-day public comment period and, as drafted, would have an effective date eighteen months after the final regulation is published. As set forth in prior disclosures, Farmer Mac disagrees with the proposed regulation as it would affect the Corporation, and intends to submit a comment letter to FCA setting forth its position. Forward-Looking Statements In addition to historical information, this release includes forward- looking statements that reflect management's current expectations for Farmer Mac's future financial results, business prospects and business developments. Management's expectations for Farmer Mac's future necessarily involve a number of assumptions and estimates and the evaluation of risks and uncertainties. Various factors could cause Farmer Mac's actual results or events to differ materially from the expectations as expressed or implied by the forward- looking statements, including uncertainties regarding: (1) the rate and direction of development of the secondary market for agricultural mortgage loans; (2) the possible establishment of additional statutory or regulatory restrictions or constraints on Farmer Mac that could hamper its growth or diminish its profitability; (3) legislative or regulatory developments or interpretations of Farmer Mac's statutory charter that could adversely affect Farmer Mac or the ability or motivation of certain lenders to participate in its programs or the terms of any such participation, or increase the cost of regulation and related corporate activities; (4) possible reaction in the financial markets to events involving government-sponsored enterprises other than Farmer Mac; (5) Farmer Mac's access to the debt markets at favorable rates and terms; (6) the possible effect of the risk-based capital requirement, which could, under certain circumstances, be in excess of the statutory minimum capital requirement; (7) the rate of growth in agricultural mortgage indebtedness; (8) lender interest in Farmer Mac credit products and the Farmer Mac secondary market; (9) borrower preferences for fixed-rate agricultural mortgage indebtedness; (10) competitive pressures in the purchase of agricultural mortgage loans and the sale of agricultural mortgage backed and debt securities; (11) substantial changes in interest rates, agricultural land values, commodity prices, export demand for U.S. agricultural products and the general economy; (12) protracted adverse weather, market or other conditions affecting particular geographic regions or particular commodities related to agricultural mortgage loans backing Farmer Mac I Guaranteed Securities or under LTSPCs; (13) the willingness of investors to invest in agricultural mortgage-backed securities; or (14) the effects on the agricultural economy or the value of agricultural real estate of any changes in federal assistance for agriculture. Other factors are discussed in Farmer Mac's Annual Report on Form 10-K for the year ended December 31, 2003, as filed with the SEC on March 15, 2004 and Farmer Mac's Quarterly Report on Form 10-Q for the quarter ended June 30, 2004, as filed with the SEC on August 9, 2004. The forward-looking statements contained in this release represent management's expectations as of the date of this release. Farmer Mac undertakes no obligation to release publicly the results of revisions to any forward-looking statements included in this release to reflect any future events or circumstances, except as otherwise mandated by the SEC. Farmer Mac is a stockholder-owned instrumentality of the United States chartered by Congress to establish a secondary market for agricultural real estate and rural housing mortgage loans and to facilitate capital market funding for USDA-guaranteed farm program and rural development loans. Farmer Mac's Class C non-voting and Class A voting common stocks are listed on the New York Stock Exchange under the symbols AGM and AGM.A, respectively. Additional information about Farmer Mac (as well as the Forms 10-K and 10-Q referenced above) is available on Farmer Mac's website at http://www.farmermac.com/. The conference call to discuss Farmer Mac's third quarter 2004 earnings and this press release will be webcast on Farmer Mac's website beginning at 9:00 a.m. eastern time, Thursday, October 28, 2004, and an audio recording of that call will be available for two weeks on Farmer Mac's website after the call is concluded. Federal Agricultural Mortgage Corporation Consolidated Balance Sheets (unaudited) (in thousands) September December September 30, 31, 30, 2004 2003 2003 Assets: Cash and cash equivalents $499,806 $623,674 $513,370 Investment securities 949,391 1,064,782 1,083,477 Farmer Mac Guaranteed Securities 1,349,256 1,508,134 1,521,167 Loans held for sale 13,863 46,662 30,511 Loans held for investment 886,409 942,929 949,132 Allowance for loan losses (5,225) (5,967) (6,171) Loans, net 895,047 983,624 973,472 Real estate owned, net of valuation allowance of zero, $0.2 million, and $1.0 million 7,279 15,478 16,413 Financial derivatives 940 961 2,816 Interest receivable 37,820 58,423 42,290 Guarantee and commitment fees receivable 18,894 16,885 14,729 Deferred tax asset, net 10,800 10,891 10,408 Prepaid expenses and other assets 15,687 16,798 18,229 Total Assets $3,784,920 $4,299,650 $4,196,371 Liabilities and Stockholders' Equity: Notes payable: Due within one year $2,201,229 $2,799,384 $2,763,811 Due after one year 1,222,609 1,136,110 1,074,070 Total notes payable 3,423,838 3,935,494 3,837,881 Financial derivatives 57,873 67,670 82,112 Accrued interest payable 25,689 26,342 29,782 Guarantee and commitment obligation 17,751 14,144 15,659 Accounts payable and accrued expenses 17,146 29,574 16,279 Reserve for losses 14,521 13,172 10,592 Total Liabilities 3,556,818 4,086,396 3,992,305 Preferred stock 35,000 35,000 35,000 Common stock at par 12,033 12,054 11,796 Additional paid-in capital 89,146 88,652 84,655 Accumulated other comprehensive loss (5,487) (2,295) (2,336) Retained earnings 97,410 79,843 74,951 Total Stockholders' Equity 228,102 213,254 204,066 Total Liabilities and Stockholders' Equity $3,784,920 $4,299,650 $4,196,371 Federal Agricultural Mortgage Corporation Consolidated Statements of Operations (unaudited) (in thousands, except per share amounts) Three Months Nine Months Ended Ended Sept. Sept. Sept. Sept. 30, 30, 30, 30, 2004 2003 2004 2003 Interest income: Investments and cash equivalents $9,412 $7,994 $25,857 $26,490 Farmer Mac Guaranteed Securities 16,689 17,783 49,555 55,984 Loans 12,285 13,543 38,974 39,679 Total interest income 38,386 39,320 114,386 122,153 Interest expense 30,417 30,402 89,112 93,995 Net interest income 7,969 8,918 25,274 28,158 Provision for loan losses 144 (3,391) (2,420) (6,015) Net interest income after provision for loan losses 8,113 5,527 22,854 22,143 Guarantee and commitment fees 5,269 5,056 15,742 15,261 Gains/(Losses) on financial derivatives and trading assets 5,350 (3,348) 2,446 3,653 Gain on sale of Farmer Mac Guaranteed Securities - - 367 - Gains/(Losses) on the sale of real estate owned 133 79 (120) (23) Miscellaneous income 703 354 3,185 743 Total revenues 19,568 7,668 44,474 41,777 Expenses: Compensation and employee benefits 1,715 1,582 5,227 4,488 General and administrative 2,038 1,550 5,929 3,949 Regulatory fees 504 383 1,565 1,148 REO operating costs, net (52) - 290 - Provision for losses 1,759 (1,190) 2,426 300 Total operating expenses 5,964 2,325 15,437 9,885 Income before income taxes 13,604 5,343 29,037 31,892 Income tax expense 4,440 1,438 8,966 10,073 Net income 9,164 3,905 20,071 21,819 Preferred stock dividends (560) (560) (1,680) (1,680) Net income available to common stockholders $8,604 $3,345 $18,391 $20,139 Earnings per common share: Basic earnings per common share $0.71 $0.28 $1.52 $1.72 Diluted earnings per common share $0.70 $0.28 $1.50 $1.68 Federal Agricultural Mortgage Corporation Supplemental Information The following tables present quarterly and annual information regarding loan purchases, guarantees and LTSPCs, outstanding guarantees and LTSPCs and non-performing assets and 90-day delinquencies. Farmer Mac Purchases, Guarantees and LTSPCs Farmer Mac I Loans and Guaranteed Farmer Securities LTSPCs Mac II Total (in thousands) For the quarter ended: September 30, 2004 $23,229 $84,097 $38,010 $145,336 June 30, 2004 27,520 127,098 34,671 189,289 March 31, 2004 25,444 147,273 34,483 207,200 December 31, 2003 25,148 218,097 44,971 288,216 September 30, 2003 42,760 199,646 106,729 349,135 June 30, 2003 65,615 179,025 77,636 322,276 March 31, 2003 59,054 166,574 41,893 267,521 December 31, 2002 62,841 395,597 38,714 497,152 September 30, 2002 58,475 140,157 37,374 236,006 For the year ended: December 31, 2003 192,577 763,342 271,229 1,227,148 December 31, 2002 747,881 1,155,479 173,011 2,076,371 Outstanding Balance of Farmer Mac Loans, Guarantees and LTSPCs(1) Farmer Mac I Post-1996 Act Loans and Guaranteed Pre-1996 Securities LTSPCs Act (in thousands) As of: September 30, 2004 $2,406,133 $2,381,006 $18,909 June 30, 2004 2,521,026 2,390,779 22,155 March 31, 2004 2,566,412 2,382,648 22,261 December 31, 2003 2,696,530 2,348,702 24,734 September 30, 2003 (2) 2,721,775 2,174,182 25,588 June 30, 2003 2,108,180 2,790,480 28,057 March 31, 2003 2,111,861 2,732,620 29,216 December 31, 2002 2,168,994 2,681,240 31,960 September 30, 2002 2,127,460 2,407,469 35,297 Farmer Mac II Total (in thousands) As of: September 30, 2004 $742,474 $5,548,522 June 30, 2004 715,750 5,649,710 March 31, 2004 722,978 5,694,299 December 31, 2003 729,470 5,799,436 September 30, 2003 (2) 720,584 5,642,129 June 30, 2003 668,899 5,595,616 March 31, 2003 650,152 5,523,849 December 31, 2002 645,790 5,527,984 September 30, 2002 630,452 5,200,678 Outstanding Balance of Loans Held and Loans Underlying On-Balance Sheet Farmer Mac Guaranteed Securities Fixed Rate 5-to-10- 1-Month-to- (10-yr. Wtd. Year ARMs 3-Year Avg. Term) and Resets ARMs Total (in thousands) As of: September 30, 2004 $753,205 $929,641 $520,246 $2,203,092 June 30, 2004 782,854 978,531 529,654 2,291,039 March 31, 2004 818,497 978,263 548,134 2,344,894 December 31, 2003 860,874 1,045,217 542,024 2,448,115 September 30, 2003 865,817 1,037,168 535,915 2,438,900 June 30, 2003 889,839 1,064,824 511,700 2,466,363 March 31, 2003 880,316 1,057,310 515,910 2,453,536 December 31, 2002 1,003,434 981,548 494,713 2,479,695 September 30, 2002 1,000,518 934,435 498,815 2,433,768 Non-performing Assets and 90-Day Delinquencies Outstanding Post-1996 Act Loans, Guarantees Non- and performing LTSPCs Assets(3) Percentage (dollars in thousands) As of: September 30, 2004 $4,756,839 $75,022 1.58% June 30, 2004 4,882,505 69,751 1.43% March 31, 2004 4,922,759 91,326 1.86% December 31, 2003 5,020,032 69,964 1.39% September 30, 2003 4,871,756 84,583 1.74% June 30, 2003 4,875,059 80,169 1.64% March 31, 2003 4,820,887 94,822 1.97% December 31, 2002 4,821,634 75,308 1.56% September 30, 2002 4,506,330 91,286 2.03% Less: REO and Performing 90-Day Bankruptcies Delinquencies(4) Percentage (dollars in thousands) As of: September 30, 2004 $27,438 $47,584 1.01% June 30, 2004 36,978 32,773 0.68% March 31, 2004 33,951 57,375 1.17% December 31, 2003 39,908 30,056 0.60% September 30, 2003 37,442 47,141 0.98% June 30, 2003 28,883 51,286 1.06% March 31, 2003 18,662 76,160 1.58% December 31, 2002 17,094 58,214 1.21% September 30, 2002 11,460 79,826 1.77% Distribution of Post-1996 Act Non-performing Assets and 90-Day Delinquencies by Original LTV Ratio(5) as of September 30, 2004 (dollars in thousands) Non- 90-Day performing Percent- Delinquen- Percent- Original LTV Ratio Assets age cies age 0.00% to 40.00% $5,311 7% $4,334 9% 40.01% to 50.00% 15,588 21% 10,615 22% 50.01% to 60.00% 33,714 45% 18,741 40% 60.01% to 70.00% 16,815 22% 11,117 23% 70.01% to 80.00% 3,417 5% 2,777 6% 80.01% + 177 0% - 0% Total $75,022 100% $47,584 100% Distribution of Post-1996 Act Non-performing Assets and 90-Day Delinquencies by Loan Origination Date as of September 30, 2004 (dollars in thousands) Outstanding Post-1996 Act Loan Loans, Non- 90-Day Origination Guarantees Performing Percent- Delinquen- Percent- Date and LTSPCs Assets age cies age Before 1994 $577,672 $2,896 0.50% $2,001 0.35% 1994 137,947 656 0.48% 656 0.48% 1995 131,148 2,589 1.97% 1,817 1.39% 1996 308,300 8,745 2.84% 5,392 1.77% 1997 365,381 12,488 3.42% 5,745 1.60% 1998 580,036 12,206 2.10% 7,444 1.29% 1999 588,624 16,035 2.72% 11,704 2.00% 2000 347,383 8,755 2.52% 4,647 1.35% 2001 541,206 7,025 1.30% 4,758 0.88% 2002 594,977 3,048 0.51% 2,841 0.48% 2003 463,527 579 0.12% 579 0.12% 2004 120,638 - 0.00% - 0.00% Total $4,756,839 $75,022 1.58% $47,584 1.01% (1) Farmer Mac assumes 100 percent of the credit risk on post-1996 Act loans. Pre-1996 Act loans back securities that are supported by unguaranteed subordinated interests representing approximately 10 percent of the balance of the loans. Farmer Mac II loans are guaranteed by the U.S. Department of Agriculture. (2) The Loans and Guaranteed Securities and LTSPCs amounts reflect the conversion of $722.3 million of existing LTSPCs to Guaranteed Securities during third quarter 2003 at the request of a program participant. (3) Non-performing assets are loans 90 days or more past due, in foreclosure, restructured after delinquency, in bankruptcy (including loans performing under either their original loan terms or a court- approved bankruptcy plan) or real estate owned. (4) 90-day delinquencies are loans 90 days or more past due, in foreclosure, restructured after delinquency, or in bankruptcy, excluding loans performing under either their original loan terms or a court-approved bankruptcy plan. (5) Original LTV ratio is calculated by dividing the loan principal balance at the time of guarantee, purchase or commitment by the appraised value at the date of loan origination or, when available, the updated appraised value at the time of guarantee, purchase or commitment. DATASOURCE: Farmer Mac CONTACT: Jerome Oslick of Farmer Mac, +1-202-872-7700 Web site: http://www.farmermac.com/

Copyright

1 Year Applied Graphene Materials Chart

1 Year Applied Graphene Materials Chart

1 Month Applied Graphene Materials Chart

1 Month Applied Graphene Materials Chart

Your Recent History

Delayed Upgrade Clock