ADVFN Logo ADVFN

We could not find any results for:
Make sure your spelling is correct or try broadening your search.

Trending Now

Toplists

It looks like you aren't logged in.
Click the button below to log in and view your recent history.

Hot Features

Registration Strip Icon for alerts Register for real-time alerts, custom portfolio, and market movers

AGM Applied Graphene Materials Plc

5.25
0.00 (0.00%)
Last Updated: 01:00:00
Delayed by 15 minutes
Share Name Share Symbol Market Type Share ISIN Share Description
Applied Graphene Materials Plc LSE:AGM London Ordinary Share GB00BFSSB742 ORD 2P
  Price Change % Change Share Price Bid Price Offer Price High Price Low Price Open Price Shares Traded Last Trade
  0.00 0.00% 5.25 0.00 01:00:00
Industry Sector Turnover Profit EPS - Basic PE Ratio Market Cap
0 0 N/A 0

Farmer Mac Reports Second Quarter Results

09/08/2005 11:03pm

PR Newswire (US)


Applied Graphene Materials (LSE:AGM)
Historical Stock Chart


From Jul 2019 to Jul 2024
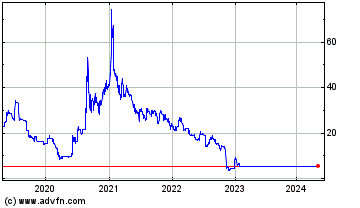
Click Here for more Applied Graphene Materials Charts.
WASHINGTON, Aug. 9 /PRNewswire-FirstCall/ -- The Federal Agricultural Mortgage Corporation (Farmer Mac) (NYSE: AGM; AGM.A) today reported U.S. GAAP net income for second quarter 2005 of $8.2 million or $0.72 per diluted share, compared to $4.9 million or $0.42 per diluted share for first quarter 2005 and $2.0 million or $0.16 per diluted share for second quarter 2004. For the six months ended June 30, 2005, net income was $13.1 million or $1.13 per diluted share, compared to $9.8 million or $0.80 per diluted share for the six months ended June 30, 2004. More complete information on Farmer Mac's performance for the quarter ended June 30, 2005 is set forth in the Form 10-Q filed with the SEC today by Farmer Mac. Core earnings were $6.0 million or $0.52 per diluted share for second quarter 2005, compared to $6.3 million or $0.53 per diluted share for first quarter 2005 and $6.2 million or $0.51 per diluted share for second quarter 2004. For the six months ended June 30, 2005, core earnings were $12.2 million or $1.05 per diluted share, compared to $12.1 million or $0.99 per diluted share for the corresponding period in the prior year. Farmer Mac reports its "core earnings," a non-GAAP measure, in addition to GAAP earnings. Farmer Mac uses the core earnings measure to present net income available to common stockholders less the after-tax effects of unrealized gains and losses on financial derivatives resulting from the application of the derivative accounting standards. Non-GAAP Performance Measures Farmer Mac reports its financial results in accordance with GAAP. In addition to GAAP measures, Farmer Mac presents certain non-GAAP performance measures. Farmer Mac uses the latter measures to develop financial plans, to gauge corporate performance and to set incentive compensation because, in management's view, the non-GAAP measures more accurately represent Farmer Mac's economic performance, transaction economics and business trends. Investors and the investment analyst community have previously relied upon similar measures to evaluate Farmer Mac's historical and future performance. Farmer Mac's disclosure of non-GAAP measures is not intended to replace GAAP information but, rather, to supplement it. Farmer Mac developed the non-GAAP measure "core earnings" to present net income available to common stockholders less the after-tax effects of unrealized gains and losses on financial derivatives resulting from Statement of Financial Accounting Standards No. 133, Accounting for Derivative Instruments and Hedging Activities ("FAS 133"). The GAAP measure most comparable to core earnings is net income available to common stockholders. Unlike core earnings, however, the GAAP measure is heavily influenced by unrealized gains or losses in the value of financial derivatives used to hedge interest rate risk in Farmer Mac's mortgage portfolio. The reconciliation of GAAP net income available to common stockholders to core earnings is presented in the following table: Reconciliation of GAAP Net Income Available to Common Stockholders to Core Earnings Three Months Ended June 30, June 30, 2005 2004 (in thousands, except per share amounts) Per Per Diluted Diluted Share Share GAAP net income available to common stockholders $ 8,211 $ 0.72 $ 1,960 $ 0.16 Less the effects of FAS 133: Unrealized gains/(losses) on financial derivatives and trading assets, net of tax 2,251 0.20 (4,336) (0.36) Benefit from non-amortization of premium payments on financial derivatives, net of tax - - 76 0.01 Core earnings $ 5,960 $ 0.52 $ 6,220 $ 0.51 Six Months Ended June 30, June 30, 2005 2004 (in thousands, except per share amounts) Per Per Diluted Diluted Share Share GAAP net income available to common stockholders $13,123 $ 1.13 $ 9,787 $ 0.80 Less the effects of FAS 133: Unrealized gains/(losses) on financial derivatives and trading assets, net of tax 898 0.08 (2,511) (0.20) Benefit from non-amortization of premium payments on financial derivatives, net of tax - - 152 0.01 Core earnings $12,225 $ 1.05 $12,146 $ 0.99 Farmer Mac is a stockholder-owned instrumentality of the United States chartered by Congress to establish a secondary market for agricultural real estate and rural housing mortgage loans and to facilitate capital market funding for USDA-guaranteed farm program and rural development loans. Farmer Mac's Class C non-voting and Class A voting common stocks are listed on the New York Stock Exchange under the symbols AGM and AGM.A, respectively. Additional information about Farmer Mac (as well as the Form 10-Q referenced above) is available on Farmer Mac's website at http://www.farmermac.com/. The conference call to discuss Farmer Mac's second quarter 2005 earnings and the Corporation's Form 10-Q for second quarter 2005 will be webcast on Farmer Mac's website beginning at 11:00 a.m. eastern time, Wednesday, August 10, 2005, and an audio recording of that call will be available for two weeks on Farmer Mac's website after the call is concluded. DATASOURCE: Farmer Mac CONTACT: Mary Waters of Farmer Mac, +1-202-872-5542 Web site: http://www.farmermac.com/

Copyright

1 Year Applied Graphene Materials Chart

1 Year Applied Graphene Materials Chart

1 Month Applied Graphene Materials Chart

1 Month Applied Graphene Materials Chart

Your Recent History

Delayed Upgrade Clock