We could not find any results for:
Make sure your spelling is correct or try broadening your search.
| Share Name | Share Symbol | Market | Type |
|---|---|---|---|
| Westpac Banking Corp Ltd (PK) | USOTC:WEBNF | OTCMarkets | Common Stock |
| Price Change | % Change | Share Price | Bid Price | Offer Price | High Price | Low Price | Open Price | Shares Traded | Last Trade | |
|---|---|---|---|---|---|---|---|---|---|---|
| 0.065 | 0.37% | 17.765 | 16.90 | 18.00 | 17.765 | 17.70 | 17.70 | 355 | 21:02:43 |
UNITED STATES
SECURITIES AND EXCHANGE COMMISSION
Washington, DC 20549
FORM 6-K
REPORT OF FOREIGN PRIVATE ISSUER PURSUANT TO RULE 13a-16 OR 15d-16 UNDER THE SECURITIES EXCHANGE ACT OF 1934
February 20, 2024
Commission File Number 1-10167
WESTPAC BANKING CORPORATION
(Translation of registrant’s name into English)
275 KENT STREET, SYDNEY, NEW SOUTH WALES 2000, AUSTRALIA
(Address of principal executive office)
Indicate by check mark whether the registrant files or will file annual reports under cover of Form 20-F or Form 40-F.
Form 20-F x Form 40-F ¨
Indicate by check mark if the registrant is submitting the Form 6-K in paper as permitted by Regulation S-T Rule 101(b)(1): ¨
Indicate by check mark if the registrant is submitting the Form 6-K in paper as permitted by Regulation S-T Rule 101(b)(7): ¨
Incorporation by Reference
The information contained in this Report on Form 6-K, including the information set forth in Exhibit No. 1, but excluding the information set forth in Exhibit No. 2 and Exhibit No. 3 shall be incorporated by reference in the prospectuses relating to the Registrant’s securities contained in the Registrant’s Registration Statements on Form F-3 (File Nos. 333-260702 and 333-260703), as such prospectuses may be amended or supplemented from time to time.
The financial information for the three months ended December 31, 2023 has not been audited or reviewed by any independent registered public accounting firm and has been derived from the unaudited financial statements for the quarterly period ended December 31, 2023. Any other financial information provided as at a date after September 30, 2023 has not been audited or reviewed by any independent registered public accounting firm either. The information contained in this Report is based on management’s current information, including management’s view of a wide variety of significant business, economic and competitive risks and uncertainties. Certain data herein may involve underlying estimates, assumptions and judgments when applying accounting policies and preparing its financial statements, particularly in connection with the calculation of provisions. Any change in such estimates, assumptions and/or judgments resulting from new information or from changes in circumstances or experience could result in Westpac incurring losses greater than those anticipated or provided for.
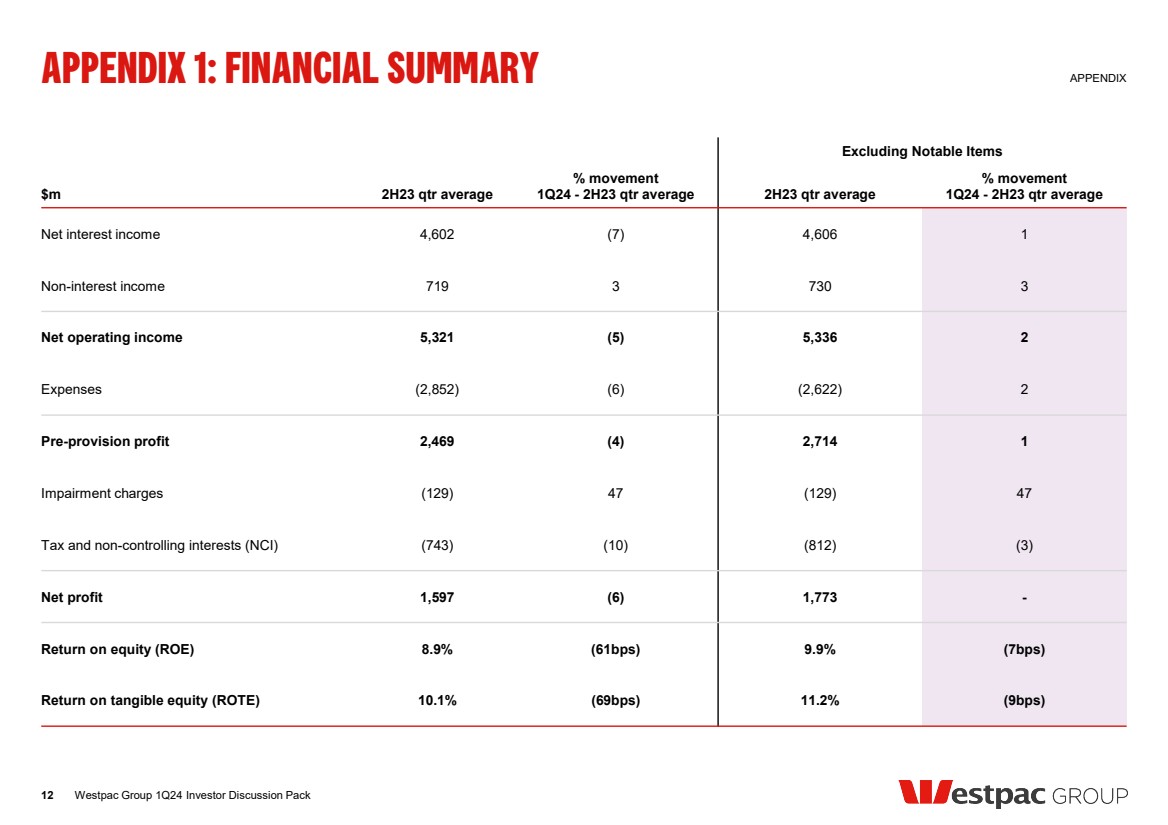
Content in this announcement principally covers and compares the three months ended December 31, 2023 (“1Q24”) and second half 2023 (“2H23”) quarterly average periods unless otherwise stated. The 2H23 quarterly averages have been calculated using the simple arithmetic average of each financial item for the three months ended June 30, 2023 and the three months ended September 30, 2023. All amounts are in Australian dollars. Certain amounts and ratios, including amounts and ratios excluding Notable Items, are not defined by Australian Accounting Standards (“AAS”). These non-AAS measures are identified and described in the ‘Reading this report’ section of the Performance Review in Westpac’s 2023 Annual Report on Form 20-F filed with the U.S. Securities and Exchange Commission.
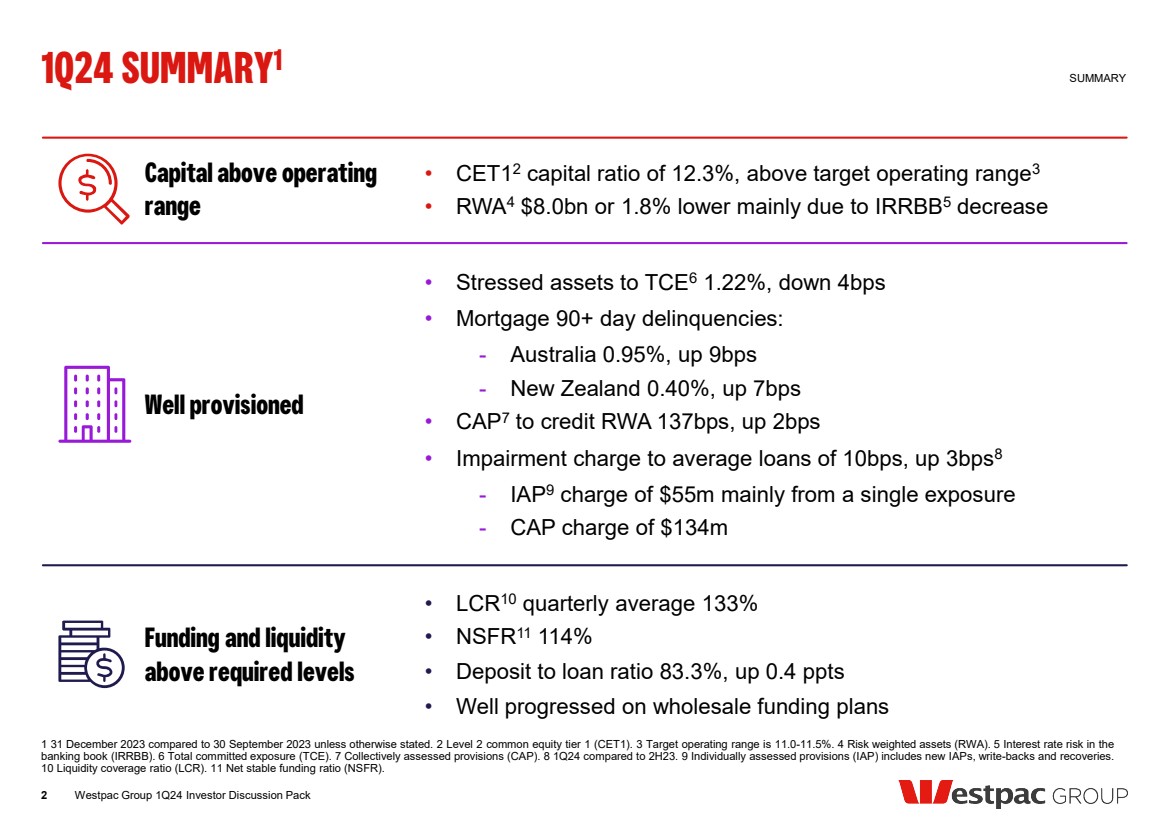
On February 19, 2024, Westpac Group (“Westpac” or “the Group”) provided the market with an update of its performance for 1Q24. The update coincided with the release of Westpac’s Pillar 3 Report for 1Q24.
Westpac 1Q24 update
The Group delivered unaudited net profit of $1.5 billion for 1Q24. The impact of Notable Items, related solely to hedge accounting which will reverse over time, drove the 6% decline.
Excluding Notable Items, unaudited net profit was $1.8 billion for 1Q24, in line with the second half 2023 average.
The Group delivered customer deposit growth of $7.9 billion and loan growth of $5.6 billion for 1Q24.
Operating trends
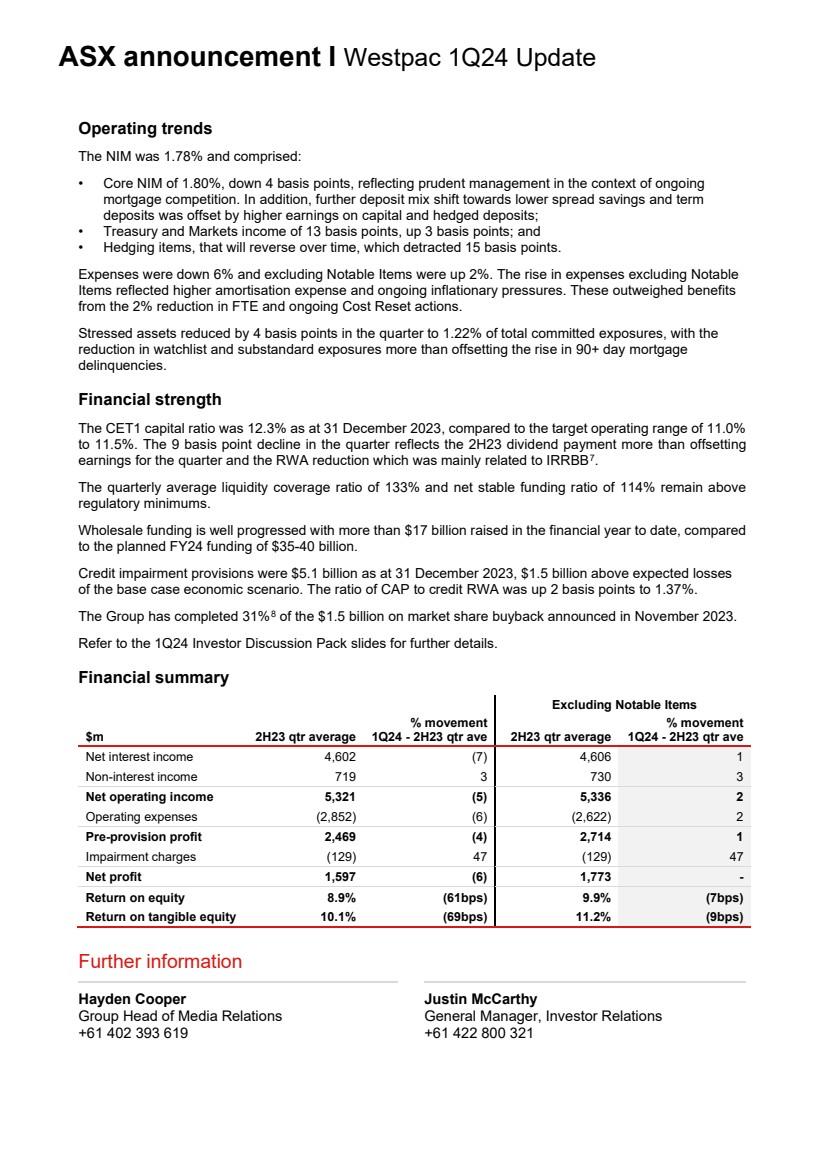
The Group net interest margin (“NIM”) for 1Q24 was 1.78% and comprised of:
| · | Core NIM1 of 1.80%, down 4 basis points, reflecting prudent management in the context of ongoing mortgage competition. In addition, further deposit mix shift towards lower spread savings and term deposits was offset by higher earnings on capital and hedged deposits; |
| · | Treasury and Markets income of 13 basis points, up 3 basis points; and |
| · | Hedging items, that will reverse over time, which detracted 15 basis points. |
Expenses were down 6% for 1Q24. Excluding Notable Items, expenses were up 2% for 1Q24. The rise in expenses excluding Notable Items reflected higher amortisation expense and ongoing inflationary pressures. These outweighed benefits from the 2% reduction in FTE and ongoing Cost Reset actions.
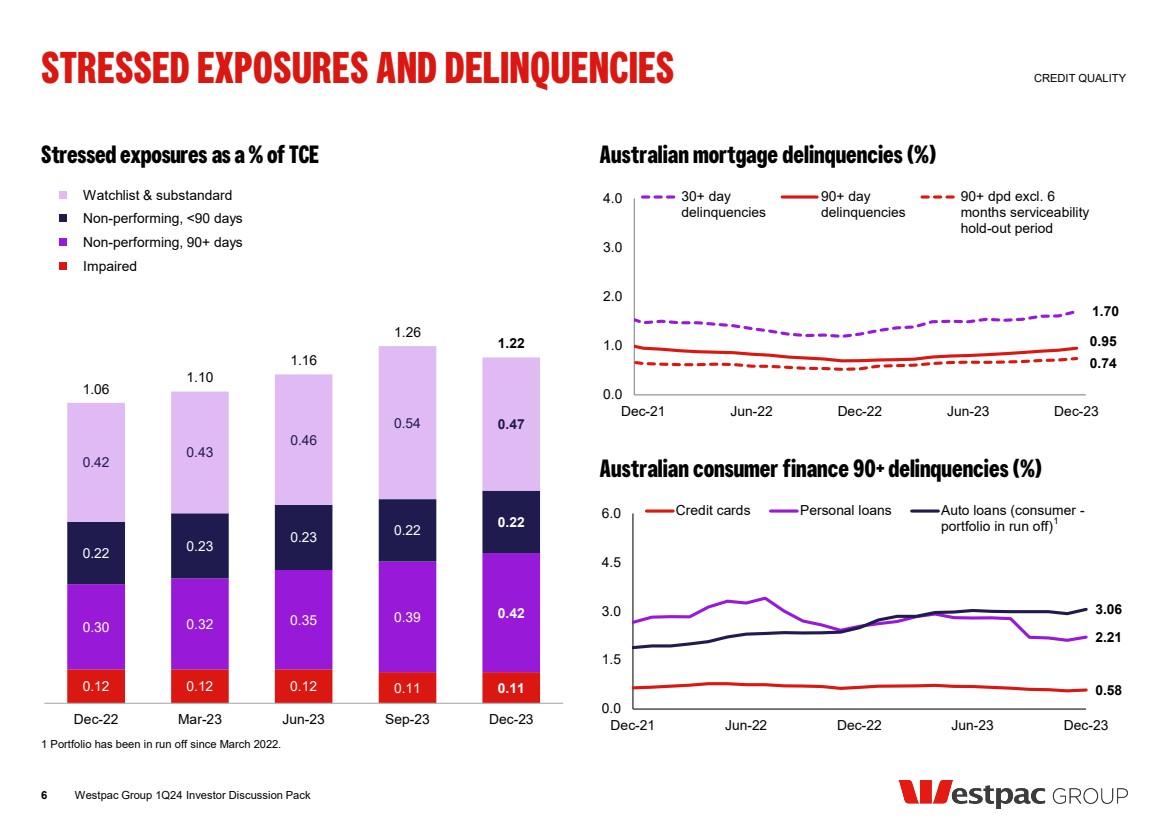
Stressed assets reduced by 4 basis points in the quarter to 1.22% of total committed exposures, with the reduction in watchlist and substandard exposures more than offsetting the rise in 90+ day mortgage delinquencies.
Financial strength
The Group net stable funding ratio was 114% for 1Q24.
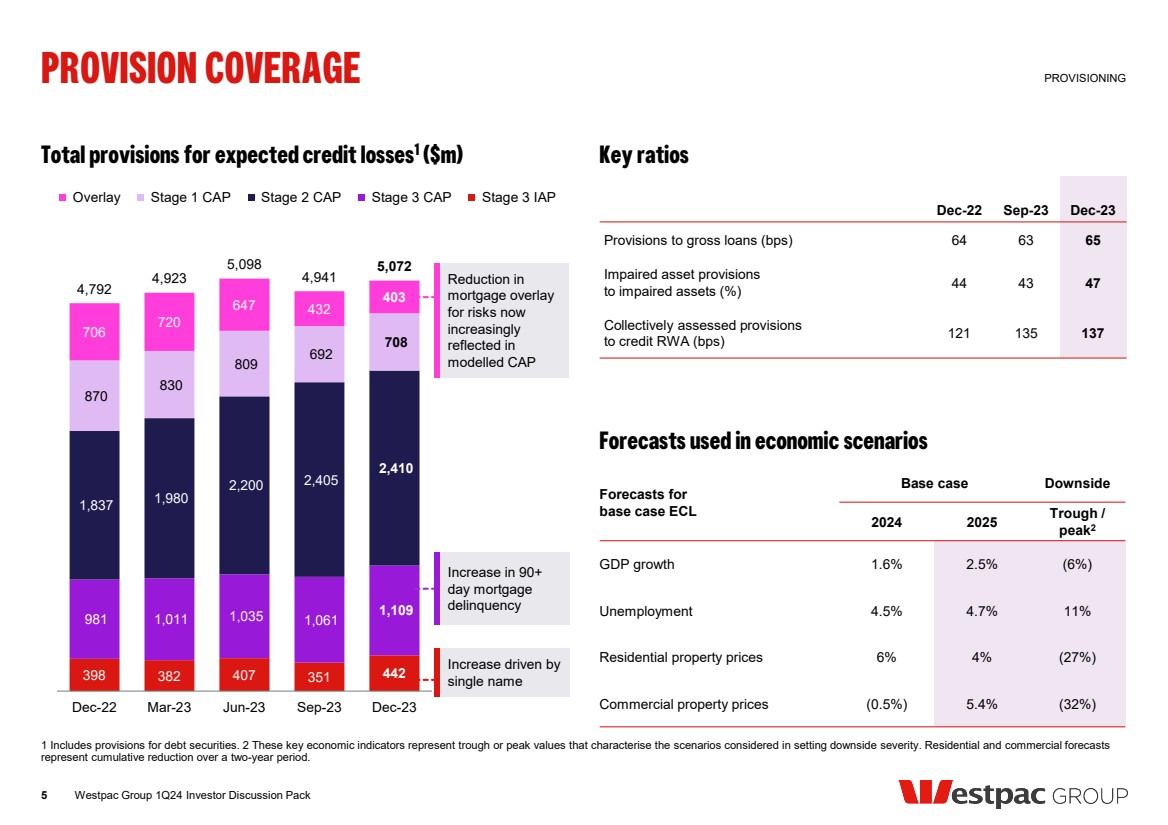
Group credit impairment provisions were $5.1 billion as at December 31, 2023. The ratio of collectively assessed provisions to credit risk weighted assets was up 2 basis points to 1.37% as at December 31, 2023.
Financial summary
| Excluding Notable Items | |||||||||||||||||
| $m | 2H23 qtr average | %
movement | 2H23 qtr average | %
movement | |||||||||||||
| Net interest income | 4,602 | (7 | ) | 4,606 | 1 | ||||||||||||
| Non-interest income | 719 | 3 | 730 | 3 | |||||||||||||
| Net operating income | 5,321 | (5 | ) | 5,336 | 2 | ||||||||||||
| Expenses | (2,852 | ) | (6 | ) | (2,622 | ) | 2 | ||||||||||
| Pre-provision profit | 2,469 | (4 | ) | 2,714 | 1 | ||||||||||||
| Impairment charges | (129 | ) | 47 | (129 | ) | 47 | |||||||||||
| Tax and non-controlling interests (“NCI”) | (743 | ) | (10 | ) | (812 | ) | (3 | ) | |||||||||
| Net profit | 1,597 | (6 | ) | 1,773 | - | ||||||||||||
| Return on equity (“ROE”) | 8.9 | % | (61bps | ) | 9.9 | % | (7bps | ) | |||||||||
1 Core net interest income is calculated by excluding Notable Items and Treasury and Markets.
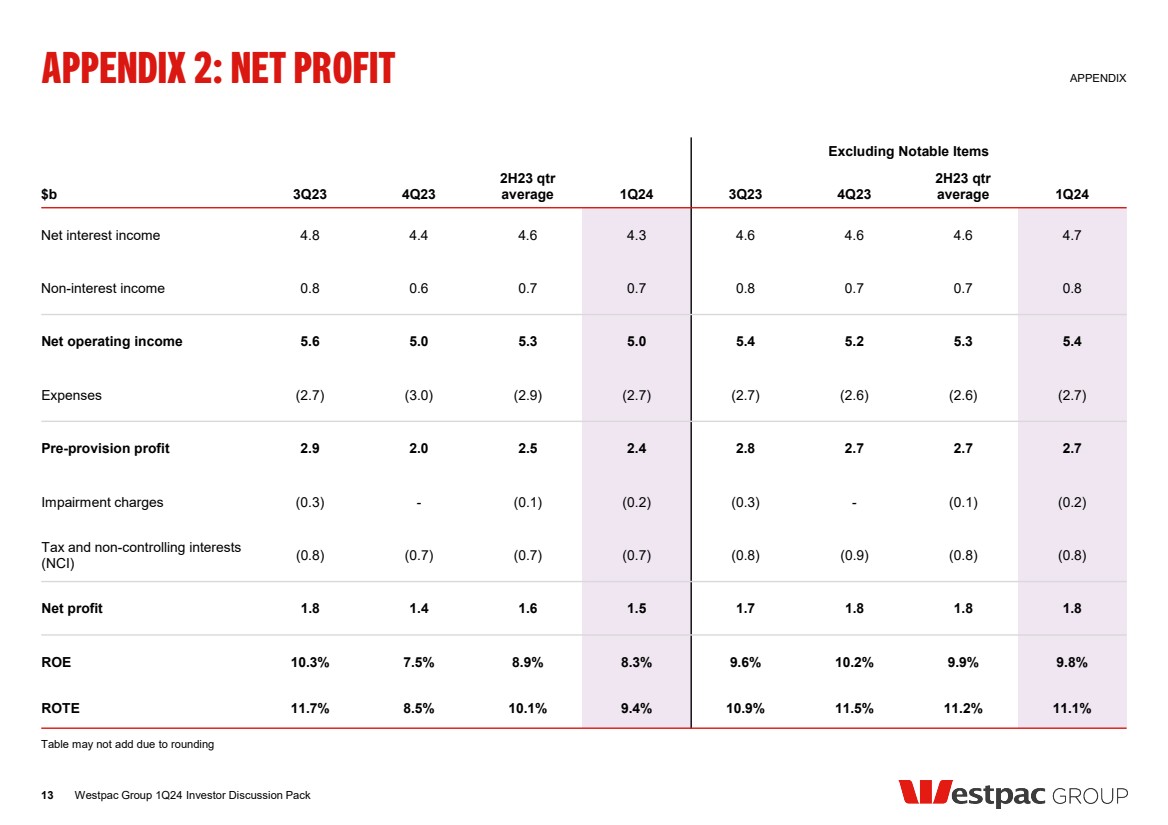
Quarterly net profit2
| Excluding Notable Items | ||||||||||||||||||||||||||||||||
| $b | 3Q23 | 4Q23 |
2H23 qtr | 1Q24 | 3Q23 | 4Q23 | 2H23 qtr average | 1Q24 | ||||||||||||||||||||||||
| Net interest income | 4.8 | 4.4 | 4.6 | 4.3 | 4.6 | 4.6 | 4.6 | 4.7 | ||||||||||||||||||||||||
| Non-interest income | 0.8 | 0.6 | 0.7 | 0.7 | 0.8 | 0.7 | 0.7 | 0.8 | ||||||||||||||||||||||||
| Net operating income | 5.6 | 5.0 | 5.3 | 5.0 | 5.4 | 5.2 | 5.3 | 5.4 | ||||||||||||||||||||||||
| Expenses | (2.7 | ) | (3.0 | ) | (2.9 | ) | (2.7 | ) | (2.7 | ) | (2.6 | ) | (2.6 | ) | (2.7 | ) | ||||||||||||||||
| Pre-provision profit | 2.9 | 2.0 | 2.5 | 2.4 | 2.8 | 2.7 | 2.7 | 2.7 | ||||||||||||||||||||||||
| Impairment charges | (0.3 | ) | - | (0.1 | ) | (0.2 | ) | (0.3 | ) | - | (0.1 | ) | (0.2 | ) | ||||||||||||||||||
| Tax and NCI | (0.8 | ) | (0.7 | ) | (0.7 | ) | (0.7 | ) | (0.8 | ) | (0.9 | ) | (0.8 | ) | (0.8 | ) | ||||||||||||||||
| Net profit | 1.8 | 1.4 | 1.6 | 1.5 | 1.7 | 1.8 | 1.8 | 1.8 | ||||||||||||||||||||||||
| ROE | 10.3 | % | 7.5 | % | 8.9 | % | 8.3 | % | 9.6 | % | 10.2 | % | 9.9 | % | 9.8 | % | ||||||||||||||||
Index to Exhibits
| Exhibit | ||
| No. | Description | |
| 1 | Westpac Group December 2023 Pillar 3 Report | |
| 2 | ASX Release – Westpac 1Q24 Update | |
| 3 | ASX Release – Westpac 1Q24 Investor Discussion Pack |
Disclosure regarding forward-looking statements
The information contained in this Report on Form 6-K contains statements that constitute “forward-looking statements” within the meaning of section 21E of the U.S. Securities Exchange Act of 1934.
Forward-looking statements are statements about matters that are not historical facts. Forward-looking statements appear in a number of places in this Report and include statements regarding our intent, belief or current expectations with respect to our business and operations, macro and micro economic and market conditions, results of operations and financial condition, capital adequacy and risk management, including, without limitation, future loan loss provisions and financial support to certain borrowers, forecasted economic indicators and performance metric outcomes, indicative drivers, climate- and other sustainability related statements, commitments, targets, projections and metrics, and other estimated and proxy data.
2 Table may not add up due to rounding.
We use words such as ‘will’, ‘may’, ‘expect’, ‘intend’, ‘seek’, ‘would’, ‘should’, ‘could’, ‘continue’, ‘plan’, ‘estimate’, ‘anticipate’, ‘believe’, ‘probability’, ‘indicative’, ‘risk’, ‘aim’, ‘outlook’, ‘forecast’, ‘f’cast’, ‘f’, ‘assumption’, ‘projection’, ‘target’, ‘goal’, ‘guidance’, ‘ambition’, or other similar words to identify forward-looking statements. These forward-looking statements reflect our current views on future events and are subject to change, certain known and unknown risks, uncertainties and assumptions and other factors which are, in many instances, beyond our control (and the control of our officers, employees, agents and advisors), and have been made based upon management’s expectations and beliefs concerning future developments and their potential effect upon us.
Forward-looking statements may also be made, verbally or in writing, by members of Westpac’s management or Board in connection with this Report. Such statements are subject to the same limitations, uncertainties, assumptions and disclaimers set out in this Report.
There can be no assurance that future developments or performance will align with our expectations or that the effect of future developments on us will be those anticipated. Actual results could differ materially from those we expect or which are expressed or implied in forward-looking statements, depending on various factors including, but not limited to, those described in the section titled ‘Risk factors’ in Westpac’s 2023 Annual Report on Form 20-F filed with the U.S. Securities and Exchange Commission. When relying on forward-looking statements to make decisions with respect to us, investors and others should carefully consider such factors and other uncertainties and events.
Except as required by law, we assume no obligation to revise or update any forward-looking statements contained in this Report, whether from new information, future events, conditions or otherwise, after the date of this Report.
SIGNATURES
Pursuant to the requirements of the Securities Exchange Act of 1934, the registrant has duly caused this report to be signed on its behalf by the undersigned, thereunto duly authorized.
| WESTPAC BANKING CORPORATION | ||
| (Registrant) | ||
| Date: February 20, 2024 | By: | /s/ Esther Choi |
| Esther Choi | ||
| Tier One Attorney | ||
| ASX Release 19 February 2024 Pillar 3 Report as at 31 December 2023 Westpac Banking Corporation (“Westpac”) today provides the attached Pillar 3 Report (December 2023). For further information: Hayden Cooper Justin McCarthy Group Head of Media Relations General Manager, Investor Relations 0402 393 619 0422 800 321 This document has been authorised for release by Tim Hartin, Company Secretary. Level 18, 275 Kent Street Sydney, NSW, 2000 |
| DECEMBER 2023 INCORPORATING THE REQUIREMENTS OF APS330 WESTPAC BANKING CORPORATION ABN 33 007 457 141 Pillar 3 Report |
| ii WESTPAC GROUP DECEMBER 2023 PILLAR 3 REPORT Table of contents Structure of Pillar 3 Report EXECUTIVE SUMMARY 1 Introduction 3 Group structure 4 Capital overview 6 Leverage ratio 9 Credit risk exposures 10 Securitisation 15 Liquidity coverage ratio 18 APPENDICES 19 Appendix I - APRA’s capital framework 19 Appendix II – APS330 quantitative requirements 21 Appendix III – Exchange rates 22 GLOSSARY 23 DISCLOSURE REGARDING FORWARD-LOOKING STATEMENTS 26 Table of contents In this report references to ‘Westpac’, ‘Westpac Group’, ‘the Group’, ‘we’, ‘us’ and ‘our’ are to Westpac Banking Corporation and its controlled entities (unless the context indicates otherwise). In this report, unless otherwise stated or the context otherwise requires, references to ‘$’, ‘AUD’ or ‘A$’ are to Australian dollars. References to ‘US$’, ‘USD’ or ‘US dollars’ are to United States dollars, references to ‘NZ$’, ‘NZD’ or ‘NZ dollars’ are to New Zealand dollars and references to GBP are to British Pound Sterling. Refer to Appendix III for information regarding the rates of exchange between the Australian dollar and other currencies applied by the Group as part of its operating activities as at 31 December 2023, 30 September 2023 and 31 December 2022. Any discrepancies between totals and sums of components in tables contained in this report are due to rounding. In this report, unless otherwise stated, disclosures reflect the Australian Prudential Regulation Authority’s (APRA) implementation of Basel III. Information contained in or accessible through the websites mentioned in this report does not form part of this report unless we specifically state that it is incorporated by reference and forms part of this report. All references in this report to websites are inactive textual references and are for information only. Westpac Banking Corporation ABN 33 007 457 141 WESTPAC GROUP DECEMBER 2023 PILLAR 3 REPORT Westpac’s reporting suite Our 2023 Annual Report is our primary report to shareholders. Guided by the Integrated Reporting Framework principles, it brings together financial and non-financial performance, strategic progress and the value created for stakeholders over the Full Year 2023 (FY23) reporting period. Our Annual Report forms part of our broader 2023 reporting suite, which comprises the Group’s financial, non-financial, risk and sustainability performance for the year. It includes our FY23 Financial Results Presentation and Investor Discussion Pack, Pillar 3 Report, Corporate Governance Statement and our inaugural Climate Report. Our full suite is available online at westpac.com.au/2023annualreport. 50-YEAR PARTNERSHIP WITH THE WESTPAC LIFESAVER RESCUE HELICOPTER SERVICE WESTPAC 2023 ANNUAL REPORT CREATING BETTER FUTURES TOGETHER WESTPAC 2023 CLIMATE REPORT CREATING BETTER FUTURES TOGETHER PILLAR 3 REPORT SEPTEMBER 2023 INCORPORATING THE REQUIREMENTS OF APS330 WESTPAC BANKING CORPORATION ABN 33 007 457 141 PRESENTATION AND INVESTOR DISCUSSION PACK 2023 FULL YEAR FINANCIAL RESULTS FOR THE 12 MONTHS ENDED 30 SEPTEMBER 2023 WESTPAC BANKING CORPORATION ABN 33 007 457 141 2023 ANNUAL GENERAL MEETING WESTPAC BANKING CORPORATION ABN 33 007 457 141 THURSDAY, 14 DECEMBER 2023 10:00 AM (BRISBANE TIME) NOTICE OF MEETING CORPORATE GOVERNANCE STATEMENT 2023 WESTPAC BANKING CORPORATION ABN 33 007 457 141 Annual Report FY23 Results Presentation and Investor Discussion Pack Climate Report Notice of Meeting Pillar 3 Report Corporate Governance Statement Acknowledgment of Indigenous Peoples Westpac acknowledges the First Peoples of Australia and recognises their ongoing role as Traditional Owners of the land and waters of this country, and we pay respect to Elders past and present. We extend that respect to Westpac’s Aboriginal and Torres Strait Islander employees, partners and stakeholders, and to the Indigenous Peoples in the other locations where we operate. In Aotearoa (New Zealand) we also acknowledge tangata whenua and the unique relationship that Indigenous Peoples share with all New Zealanders as partners and custodians of their natural ecosystems under Te Tiriti o Waitangi. In this Annual Report a reference to ‘Westpac’, ‘Group’, ‘Westpac Group’, ‘we’, ‘us’ and ‘our’ is to Westpac Banking Corporation ABN 33 007 457 141 and its subsidiaries unless it clearly means just Westpac Banking Corporation. For certain information about the basis of preparing the financial information in this Annual Report see ‘Reading this report’ in Section 2. In addition, this Annual Report contains statements that constitute ‘forward-looking statements’ within the meaning of Section 21E of the US Securities Exchange Act of 1934. For an explanation of forward-looking statements and the risks, uncertainties and assumptions to which they are subject, see ‘Reading this report’ in Section 2. Please consider those important disclaimers when reading the forward-looking statements in this Annual Report. Information contained in or accessible through the websites mentioned in this Annual Report does not form part of this report unless we specifically state that it is incorporated by reference and forms part of this report. All references in this report to websites are inactive textual references and are for information only. Westpac Banking Corporation ABN 33 007 457 141 WESTPAC GROUP 2023 ANNUAL REPORT |
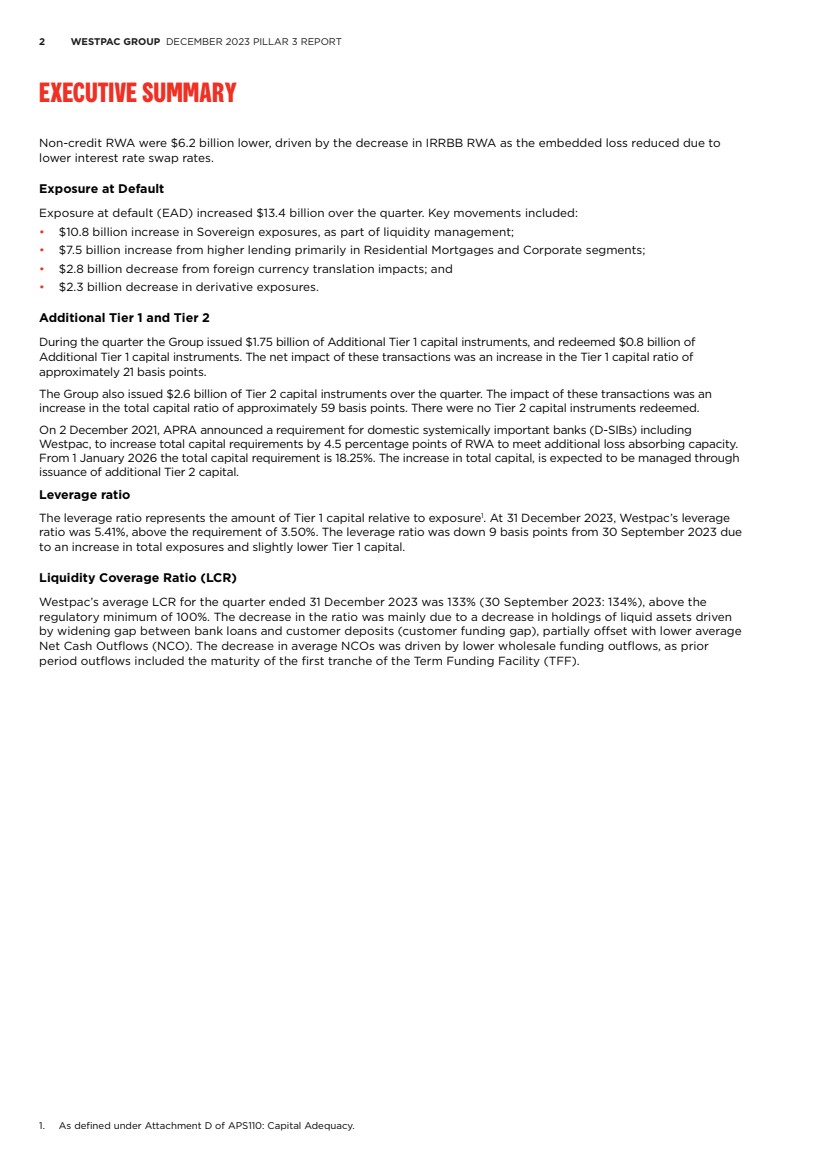
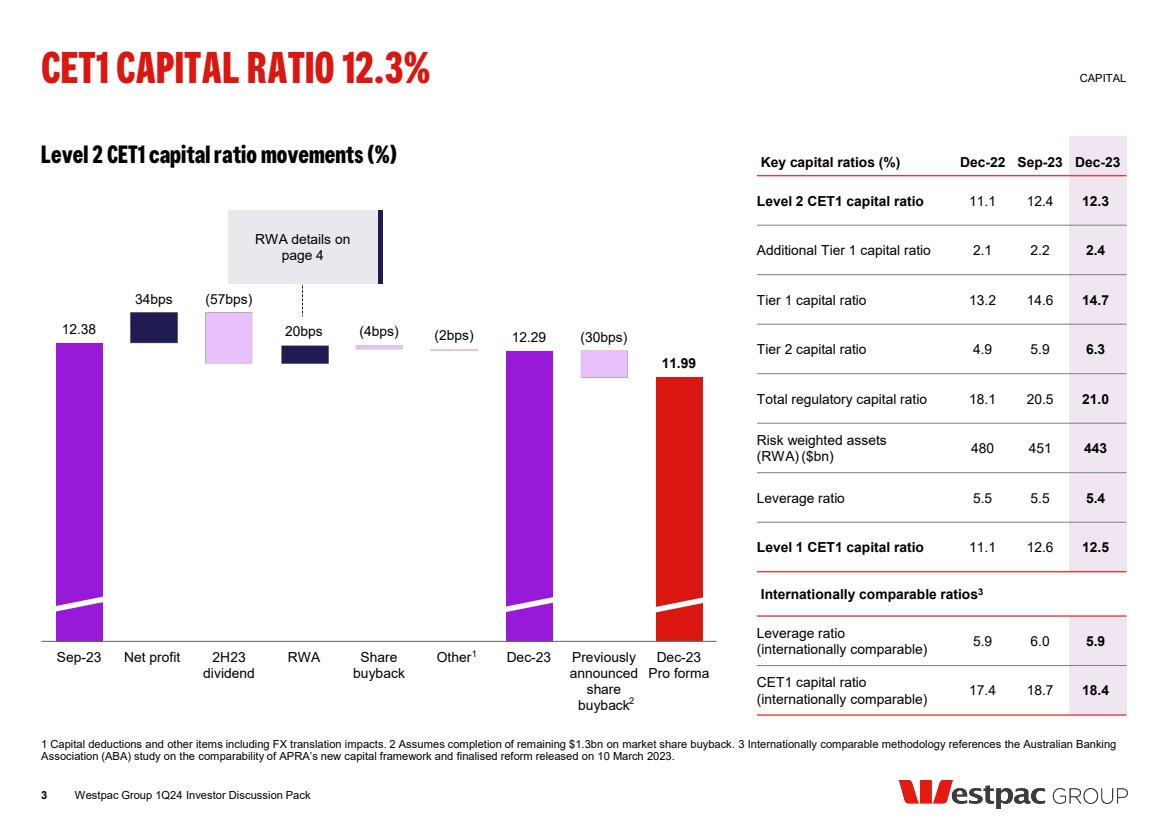
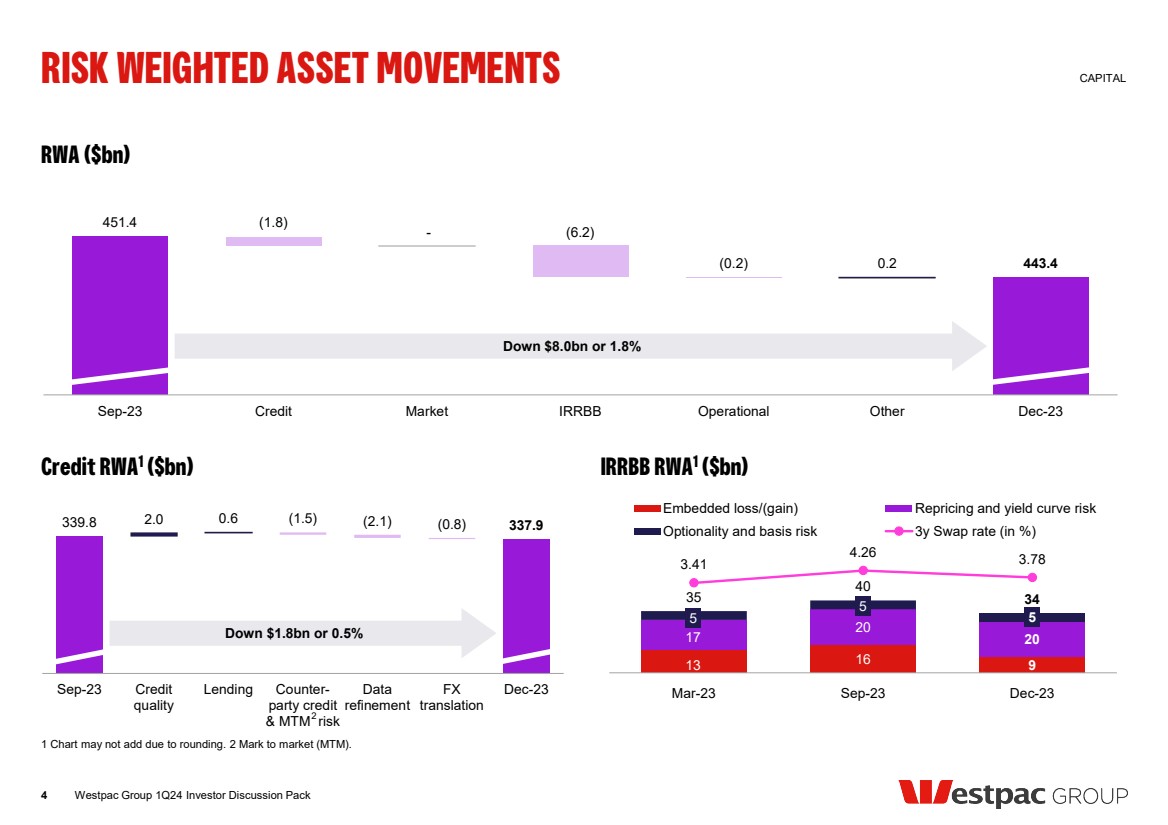
| 1 Executive summary Key capital ratios % 31 Dec 2023 30 Sep 2023 31 Dec 2022 Level 2 Regulatory capital structure Common equity Tier 1 capital ratio % 12.29 12.38 11.13 Additional Tier 1 capital ratio % 2.45 2.21 2.07 Tier 1 capital ratio % 14.74 14.59 13.20 Tier 2 capital % 6.30 5.86 4.90 Total regulatory capital ratio % 21.04 20.45 18.10 APRA leverage ratio % 5.41 5.50 5.51 Level 1 Regulatory capital structure Level 1 Common equity Tier 1 capital ratio % 12.45 12.62 11.08 The current APRA capital framework became effective on 1 January 2023. A summary of the changes can be found in Appendix I. Disclosures for the period ending 31 December 2022 have not been restated. Common equity Tier 1 (CET1) Ratio for First Quarter 2024 Westpac’s Level 2 CET1 capital ratio at 31 December 2023 was 12.29%, 9 basis points lower than 30 September 2023. The decrease was primarily due to payment of the 2023 final dividend, which more than offset net profit derived in the quarter and lower risk weighted assets (RWA). Total RWA decreased over the quarter since 30 September 2023 by $8.0 billion or 1.8%, mainly due to the lower embedded loss within Interest Rate Risk in the Banking Book (IRRBB) RWA. CET1 Ratio First Quarter 2023 to First Quarter 2024 Westpac’s Level 2 CET1 capital ratio at 31 December 2023 is 116 basis points higher than 31 December 2022. The increase reflects net profit derived in the year and lower RWA which more than offset payment of the interim and final 2023 dividends and higher capital deductions. Total RWA reduced from 31 December 2022 by $37.0 billion or 7.7%. Credit RWA reduced by $26.0 billion mostly from APRA’s revised capital framework which reduced credit RWA by $23.7 billion and resulted in a 62 basis point increase to the CET1 ratio. Non-credit risk RWA reduced by $11.1 billion, mainly from lower IRRBB RWA. Risk Weighted Assets (RWA) $m 31 Dec 2023 30 Sep 2023 31 Dec 2022 Risk weighted assets at Level 2 Credit risk 337,949 339,758 363,914 Market risk 11,553 11,538 10,626 Operational risk 54,934 55,175 56,945 Interest rate risk in the banking book 33,935 40,138 43,866 Other 5,056 4,809 5,092 Total RWA 443,427 451,418 480,443 Total Exposure at Default 1,187,223 1,173,867 1,228,791 Total RWA decreased by $8.0 billion or 1.8% to $443.4 billion over the quarter with decreases across credit and non-credit RWA. Credit RWA decreased by $1.8 billion. Key movements included: • A $2.1 billion decrease due to data refinements mainly related to Residential Mortgages and Corporate exposures; • A $1.5 billion decrease from counterparty credit risk and credit valuation adjustments due to decreases in the mark-to-market value of derivatives from changes in underlying foreign currency rates; and • A $0.8 billion decrease from foreign currency translation impacts from the appreciation of the A$ against the US$ and the NZ$. These decreases were partially offset by: • A $2.0 billion increase due to some deterioration in credit metrics mainly from an increase in delinquencies in Residential Mortgages; and • A $0.6 billion increase from higher lending primarily in Residential Mortgages and Corporate lending. Executive summary |
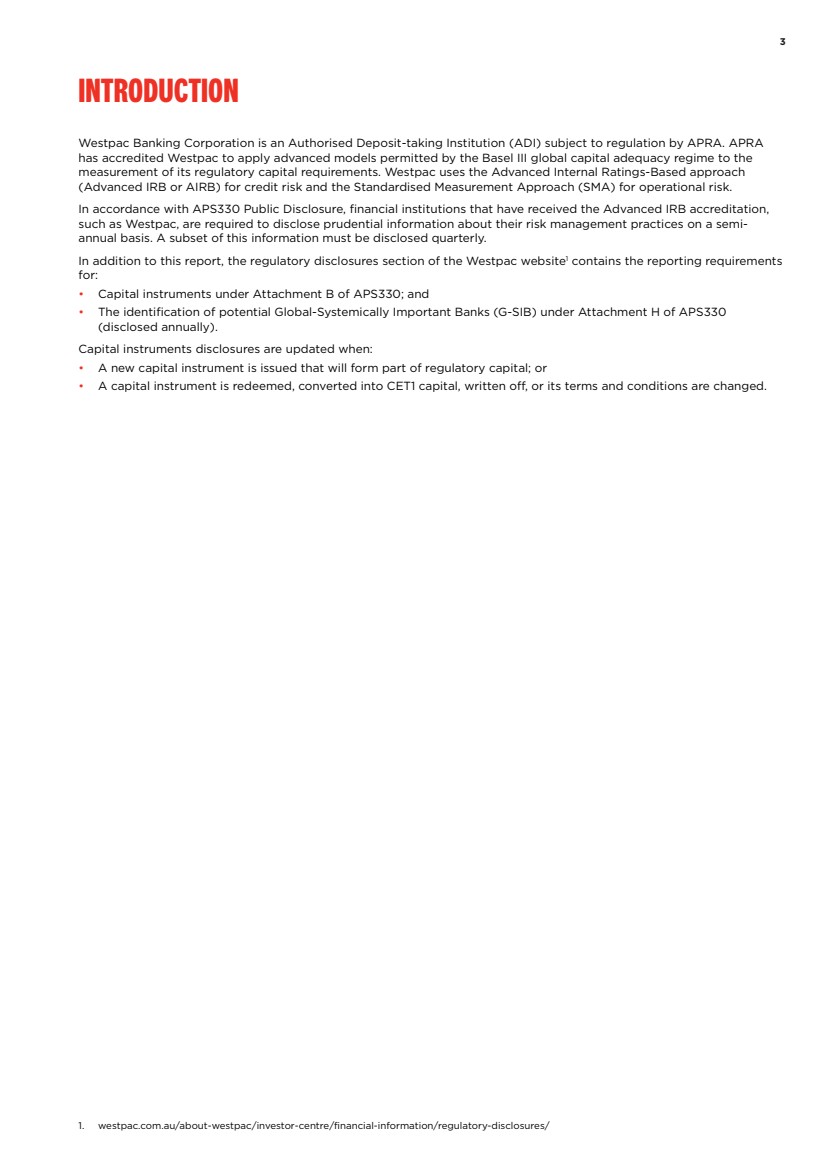
| 2 WESTPAC GROUP DECEMBER 2023 PILLAR 3 REPORT Executive summary Non-credit RWA were $6.2 billion lower, driven by the decrease in IRRBB RWA as the embedded loss reduced due to lower interest rate swap rates. Exposure at Default Exposure at default (EAD) increased $13.4 billion over the quarter. Key movements included: • $10.8 billion increase in Sovereign exposures, as part of liquidity management; • $7.5 billion increase from higher lending primarily in Residential Mortgages and Corporate segments; • $2.8 billion decrease from foreign currency translation impacts; and • $2.3 billion decrease in derivative exposures. Additional Tier 1 and Tier 2 During the quarter the Group issued $1.75 billion of Additional Tier 1 capital instruments, and redeemed $0.8 billion of Additional Tier 1 capital instruments. The net impact of these transactions was an increase in the Tier 1 capital ratio of approximately 21 basis points. The Group also issued $2.6 billion of Tier 2 capital instruments over the quarter. The impact of these transactions was an increase in the total capital ratio of approximately 59 basis points. There were no Tier 2 capital instruments redeemed. On 2 December 2021, APRA announced a requirement for domestic systemically important banks (D-SIBs) including Westpac, to increase total capital requirements by 4.5 percentage points of RWA to meet additional loss absorbing capacity. From 1 January 2026 the total capital requirement is 18.25%. The increase in total capital, is expected to be managed through issuance of additional Tier 2 capital. Leverage ratio The leverage ratio represents the amount of Tier 1 capital relative to exposure1 .. At 31 December 2023, Westpac’s leverage ratio was 5.41%, above the requirement of 3.50%. The leverage ratio was down 9 basis points from 30 September 2023 due to an increase in total exposures and slightly lower Tier 1 capital. Liquidity Coverage Ratio (LCR) Westpac’s average LCR for the quarter ended 31 December 2023 was 133% (30 September 2023: 134%), above the regulatory minimum of 100%. The decrease in the ratio was mainly due to a decrease in holdings of liquid assets driven by widening gap between bank loans and customer deposits (customer funding gap), partially offset with lower average Net Cash Outflows (NCO). The decrease in average NCOs was driven by lower wholesale funding outflows, as prior period outflows included the maturity of the first tranche of the Term Funding Facility (TFF). 1. As defined under Attachment D of APS110: Capital Adequacy. |
| 3 Introduction Westpac Banking Corporation is an Authorised Deposit-taking Institution (ADI) subject to regulation by APRA. APRA has accredited Westpac to apply advanced models permitted by the Basel III global capital adequacy regime to the measurement of its regulatory capital requirements. Westpac uses the Advanced Internal Ratings-Based approach (Advanced IRB or AIRB) for credit risk and the Standardised Measurement Approach (SMA) for operational risk. In accordance with APS330 Public Disclosure, financial institutions that have received the Advanced IRB accreditation, such as Westpac, are required to disclose prudential information about their risk management practices on a semi-annual basis. A subset of this information must be disclosed quarterly. In addition to this report, the regulatory disclosures section of the Westpac website1 contains the reporting requirements for: • Capital instruments under Attachment B of APS330; and • The identification of potential Global-Systemically Important Banks (G-SIB) under Attachment H of APS330 (disclosed annually). Capital instruments disclosures are updated when: • A new capital instrument is issued that will form part of regulatory capital; or • A capital instrument is redeemed, converted into CET1 capital, written off, or its terms and conditions are changed. 1. westpac.com.au/about-westpac/investor-centre/financial-information/regulatory-disclosures/ Introduction |
| 4 WESTPAC GROUP DECEMBER 2023 PILLAR 3 REPORT Group Structure APRA applies a tiered approach to measuring Westpac’s capital adequacy1 by assessing financial strength at three levels: • Level 1, comprising Westpac Banking Corporation and its subsidiary entities that have been approved by APRA as being part of a single ‘Extended Licensed Entity’ (ELE) for the purposes of measuring capital adequacy; • Level 2, the consolidation of Westpac Banking Corporation and all its subsidiary entities except those entities specifically excluded by APRA regulations. The head of the Level 2 group is Westpac Banking Corporation; and • Level 3, the consolidation of Westpac Banking Corporation and all its subsidiary entities. Unless otherwise specified, all quantitative disclosures in this report refer to the prudential assessment of Westpac’s financial strength on a Level 2 basis2. The Westpac Group The following diagram shows the Level 3 conglomerate group and illustrates the different tiers of regulatory consolidation. Westpac Banking Corporation Offshore Branches and Extended Licensed Entities Westpac New Zealand Limited Other Banking & Financial Entities Insurance, Funds Management, Non-Financial, Special Purpose Entities Level 3 Level 2 Level 1 Accounting consolidation3 The consolidated financial statements incorporate the assets and liabilities of all entities (including structured entities) controlled by Westpac. Westpac and its subsidiaries are referred to collectively as the ‘Group’. The effects of all transactions between entities in the Group are eliminated on consolidation. Control exists when the parent entity is exposed to, or has rights to, variable returns from its involvement with an entity, and has the ability to affect those returns through its power over that entity. Subsidiaries are fully consolidated from the date on which control commences and they are no longer consolidated from the date that control ceases. Group entities excluded from the regulatory consolidation at Level 2 Consolidation at Level 2 includes the global entities of Westpac and its subsidiaries, including other controlled banking, securities and financial entities, except for those entities involved in the following business activities: • insurance; • acting as manager, responsible entity, approved trustee, trustee or similar role in relation to funds management; • non-financial (commercial) operations; or • special purpose entities to which assets have been transferred in accordance with the requirements of APS120 Securitisation. Retained earnings and equity investments in subsidiary entities excluded from the consolidation at Level 2 are deducted from capital, with the exception of securitisation special purpose entities. 1. APS110 Capital Adequacy outlines the overall framework adopted by APRA for the purpose of assessing the capital adequacy of an ADI. 2. Impaired assets and provisions held in Level 3 entities are excluded from the tables in this report. 3. Refer to Note 29 of Westpac’s 2023 Annual Report for further details. Group Structure |
| 5 Subsidiary banking entities Westpac New Zealand Limited (WNZL), a wholly owned subsidiary entity, is a registered bank incorporated in New Zealand and regulated by, among others, the Reserve Bank of New Zealand (RBNZ) for prudential purposes. WNZL uses both the Advanced IRB and Standardised methodologies for credit risk, and the SMA for operational risk. Other subsidiary banking entities in the Group include Westpac Bank PNG Limited, Westpac Europe Limited and Westpac Europe GMBH. For the purposes of determining Westpac’s capital adequacy subsidiary banking entities are consolidated at Level 2. Restrictions and major impediments on the transfer of funds or regulatory capital within the Group Certain subsidiary banking and trustee entities are subject to local prudential regulation in their own right, including capital adequacy requirements and investment or intra-group exposure limits. Westpac seeks to ensure that its subsidiary entities are adequately capitalised and adhere to regulatory requirements at all times. Dividends and capital are repatriated in line with the Group’s policy subject to subsidiary Board approval and local regulations. Minimum capital (‘thin capitalisation’) rules Tax legislation in most jurisdictions in which the Group operates prescribes minimum levels of capital that must be retained in that jurisdiction to avoid a portion of the interest costs incurred in the jurisdiction ceasing to be tax deductible. Capital for these purposes includes both contributed capital and non-distributed retained earnings. Westpac seeks to maintain sufficient capital/retained earnings in these entities to comply with these rules. Tax costs associated with repatriation Repatriation of retained earnings (and capital) may result in tax being payable in either the jurisdiction from which the repatriation occurs or in Australia on receipt of the relevant amounts. This cost would reduce the amount actually repatriated. Intra-group exposure limits Exposures to related entities are managed within the prudential limits prescribed by APRA in APS222 Associations with Related Entities1 .. Westpac has an internal limit structure and approval process governing credit exposures to related entities. This limit structure and approval process, combined with APRA’s prudential limits, is designed to reduce the potential for unacceptable contagion risk. RBNZ capital review The RBNZ capital adequacy framework became effective from 1 July 2022. The reforms were phased in from 1 October 2021, with changes yet to be fully implemented including: • WNZL Tier 1 capital requirement will increase to 16% of RWA by 1 July 2028, of which 13.5% must be CET1 capital and up to 2.5% may be Additional Tier 1 capital; • WNZL’s total capital requirement will increase to 18% of RWA by 1 July 2028, of which up to 2% can be Tier 2 capital; and • Eligible Tier 1 capital will comprise common equity and redeemable perpetual preference shares. Existing Additional Tier 1 capital instruments are being progressively phased out by 1 July 2028. 1. For the purposes of APS222, subsidiaries controlled by Westpac, other than subsidiaries that form part of the ELE, represent ‘related entities’. Prudential and internal limits apply to intra-group exposures between the ELE and related entities, both on an individual and aggregate basis. |
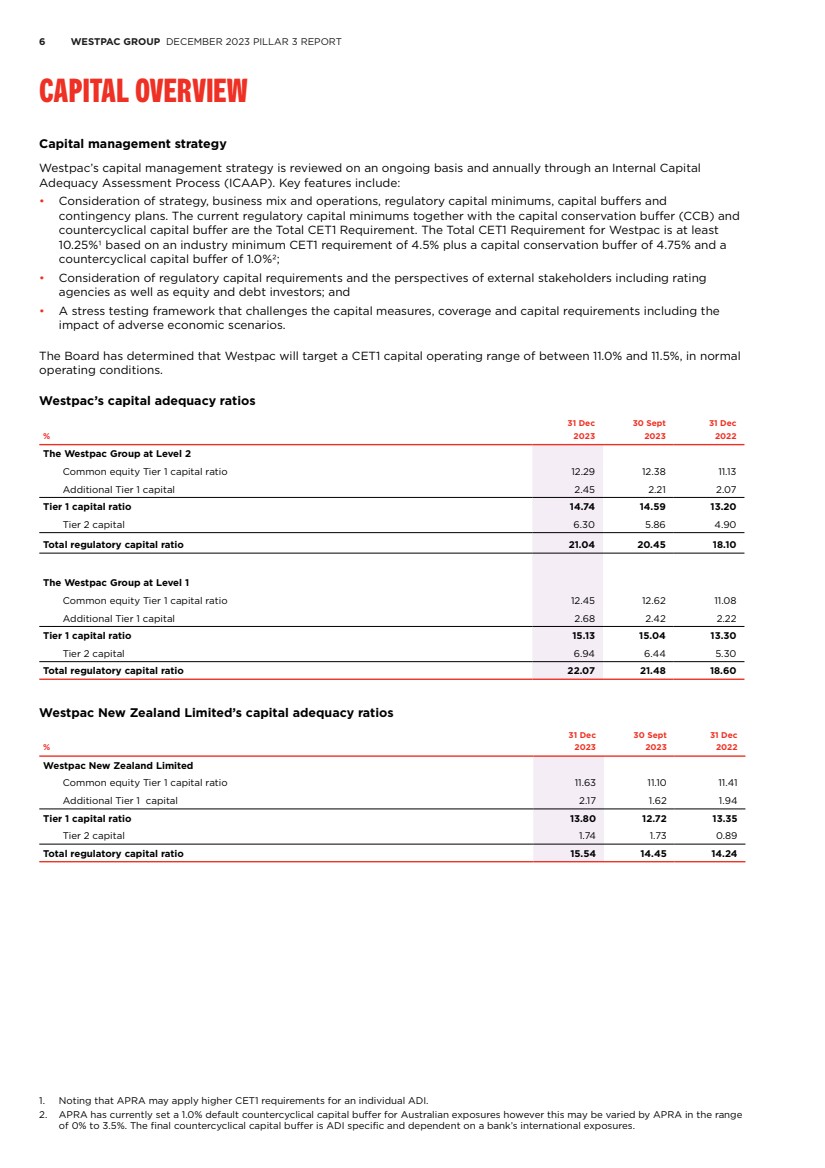
| 6 WESTPAC GROUP DECEMBER 2023 PILLAR 3 REPORT Capital overview Capital management strategy Westpac’s capital management strategy is reviewed on an ongoing basis and annually through an Internal Capital Adequacy Assessment Process (ICAAP). Key features include: • Consideration of strategy, business mix and operations, regulatory capital minimums, capital buffers and contingency plans. The current regulatory capital minimums together with the capital conservation buffer (CCB) and countercyclical capital buffer are the Total CET1 Requirement. The Total CET1 Requirement for Westpac is at least 10.25%1 based on an industry minimum CET1 requirement of 4.5% plus a capital conservation buffer of 4.75% and a countercyclical capital buffer of 1.0%2; • Consideration of regulatory capital requirements and the perspectives of external stakeholders including rating agencies as well as equity and debt investors; and • A stress testing framework that challenges the capital measures, coverage and capital requirements including the impact of adverse economic scenarios. The Board has determined that Westpac will target a CET1 capital operating range of between 11.0% and 11.5%, in normal operating conditions. Westpac’s capital adequacy ratios 31 Dec 30 Sept 31 Dec % 2023 2023 2022 The Westpac Group at Level 2 Common equity Tier 1 capital ratio 12.29 12.38 11.13 Additional Tier 1 capital 2.45 2.21 2.07 Tier 1 capital ratio 14.74 14.59 13.20 Tier 2 capital 6.30 5.86 4.90 Total regulatory capital ratio 21.04 20.45 18.10 The Westpac Group at Level 1 Common equity Tier 1 capital ratio 12.45 12.62 11.08 Additional Tier 1 capital 2.68 2.42 2.22 Tier 1 capital ratio 15.13 15.04 13.30 Tier 2 capital 6.94 6.44 5.30 Total regulatory capital ratio 22.07 21.48 18.60 Westpac New Zealand Limited’s capital adequacy ratios 31 Dec 30 Sept 31 Dec % 2023 2023 2022 Westpac New Zealand Limited Common equity Tier 1 capital ratio 11.63 11.10 11.41 Additional Tier 1 capital 2.17 1.62 1.94 Tier 1 capital ratio 13.80 12.72 13.35 Tier 2 capital 1.74 1.73 0.89 Total regulatory capital ratio 15.54 14.45 14.24 1. Noting that APRA may apply higher CET1 requirements for an individual ADI. 2. APRA has currently set a 1.0% default countercyclical capital buffer for Australian exposures however this may be varied by APRA in the range of 0% to 3.5%. The final countercyclical capital buffer is ADI specific and dependent on a bank’s international exposures. Capital overview |
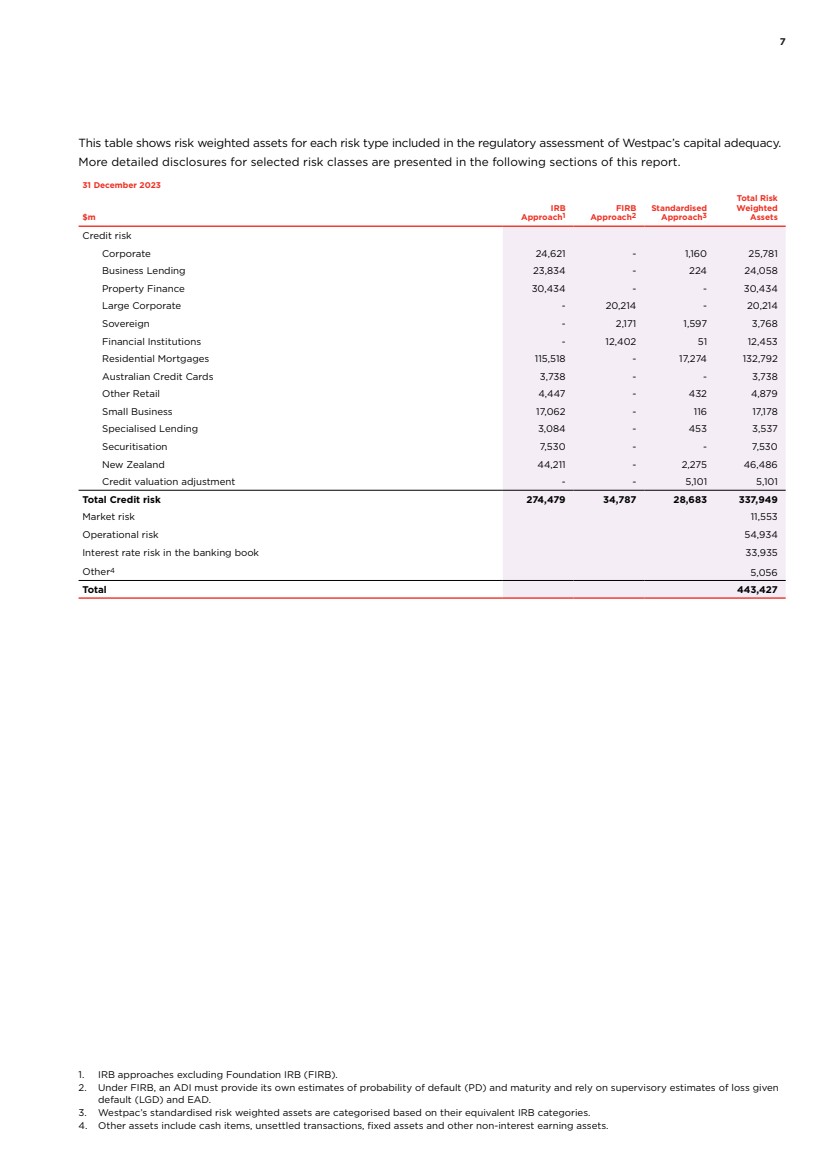
| 7 This table shows risk weighted assets for each risk type included in the regulatory assessment of Westpac’s capital adequacy. More detailed disclosures for selected risk classes are presented in the following sections of this report. 31 December 2023 $m IRB Approach1 FIRB Approach2 Standardised Approach3 Total Risk Weighted Assets Credit risk Corporate 24,621 - 1,160 25,781 Business Lending 23,834 - 224 24,058 Property Finance 30,434 - - 30,434 Large Corporate - 20,214 - 20,214 Sovereign - 2,171 1,597 3,768 Financial Institutions - 12,402 51 12,453 Residential Mortgages 115,518 - 17,274 132,792 Australian Credit Cards 3,738 - - 3,738 Other Retail 4,447 - 432 4,879 Small Business 17,062 - 116 17,178 Specialised Lending 3,084 - 453 3,537 Securitisation 7,530 - - 7,530 New Zealand 44,211 - 2,275 46,486 Credit valuation adjustment - - 5,101 5,101 Total Credit risk 274,479 34,787 28,683 337,949 Market risk 11,553 Operational risk 54,934 Interest rate risk in the banking book 33,935 Other4 5,056 Total 443,427 1. IRB approaches excluding Foundation IRB (FIRB). 2. Under FIRB, an ADI must provide its own estimates of probability of default (PD) and maturity and rely on supervisory estimates of loss given default (LGD) and EAD. 3. Westpac’s standardised risk weighted assets are categorised based on their equivalent IRB categories. 4. Other assets include cash items, unsettled transactions, fixed assets and other non-interest earning assets. |
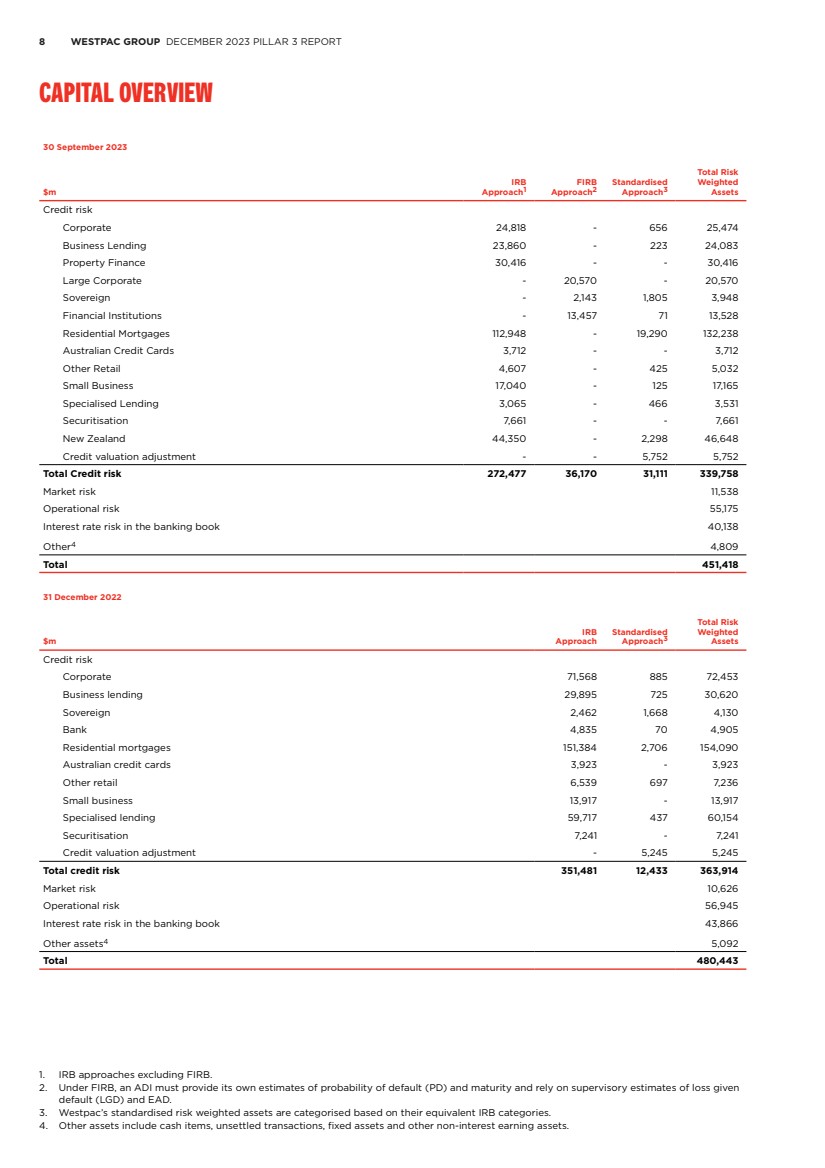
| 8 WESTPAC GROUP DECEMBER 2023 PILLAR 3 REPORT Capital overview 30 September 2023 $m IRB Approach1 FIRB Approach2 Standardised Approach3 Total Risk Weighted Assets Credit risk Corporate 24,818 - 656 25,474 Business Lending 23,860 - 223 24,083 Property Finance 30,416 - - 30,416 Large Corporate - 20,570 - 20,570 Sovereign - 2,143 1,805 3,948 Financial Institutions - 13,457 71 13,528 Residential Mortgages 112,948 - 19,290 132,238 Australian Credit Cards 3,712 - - 3,712 Other Retail 4,607 - 425 5,032 Small Business 17,040 - 125 17,165 Specialised Lending 3,065 - 466 3,531 Securitisation 7,661 - - 7,661 New Zealand 44,350 - 2,298 46,648 Credit valuation adjustment - - 5,752 5,752 Total Credit risk 272,477 36,170 31,111 339,758 Market risk 11,538 Operational risk 55,175 Interest rate risk in the banking book 40,138 Other4 4,809 Total 451,418 31 December 2022 $m IRB Approach Standardised Approach3 Total Risk Weighted Assets Credit risk Corporate 71,568 885 72,453 Business lending 29,895 725 30,620 Sovereign 2,462 1,668 4,130 Bank 4,835 70 4,905 Residential mortgages 151,384 2,706 154,090 Australian credit cards 3,923 - 3,923 Other retail 6,539 697 7,236 Small business 13,917 - 13,917 Specialised lending 59,717 437 60,154 Securitisation 7,241 - 7,241 Credit valuation adjustment - 5,245 5,245 Total credit risk 351,481 12,433 363,914 Market risk 10,626 Operational risk 56,945 Interest rate risk in the banking book 43,866 Other assets4 5,092 Total 480,443 1. IRB approaches excluding FIRB. 2. Under FIRB, an ADI must provide its own estimates of probability of default (PD) and maturity and rely on supervisory estimates of loss given default (LGD) and EAD. 3. Westpac’s standardised risk weighted assets are categorised based on their equivalent IRB categories. 4. Other assets include cash items, unsettled transactions, fixed assets and other non-interest earning assets. |
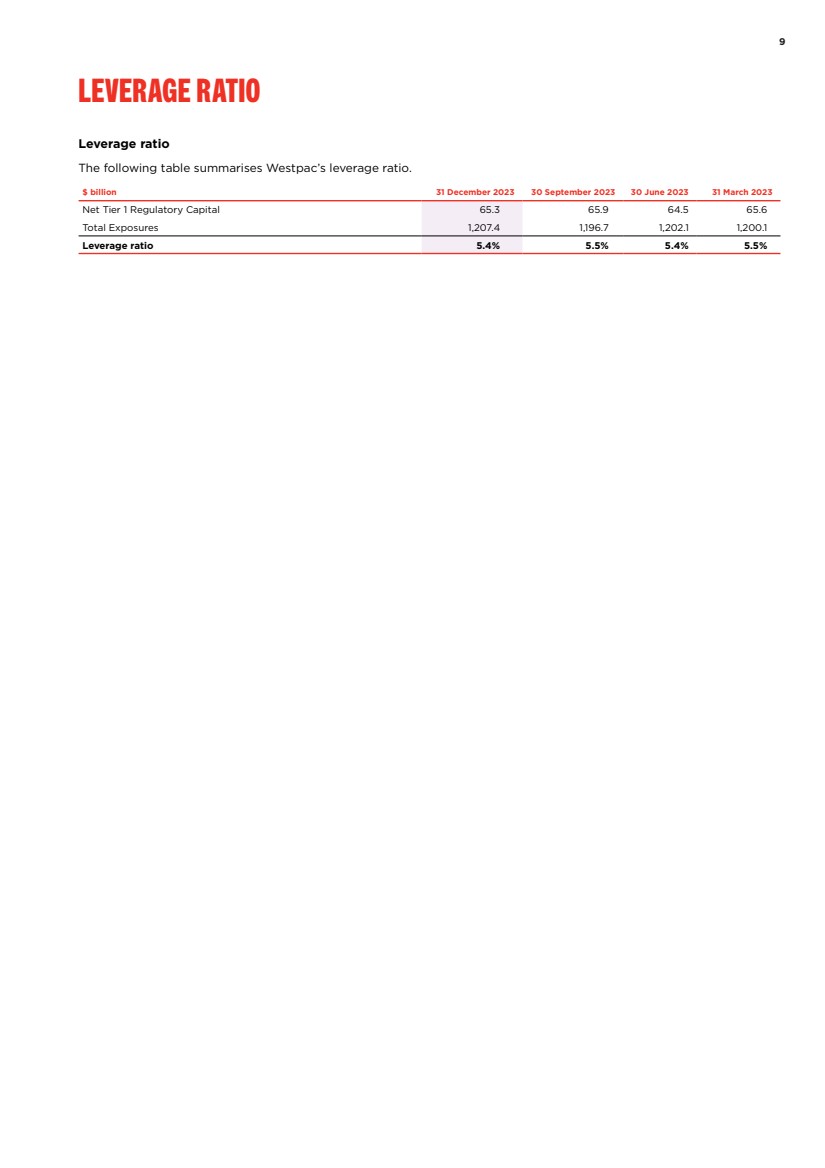
| 9 Leverage Ratio Leverage ratio The following table summarises Westpac’s leverage ratio. $ billion 31 December 2023 30 September 2023 30 June 2023 31 March 2023 Net Tier 1 Regulatory Capital 65.3 65.9 64.5 65.6 Total Exposures 1,207.4 1,196.7 1,202.1 1,200.1 Leverage ratio 5.4% 5.5% 5.4% 5.5% Leverage Ratio |
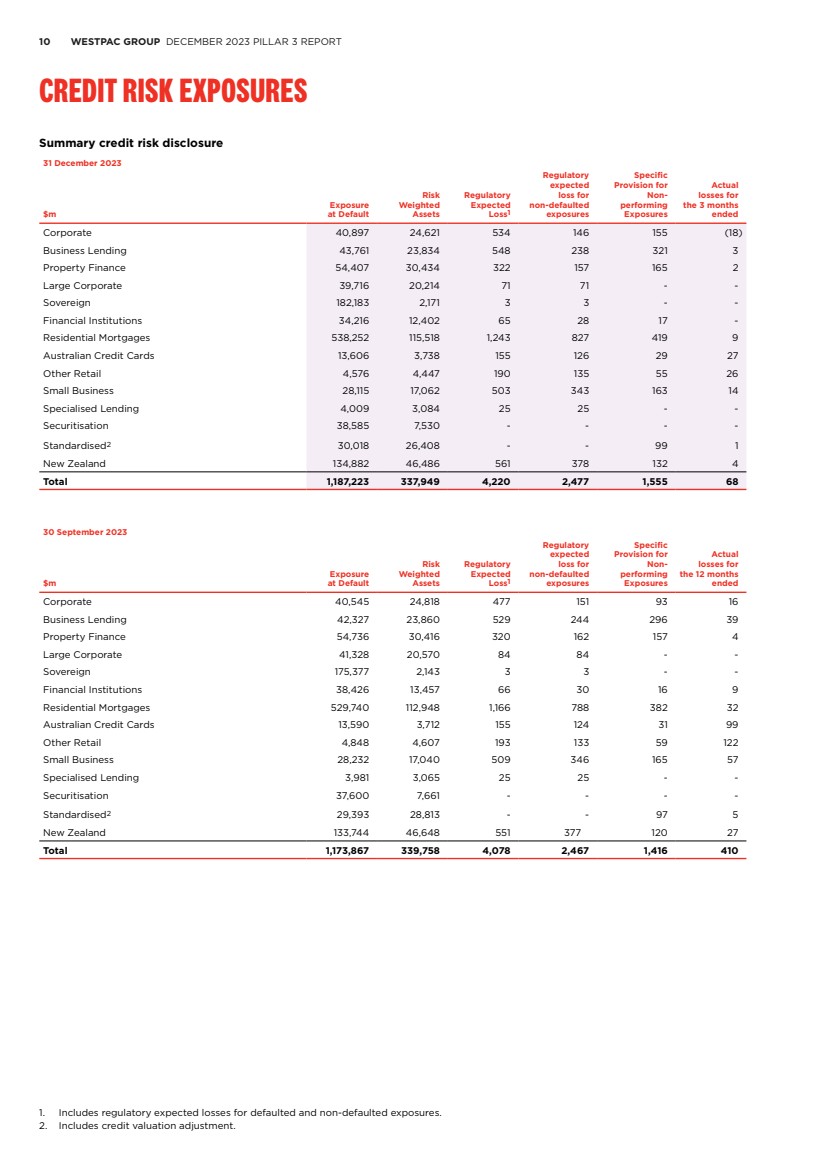
| 10 WESTPAC GROUP DECEMBER 2023 PILLAR 3 REPORT CREDIT RISK EXPOSURES Summary credit risk disclosure 31 December 2023 $m Exposure at Default Risk Weighted Assets Regulatory Expected Loss1 Regulatory expected loss for non-defaulted exposures Specific Provision for Non-performing Exposures Actual losses for the 3 months ended Corporate 40,897 24,621 534 146 155 (18) Business Lending 43,761 23,834 548 238 321 3 Property Finance 54,407 30,434 322 157 165 2 Large Corporate 39,716 20,214 71 71 - - Sovereign 182,183 2,171 3 3 - - Financial Institutions 34,216 12,402 65 28 17 - Residential Mortgages 538,252 115,518 1,243 827 419 9 Australian Credit Cards 13,606 3,738 155 126 29 27 Other Retail 4,576 4,447 190 135 55 26 Small Business 28,115 17,062 503 343 163 14 Specialised Lending 4,009 3,084 25 25 - - Securitisation 38,585 7,530 - - - - Standardised2 30,018 26,408 - - 99 1 New Zealand 134,882 46,486 561 378 132 4 Total 1,187,223 337,949 4,220 2,477 1,555 68 30 September 2023 $m Exposure at Default Risk Weighted Assets Regulatory Expected Loss1 Regulatory expected loss for non-defaulted exposures Specific Provision for Non-performing Exposures Actual losses for the 12 months ended Corporate 40,545 24,818 477 151 93 16 Business Lending 42,327 23,860 529 244 296 39 Property Finance 54,736 30,416 320 162 157 4 Large Corporate 41,328 20,570 84 84 - - Sovereign 175,377 2,143 3 3 - - Financial Institutions 38,426 13,457 66 30 16 9 Residential Mortgages 529,740 112,948 1,166 788 382 32 Australian Credit Cards 13,590 3,712 155 124 31 99 Other Retail 4,848 4,607 193 133 59 122 Small Business 28,232 17,040 509 346 165 57 Specialised Lending 3,981 3,065 25 25 - - Securitisation 37,600 7,661 - - - - Standardised2 29,393 28,813 - - 97 5 New Zealand 133,744 46,648 551 377 120 27 Total 1,173,867 339,758 4,078 2,467 1,416 410 1. Includes regulatory expected losses for defaulted and non-defaulted exposures. 2. Includes credit valuation adjustment. CREDIT RISK EXPOSURES |
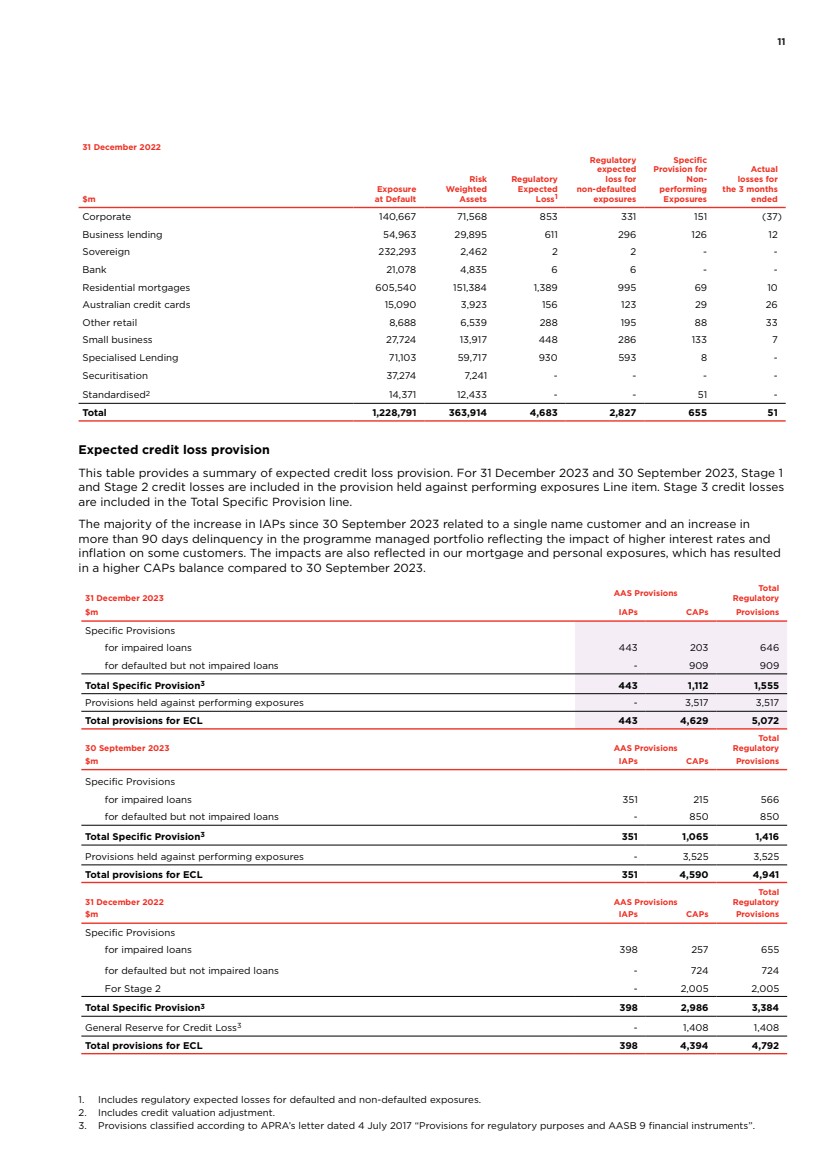
| 11 Expected credit loss provision This table provides a summary of expected credit loss provision. For 31 December 2023 and 30 September 2023, Stage 1 and Stage 2 credit losses are included in the provision held against performing exposures Line item. Stage 3 credit losses are included in the Total Specific Provision line. The majority of the increase in IAPs since 30 September 2023 related to a single name customer and an increase in more than 90 days delinquency in the programme managed portfolio reflecting the impact of higher interest rates and inflation on some customers. The impacts are also reflected in our mortgage and personal exposures, which has resulted in a higher CAPs balance compared to 30 September 2023. 31 December 2023 AAS Provisions Total Regulatory $m IAPs CAPs Provisions Specific Provisions for impaired loans 443 203 646 for defaulted but not impaired loans - 909 909 Total Specific Provision3 443 1,112 1,555 Provisions held against performing exposures - 3,517 3,517 Total provisions for ECL 443 4,629 5,072 30 September 2023 AAS Provisions Total Regulatory $m IAPs CAPs Provisions Specific Provisions for impaired loans 351 215 566 for defaulted but not impaired loans - 850 850 Total Specific Provision3 351 1,065 1,416 Provisions held against performing exposures - 3,525 3,525 Total provisions for ECL 351 4,590 4,941 31 December 2022 AAS Provisions Total Regulatory $m IAPs CAPs Provisions Specific Provisions for impaired loans 398 257 655 for defaulted but not impaired loans - 724 724 For Stage 2 - 2,005 2,005 Total Specific Provision3 398 2,986 3,384 General Reserve for Credit Loss3 - 1,408 1,408 Total provisions for ECL 398 4,394 4,792 1. Includes regulatory expected losses for defaulted and non-defaulted exposures. 2. Includes credit valuation adjustment. 3. Provisions classified according to APRA’s letter dated 4 July 2017 “Provisions for regulatory purposes and AASB 9 financial instruments”. 31 December 2022 $m Exposure at Default Risk Weighted Assets Regulatory Expected Loss1 Regulatory expected loss for non-defaulted exposures Specific Provision for Non-performing Exposures Actual losses for the 3 months ended Corporate 140,667 71,568 853 331 151 (37) Business lending 54,963 29,895 611 296 126 12 Sovereign 232,293 2,462 2 2 - - Bank 21,078 4,835 6 6 - - Residential mortgages 605,540 151,384 1,389 995 69 10 Australian credit cards 15,090 3,923 156 123 29 26 Other retail 8,688 6,539 288 195 88 33 Small business 27,724 13,917 448 286 133 7 Specialised Lending 71,103 59,717 930 593 8 - Securitisation 37,274 7,241 - - - - Standardised2 14,371 12,433 - - 51 - Total 1,228,791 363,914 4,683 2,827 655 51 Credit risk exposures |
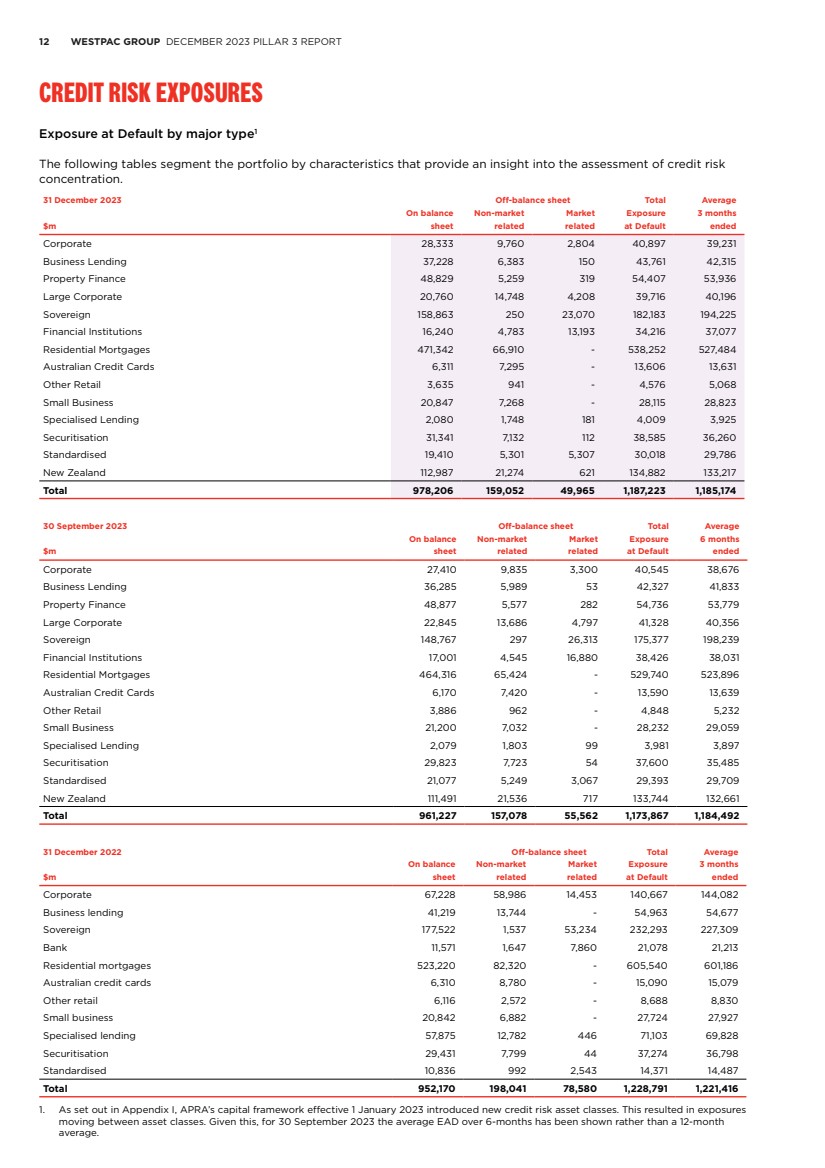
| 12 WESTPAC GROUP DECEMBER 2023 PILLAR 3 REPORT Credit risk exposures Exposure at Default by major type1 The following tables segment the portfolio by characteristics that provide an insight into the assessment of credit risk concentration. 31 December 2023 Off-balance sheet Total Average On balance Non-market Market Exposure 3 months $m sheet related related at Default ended Corporate 28,333 9,760 2,804 40,897 39,231 Business Lending 37,228 6,383 150 43,761 42,315 Property Finance 48,829 5,259 319 54,407 53,936 Large Corporate 20,760 14,748 4,208 39,716 40,196 Sovereign 158,863 250 23,070 182,183 194,225 Financial Institutions 16,240 4,783 13,193 34,216 37,077 Residential Mortgages 471,342 66,910 - 538,252 527,484 Australian Credit Cards 6,311 7,295 - 13,606 13,631 Other Retail 3,635 941 - 4,576 5,068 Small Business 20,847 7,268 - 28,115 28,823 Specialised Lending 2,080 1,748 181 4,009 3,925 Securitisation 31,341 7,132 112 38,585 36,260 Standardised 19,410 5,301 5,307 30,018 29,786 New Zealand 112,987 21,274 621 134,882 133,217 Total 978,206 159,052 49,965 1,187,223 1,185,174 30 September 2023 Off-balance sheet Total Average On balance Non-market Market Exposure 6 months $m sheet related related at Default ended Corporate 27,410 9,835 3,300 40,545 38,676 Business Lending 36,285 5,989 53 42,327 41,833 Property Finance 48,877 5,577 282 54,736 53,779 Large Corporate 22,845 13,686 4,797 41,328 40,356 Sovereign 148,767 297 26,313 175,377 198,239 Financial Institutions 17,001 4,545 16,880 38,426 38,031 Residential Mortgages 464,316 65,424 - 529,740 523,896 Australian Credit Cards 6,170 7,420 - 13,590 13,639 Other Retail 3,886 962 - 4,848 5,232 Small Business 21,200 7,032 - 28,232 29,059 Specialised Lending 2,079 1,803 99 3,981 3,897 Securitisation 29,823 7,723 54 37,600 35,485 Standardised 21,077 5,249 3,067 29,393 29,709 New Zealand 111,491 21,536 717 133,744 132,661 Total 961,227 157,078 55,562 1,173,867 1,184,492 31 December 2022 Off-balance sheet Total Average On balance Non-market Market Exposure 3 months $m sheet related related at Default ended Corporate 67,228 58,986 14,453 140,667 144,082 Business lending 41,219 13,744 - 54,963 54,677 Sovereign 177,522 1,537 53,234 232,293 227,309 Bank 11,571 1,647 7,860 21,078 21,213 Residential mortgages 523,220 82,320 - 605,540 601,186 Australian credit cards 6,310 8,780 - 15,090 15,079 Other retail 6,116 2,572 - 8,688 8,830 Small business 20,842 6,882 - 27,724 27,927 Specialised lending 57,875 12,782 446 71,103 69,828 Securitisation 29,431 7,799 44 37,274 36,798 Standardised 10,836 992 2,543 14,371 14,487 Total 952,170 198,041 78,580 1,228,791 1,221,416 1. As set out in Appendix I, APRA’s capital framework effective 1 January 2023 introduced new credit risk asset classes. This resulted in exposures moving between asset classes. Given this, for 30 September 2023 the average EAD over 6-months has been shown rather than a 12-month average. |
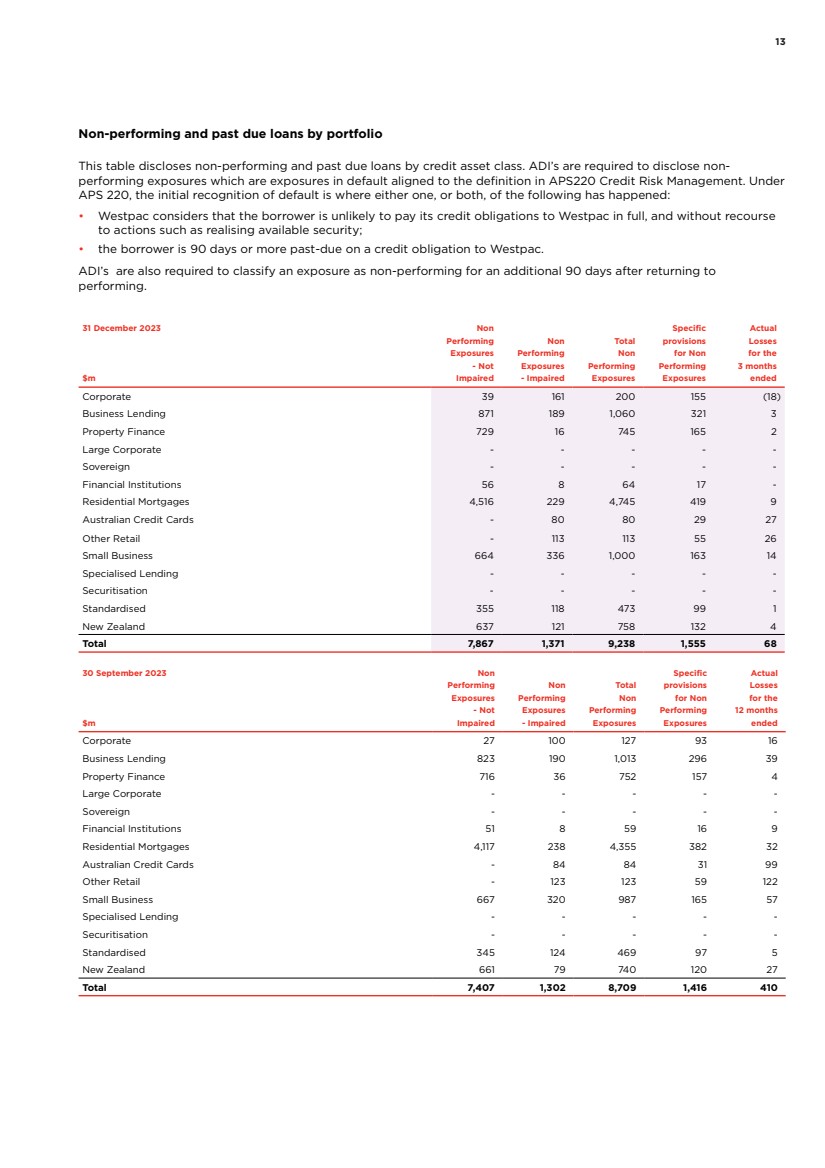
| 13 Non-performing and past due loans by portfolio This table discloses non-performing and past due loans by credit asset class. ADI’s are required to disclose non-performing exposures which are exposures in default aligned to the definition in APS220 Credit Risk Management. Under APS 220, the initial recognition of default is where either one, or both, of the following has happened: • Westpac considers that the borrower is unlikely to pay its credit obligations to Westpac in full, and without recourse to actions such as realising available security; • the borrower is 90 days or more past-due on a credit obligation to Westpac. ADI’s are also required to classify an exposure as non-performing for an additional 90 days after returning to performing. 31 December 2023 Non Specific Actual Performing Non Total provisions Losses Exposures Performing Non for Non for the - Not Exposures Performing Performing 3 months $m Impaired - Impaired Exposures Exposures ended Corporate 39 161 200 155 (18) Business Lending 871 189 1,060 321 3 Property Finance 729 16 745 165 2 Large Corporate - - - - - Sovereign - - - - - Financial Institutions 56 8 64 17 - Residential Mortgages 4,516 229 4,745 419 9 Australian Credit Cards - 80 80 29 27 Other Retail - 113 113 55 26 Small Business 664 336 1,000 163 14 Specialised Lending - - - - - Securitisation - - - - - Standardised 355 118 473 99 1 New Zealand 637 121 758 132 4 Total 7,867 1,371 9,238 1,555 68 30 September 2023 Non Specific Actual Performing Non Total provisions Losses Exposures Performing Non for Non for the - Not Exposures Performing Performing 12 months $m Impaired - Impaired Exposures Exposures ended Corporate 27 100 127 93 16 Business Lending 823 190 1,013 296 39 Property Finance 716 36 752 157 4 Large Corporate - - - - - Sovereign - - - - - Financial Institutions 51 8 59 16 9 Residential Mortgages 4,117 238 4,355 382 32 Australian Credit Cards - 84 84 31 99 Other Retail - 123 123 59 122 Small Business 667 320 987 165 57 Specialised Lending - - - - - Securitisation - - - - - Standardised 345 124 469 97 5 New Zealand 661 79 740 120 27 Total 7,407 1,302 8,709 1,416 410 |
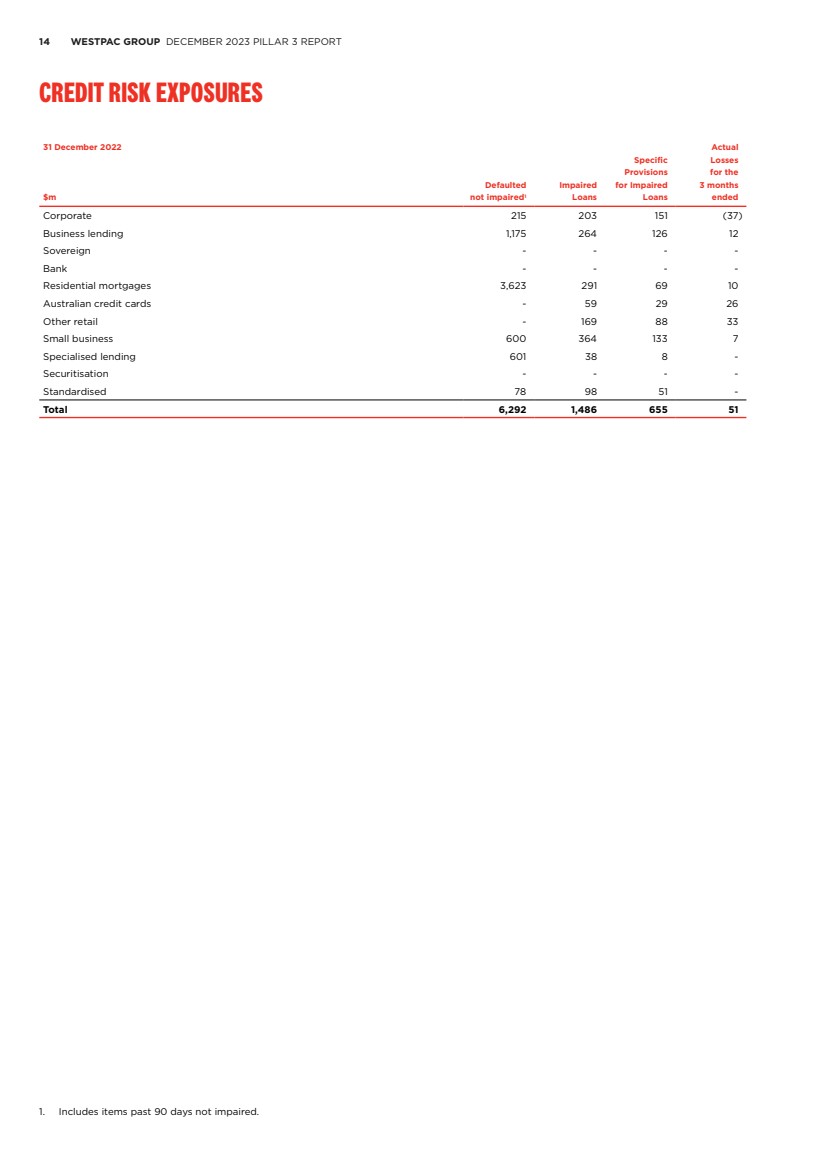
| 14 WESTPAC GROUP DECEMBER 2023 PILLAR 3 REPORT Credit risk exposures 31 December 2022 Actual Specific Losses Provisions for the Defaulted Impaired for Impaired 3 months $m not impaired1 Loans Loans ended Corporate 215 203 151 (37) Business lending 1,175 264 126 12 Sovereign - - - - Bank - - - - Residential mortgages 3,623 291 69 10 Australian credit cards - 59 29 26 Other retail - 169 88 33 Small business 600 364 133 7 Specialised lending 601 38 8 - Securitisation - - - - Standardised 78 98 51 - Total 6,292 1,486 655 51 1. Includes items past 90 days not impaired. |
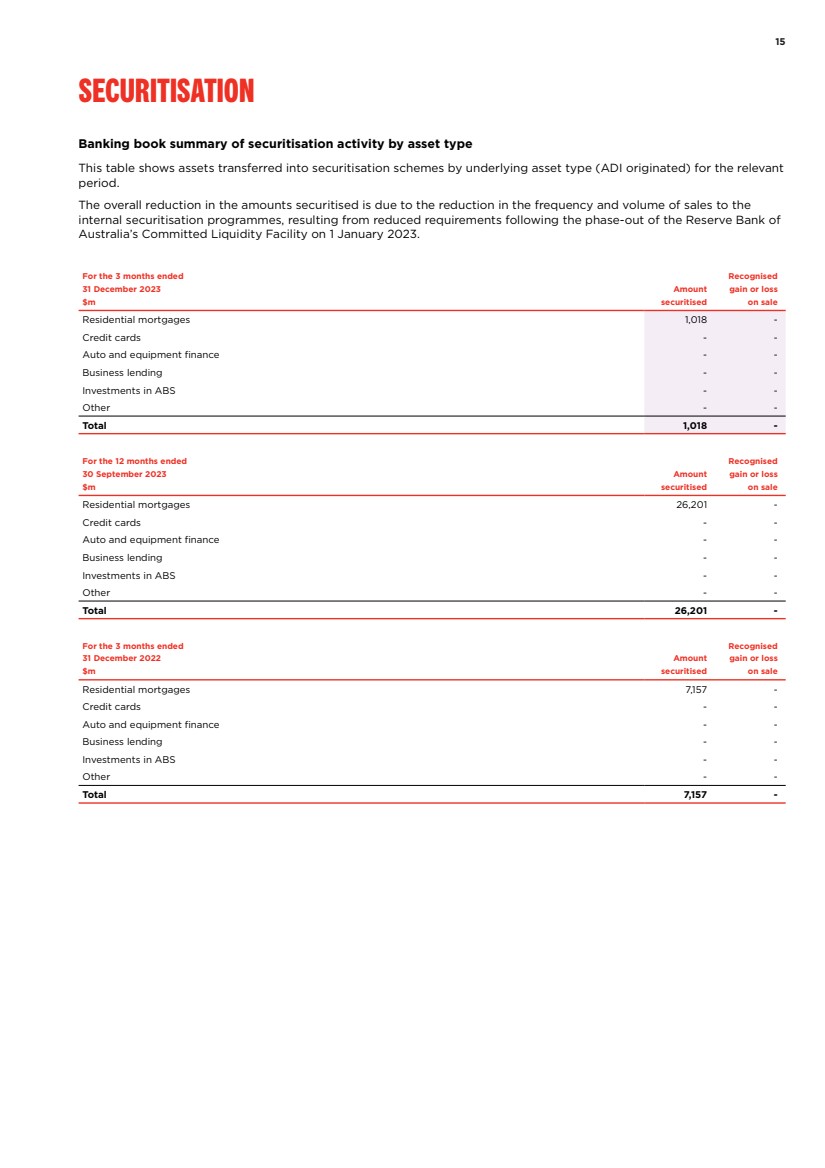
| 15 Securitisation Banking book summary of securitisation activity by asset type This table shows assets transferred into securitisation schemes by underlying asset type (ADI originated) for the relevant period. The overall reduction in the amounts securitised is due to the reduction in the frequency and volume of sales to the internal securitisation programmes, resulting from reduced requirements following the phase-out of the Reserve Bank of Australia’s Committed Liquidity Facility on 1 January 2023. For the 3 months ended Recognised 31 December 2023 Amount gain or loss $m securitised on sale Residential mortgages 1,018 - Credit cards - - Auto and equipment finance - - Business lending - - Investments in ABS - - Other - - Total 1,018 - For the 12 months ended Recognised 30 September 2023 Amount gain or loss $m securitised on sale Residential mortgages 26,201 - Credit cards - - Auto and equipment finance - - Business lending - - Investments in ABS - - Other - - Total 26,201 - For the 3 months ended Recognised 31 December 2022 Amount gain or loss $m securitised on sale Residential mortgages 7,157 - Credit cards - - Auto and equipment finance - - Business lending - - Investments in ABS - - Other - - Total 7,157 - |
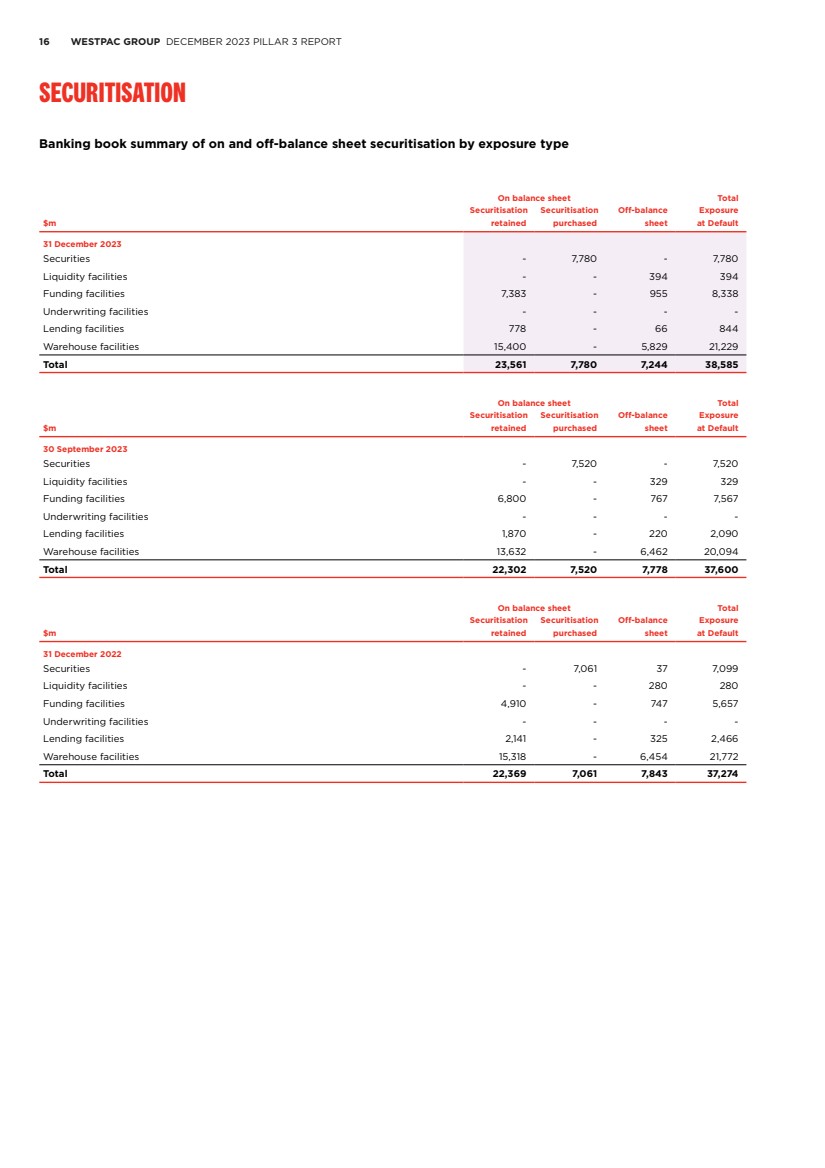
| 16 WESTPAC GROUP DECEMBER 2023 PILLAR 3 REPORT Securitisation Banking book summary of on and off-balance sheet securitisation by exposure type On balance sheet Total Securitisation Securitisation Off-balance Exposure $m retained purchased sheet at Default 31 December 2023 Securities - 7,780 - 7,780 Liquidity facilities - - 394 394 Funding facilities 7,383 - 955 8,338 Underwriting facilities - - - - Lending facilities 778 - 66 844 Warehouse facilities 15,400 - 5,829 21,229 Total 23,561 7,780 7,244 38,585 On balance sheet Total Securitisation Securitisation Off-balance Exposure $m retained purchased sheet at Default 30 September 2023 Securities - 7,520 - 7,520 Liquidity facilities - - 329 329 Funding facilities 6,800 - 767 7,567 Underwriting facilities - - - - Lending facilities 1,870 - 220 2,090 Warehouse facilities 13,632 - 6,462 20,094 Total 22,302 7,520 7,778 37,600 On balance sheet Total Securitisation Securitisation Off-balance Exposure $m retained purchased sheet at Default 31 December 2022 Securities - 7,061 37 7,099 Liquidity facilities - - 280 280 Funding facilities 4,910 - 747 5,657 Underwriting facilities - - - - Lending facilities 2,141 - 325 2,466 Warehouse facilities 15,318 - 6,454 21,772 Total 22,369 7,061 7,843 37,274 |
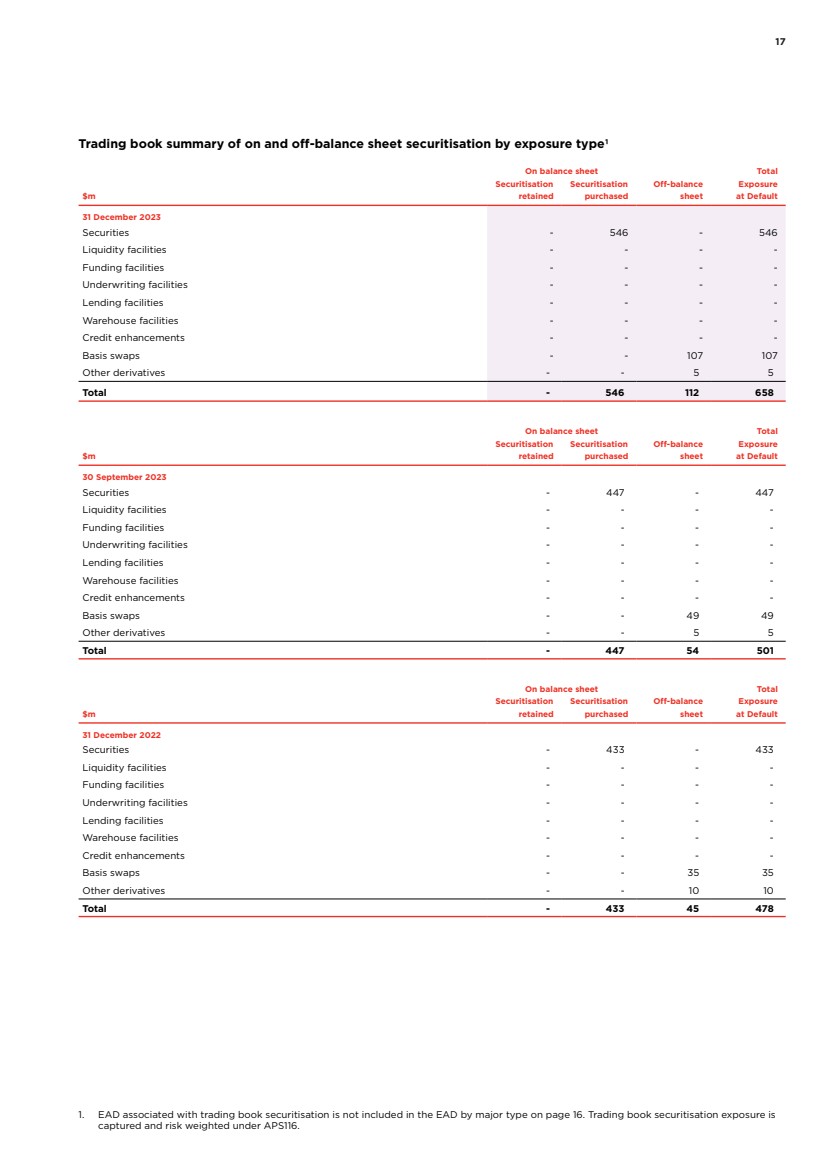
| 17 Trading book summary of on and off-balance sheet securitisation by exposure type1 On balance sheet Total Securitisation Securitisation Off-balance Exposure $m retained purchased sheet at Default 31 December 2023 Securities - 546 - 546 Liquidity facilities - - - - Funding facilities - - - - Underwriting facilities - - - - Lending facilities - - - - Warehouse facilities - - - - Credit enhancements - - - - Basis swaps - - 107 107 Other derivatives - - 5 5 Total - 546 112 658 On balance sheet Total Securitisation Securitisation Off-balance Exposure $m retained purchased sheet at Default 30 September 2023 Securities - 447 - 447 Liquidity facilities - - - - Funding facilities - - - - Underwriting facilities - - - - Lending facilities - - - - Warehouse facilities - - - - Credit enhancements - - - - Basis swaps - - 49 49 Other derivatives - - 5 5 Total - 447 54 501 On balance sheet Total Securitisation Securitisation Off-balance Exposure $m retained purchased sheet at Default 31 December 2022 Securities - 433 - 433 Liquidity facilities - - - - Funding facilities - - - - Underwriting facilities - - - - Lending facilities - - - - Warehouse facilities - - - - Credit enhancements - - - - Basis swaps - - 35 35 Other derivatives - - 10 10 Total - 433 45 478 1. EAD associated with trading book securitisation is not included in the EAD by major type on page 16. Trading book securitisation exposure is captured and risk weighted under APS116. |
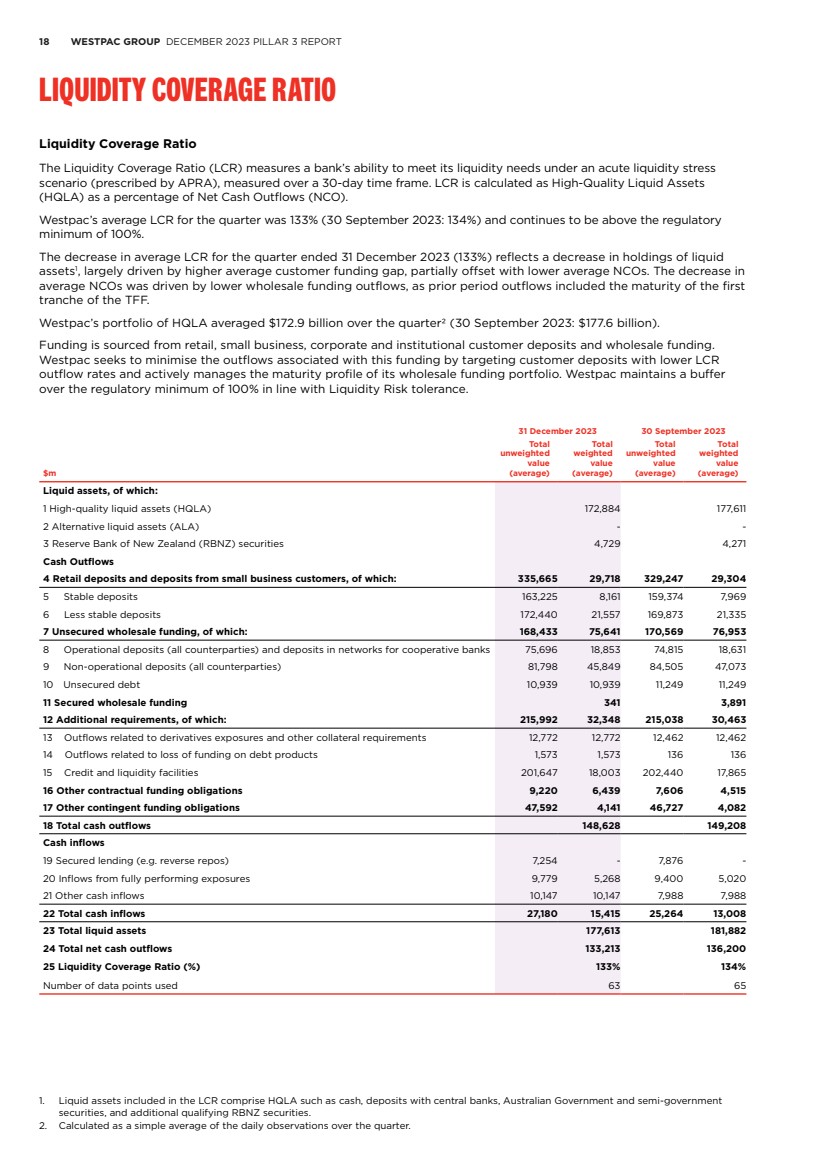
| 18 WESTPAC GROUP DECEMBER 2023 PILLAR 3 REPORT Liquidity Coverage Ratio Liquidity Coverage Ratio The Liquidity Coverage Ratio (LCR) measures a bank’s ability to meet its liquidity needs under an acute liquidity stress scenario (prescribed by APRA), measured over a 30-day time frame. LCR is calculated as High-Quality Liquid Assets (HQLA) as a percentage of Net Cash Outflows (NCO). Westpac’s average LCR for the quarter was 133% (30 September 2023: 134%) and continues to be above the regulatory minimum of 100%. The decrease in average LCR for the quarter ended 31 December 2023 (133%) reflects a decrease in holdings of liquid assets1 , largely driven by higher average customer funding gap, partially offset with lower average NCOs. The decrease in average NCOs was driven by lower wholesale funding outflows, as prior period outflows included the maturity of the first tranche of the TFF. Westpac’s portfolio of HQLA averaged $172.9 billion over the quarter2 (30 September 2023: $177.6 billion). Funding is sourced from retail, small business, corporate and institutional customer deposits and wholesale funding. Westpac seeks to minimise the outflows associated with this funding by targeting customer deposits with lower LCR outflow rates and actively manages the maturity profile of its wholesale funding portfolio. Westpac maintains a buffer over the regulatory minimum of 100% in line with Liquidity Risk tolerance. 31 December 2023 30 September 2023 $m Total unweighted value (average) Total weighted value (average) Total unweighted value (average) Total weighted value (average) Liquid assets, of which: 1 High-quality liquid assets (HQLA) 172,884 177,611 2 Alternative liquid assets (ALA) - - 3 Reserve Bank of New Zealand (RBNZ) securities 4,729 4,271 Cash Outflows 4 Retail deposits and deposits from small business customers, of which: 335,665 29,718 329,247 29,304 5 Stable deposits 163,225 8,161 159,374 7,969 6 Less stable deposits 172,440 21,557 169,873 21,335 7 Unsecured wholesale funding, of which: 168,433 75,641 170,569 76,953 8 Operational deposits (all counterparties) and deposits in networks for cooperative banks 75,696 18,853 74,815 18,631 9 Non-operational deposits (all counterparties) 81,798 45,849 84,505 47,073 10 Unsecured debt 10,939 10,939 11,249 11,249 11 Secured wholesale funding 341 3,891 12 Additional requirements, of which: 215,992 32,348 215,038 30,463 13 Outflows related to derivatives exposures and other collateral requirements 12,772 12,772 12,462 12,462 14 Outflows related to loss of funding on debt products 1,573 1,573 136 136 15 Credit and liquidity facilities 201,647 18,003 202,440 17,865 16 Other contractual funding obligations 9,220 6,439 7,606 4,515 17 Other contingent funding obligations 47,592 4,141 46,727 4,082 18 Total cash outflows 148,628 149,208 Cash inflows 19 Secured lending (e.g. reverse repos) 7,254 - 7,876 - 20 Inflows from fully performing exposures 9,779 5,268 9,400 5,020 21 Other cash inflows 10,147 10,147 7,988 7,988 22 Total cash inflows 27,180 15,415 25,264 13,008 23 Total liquid assets 177,613 181,882 24 Total net cash outflows 133,213 136,200 25 Liquidity Coverage Ratio (%) 133% 134% Number of data points used 63 65 1. Liquid assets included in the LCR comprise HQLA such as cash, deposits with central banks, Australian Government and semi-government securities, and additional qualifying RBNZ securities. 2. Calculated as a simple average of the daily observations over the quarter. Liquidity Coverage Ratio |
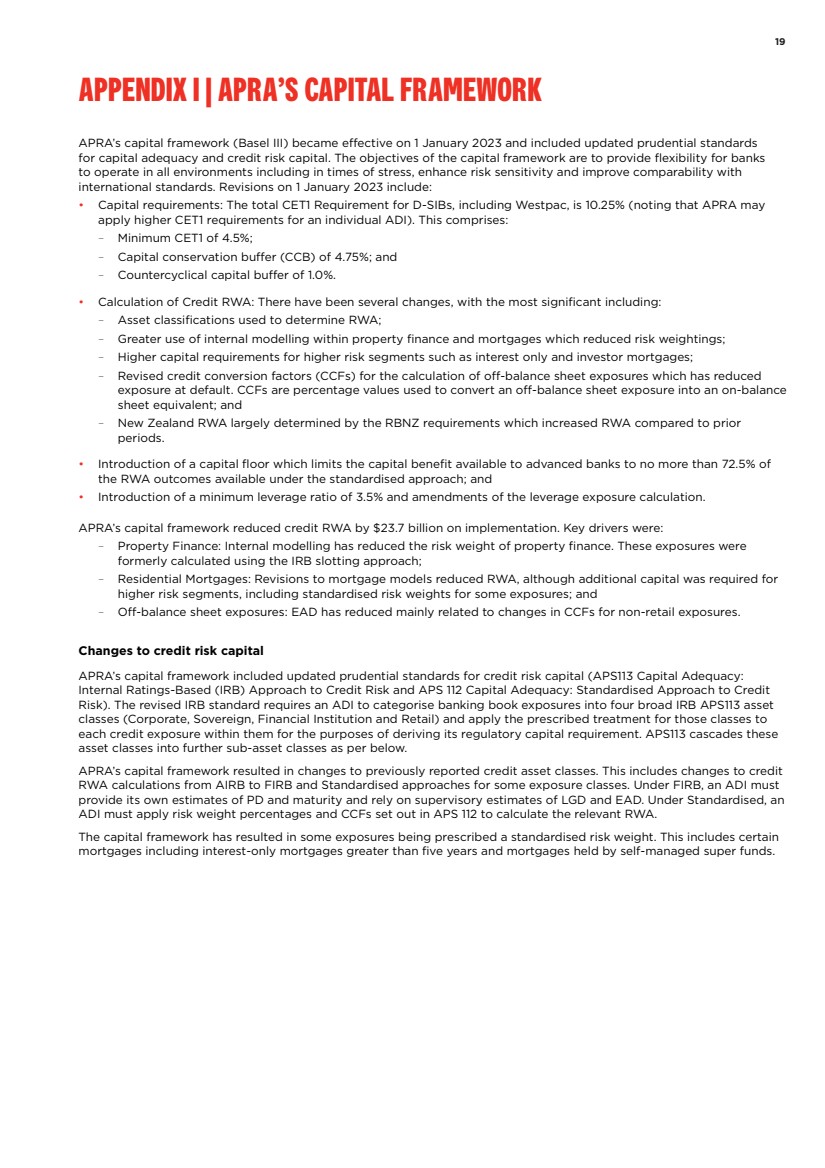
| 19 Appendix I | APRA’s capital framework APRA’s capital framework (Basel III) became effective on 1 January 2023 and included updated prudential standards for capital adequacy and credit risk capital. The objectives of the capital framework are to provide flexibility for banks to operate in all environments including in times of stress, enhance risk sensitivity and improve comparability with international standards. Revisions on 1 January 2023 include: • Capital requirements: The total CET1 Requirement for D-SIBs, including Westpac, is 10.25% (noting that APRA may apply higher CET1 requirements for an individual ADI). This comprises: – Minimum CET1 of 4.5%; – Capital conservation buffer (CCB) of 4.75%; and – Countercyclical capital buffer of 1.0%. • Calculation of Credit RWA: There have been several changes, with the most significant including: – Asset classifications used to determine RWA; – Greater use of internal modelling within property finance and mortgages which reduced risk weightings; – Higher capital requirements for higher risk segments such as interest only and investor mortgages; – Revised credit conversion factors (CCFs) for the calculation of off-balance sheet exposures which has reduced exposure at default. CCFs are percentage values used to convert an off-balance sheet exposure into an on-balance sheet equivalent; and – New Zealand RWA largely determined by the RBNZ requirements which increased RWA compared to prior periods. • Introduction of a capital floor which limits the capital benefit available to advanced banks to no more than 72.5% of the RWA outcomes available under the standardised approach; and • Introduction of a minimum leverage ratio of 3.5% and amendments of the leverage exposure calculation. APRA’s capital framework reduced credit RWA by $23.7 billion on implementation. Key drivers were: – Property Finance: Internal modelling has reduced the risk weight of property finance. These exposures were formerly calculated using the IRB slotting approach; – Residential Mortgages: Revisions to mortgage models reduced RWA, although additional capital was required for higher risk segments, including standardised risk weights for some exposures; and – Off-balance sheet exposures: EAD has reduced mainly related to changes in CCFs for non-retail exposures. Changes to credit risk capital APRA’s capital framework included updated prudential standards for credit risk capital (APS113 Capital Adequacy: Internal Ratings-Based (IRB) Approach to Credit Risk and APS 112 Capital Adequacy: Standardised Approach to Credit Risk). The revised IRB standard requires an ADI to categorise banking book exposures into four broad IRB APS113 asset classes (Corporate, Sovereign, Financial Institution and Retail) and apply the prescribed treatment for those classes to each credit exposure within them for the purposes of deriving its regulatory capital requirement. APS113 cascades these asset classes into further sub-asset classes as per below. APRA’s capital framework resulted in changes to previously reported credit asset classes. This includes changes to credit RWA calculations from AIRB to FIRB and Standardised approaches for some exposure classes. Under FIRB, an ADI must provide its own estimates of PD and maturity and rely on supervisory estimates of LGD and EAD. Under Standardised, an ADI must apply risk weight percentages and CCFs set out in APS 112 to calculate the relevant RWA. The capital framework has resulted in some exposures being prescribed a standardised risk weight. This includes certain mortgages including interest-only mortgages greater than five years and mortgages held by self-managed super funds. Appendix I | APRA’s capital framework |
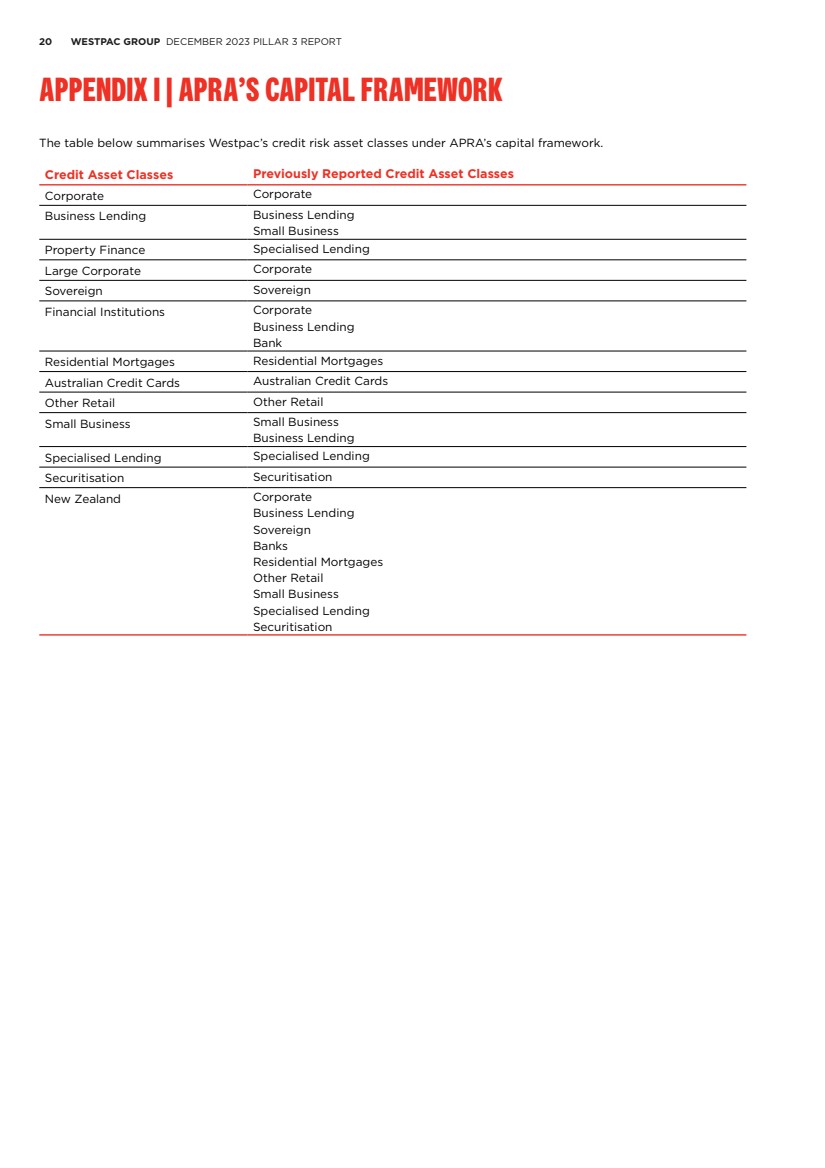
| 20 WESTPAC GROUP DECEMBER 2023 PILLAR 3 REPORT Appendix I | APRA’s capital framework The table below summarises Westpac’s credit risk asset classes under APRA’s capital framework. Credit Asset Classes Previously Reported Credit Asset Classes Corporate Corporate Business Lending Business Lending Small Business Property Finance Specialised Lending Large Corporate Corporate Sovereign Sovereign Financial Institutions Corporate Business Lending Bank Residential Mortgages Residential Mortgages Australian Credit Cards Australian Credit Cards Other Retail Other Retail Small Business Small Business Business Lending Specialised Lending Specialised Lending Securitisation Securitisation New Zealand Corporate Business Lending Sovereign Banks Residential Mortgages Other Retail Small Business Specialised Lending Securitisation |
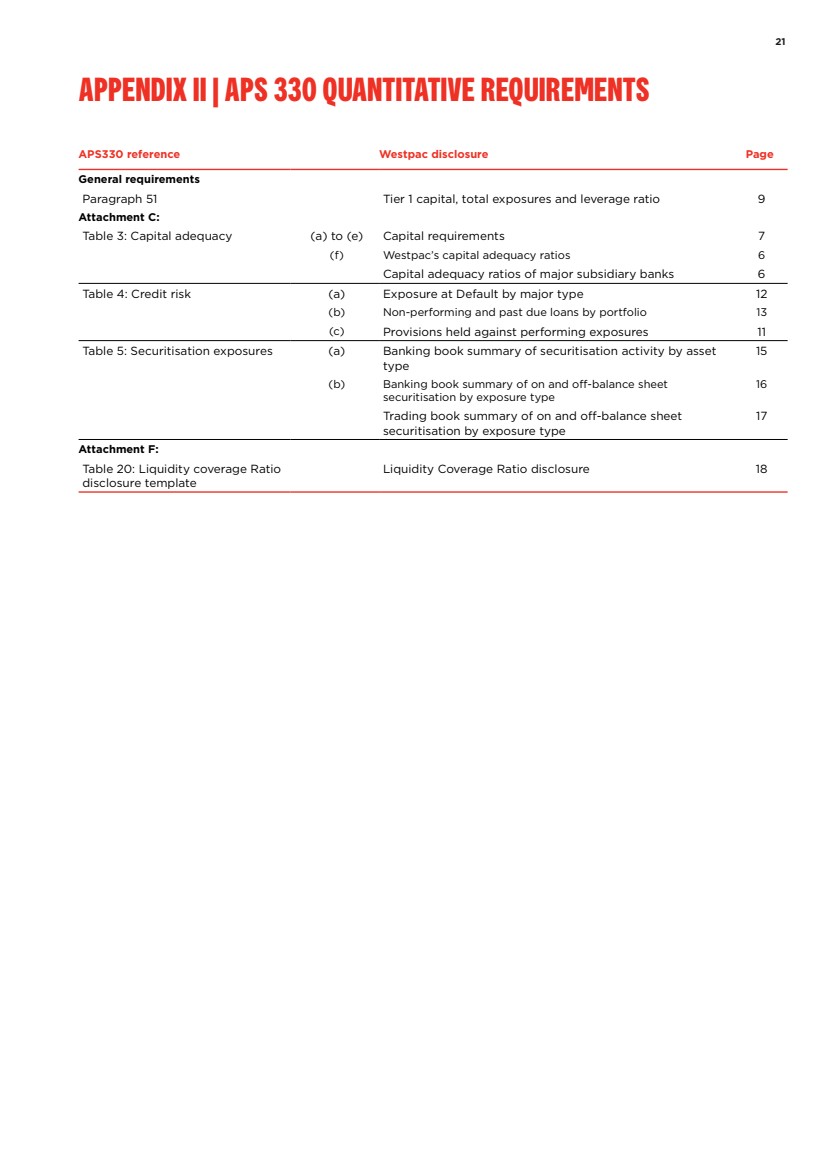
| 21 APPENDIX II | APS 330 quantitative requirements APS330 reference Westpac disclosure Page General requirements Paragraph 51 Tier 1 capital, total exposures and leverage ratio 9 Attachment C: Table 3: Capital adequacy (a) to (e) Capital requirements 7 (f) Westpac’s capital adequacy ratios 6 Capital adequacy ratios of major subsidiary banks 6 Table 4: Credit risk (a) Exposure at Default by major type 12 (b) Non-performing and past due loans by portfolio 13 (c) Provisions held against performing exposures 11 Table 5: Securitisation exposures (a) Banking book summary of securitisation activity by asset type 15 (b) Banking book summary of on and off-balance sheet securitisation by exposure type 16 Trading book summary of on and off-balance sheet securitisation by exposure type 17 Attachment F: Table 20: Liquidity coverage Ratio disclosure template Liquidity Coverage Ratio disclosure 18 APPENDIX II | APS 330 quantitative requirements |
| 22 WESTPAC GROUP DECEMBER 2023 PILLAR 3 REPORT APPENDIX III | EXCHANGE RATES Exchange rates The following exchange rates were used in the Westpac Pillar 3 report, and reflect spot rates for the period end. 31 Dec 30 Sept 31 Dec 2023 2023 2022 USD 0.6842 0.6469 0.6778 GBP 0.5364 0.5285 0.5623 NZD 1.0769 1.0741 1.0704 EUR 0.6184 0.6110 0.6360 APPENDIX III | EXCHANGE RATES |
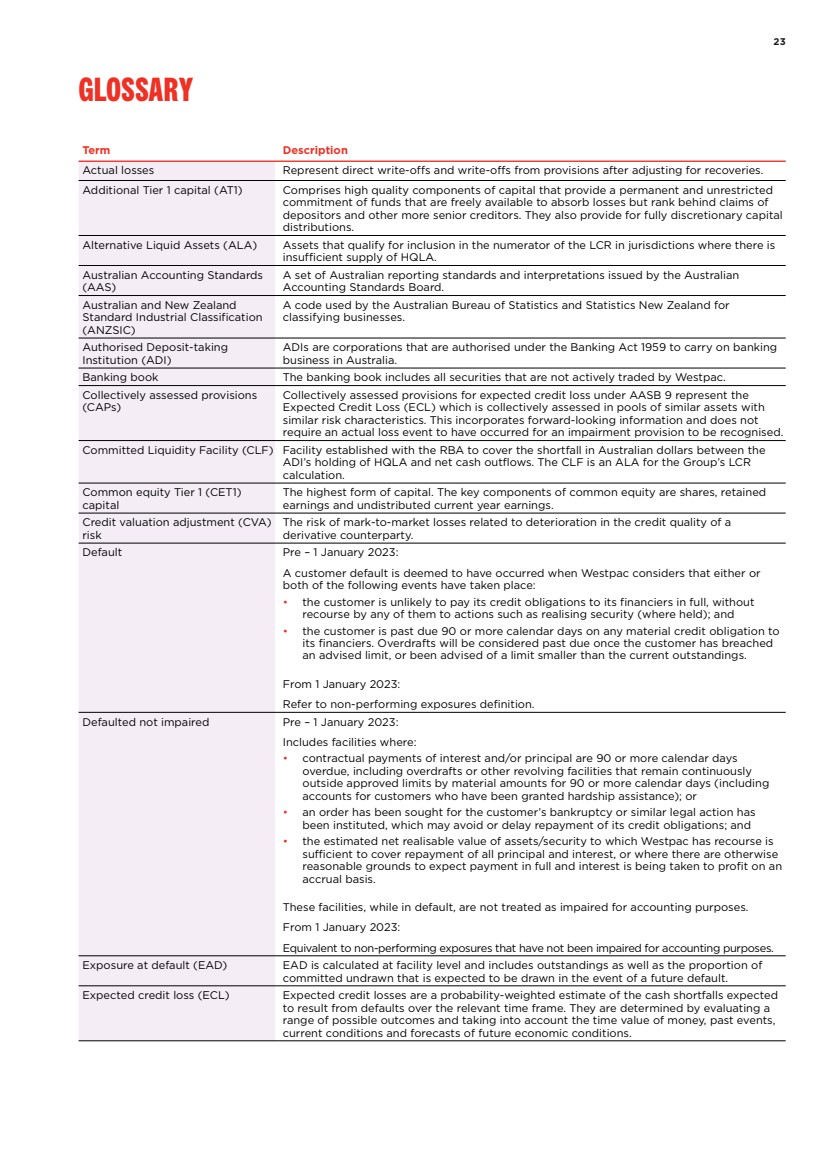
| 23 GLOSSARY Term Description Actual losses Represent direct write-offs and write-offs from provisions after adjusting for recoveries. Additional Tier 1 capital (AT1) Comprises high quality components of capital that provide a permanent and unrestricted commitment of funds that are freely available to absorb losses but rank behind claims of depositors and other more senior creditors. They also provide for fully discretionary capital distributions. Alternative Liquid Assets (ALA) Assets that qualify for inclusion in the numerator of the LCR in jurisdictions where there is insufficient supply of HQLA. Australian Accounting Standards (AAS) A set of Australian reporting standards and interpretations issued by the Australian Accounting Standards Board. Australian and New Zealand Standard Industrial Classification (ANZSIC) A code used by the Australian Bureau of Statistics and Statistics New Zealand for classifying businesses. Authorised Deposit-taking Institution (ADI) ADIs are corporations that are authorised under the Banking Act 1959 to carry on banking business in Australia. Banking book The banking book includes all securities that are not actively traded by Westpac. Collectively assessed provisions (CAPs) Collectively assessed provisions for expected credit loss under AASB 9 represent the Expected Credit Loss (ECL) which is collectively assessed in pools of similar assets with similar risk characteristics. This incorporates forward-looking information and does not require an actual loss event to have occurred for an impairment provision to be recognised. Committed Liquidity Facility (CLF) Facility established with the RBA to cover the shortfall in Australian dollars between the ADI’s holding of HQLA and net cash outflows. The CLF is an ALA for the Group’s LCR calculation. Common equity Tier 1 (CET1) capital The highest form of capital. The key components of common equity are shares, retained earnings and undistributed current year earnings. Credit valuation adjustment (CVA) risk The risk of mark-to-market losses related to deterioration in the credit quality of a derivative counterparty. Default Pre – 1 January 2023: A customer default is deemed to have occurred when Westpac considers that either or both of the following events have taken place: • the customer is unlikely to pay its credit obligations to its financiers in full, without recourse by any of them to actions such as realising security (where held); and • the customer is past due 90 or more calendar days on any material credit obligation to its financiers. Overdrafts will be considered past due once the customer has breached an advised limit, or been advised of a limit smaller than the current outstandings. From 1 January 2023: Refer to non-performing exposures definition. Defaulted not impaired Pre – 1 January 2023: Includes facilities where: • contractual payments of interest and/or principal are 90 or more calendar days overdue, including overdrafts or other revolving facilities that remain continuously outside approved limits by material amounts for 90 or more calendar days (including accounts for customers who have been granted hardship assistance); or • an order has been sought for the customer’s bankruptcy or similar legal action has been instituted, which may avoid or delay repayment of its credit obligations; and • the estimated net realisable value of assets/security to which Westpac has recourse is sufficient to cover repayment of all principal and interest, or where there are otherwise reasonable grounds to expect payment in full and interest is being taken to profit on an accrual basis. These facilities, while in default, are not treated as impaired for accounting purposes. From 1 January 2023: Equivalent to non-performing exposures that have not been impaired for accounting purposes. Exposure at default (EAD) EAD is calculated at facility level and includes outstandings as well as the proportion of committed undrawn that is expected to be drawn in the event of a future default. Expected credit loss (ECL) Expected credit losses are a probability-weighted estimate of the cash shortfalls expected to result from defaults over the relevant time frame. They are determined by evaluating a range of possible outcomes and taking into account the time value of money, past events, current conditions and forecasts of future economic conditions. GLOSSARY |
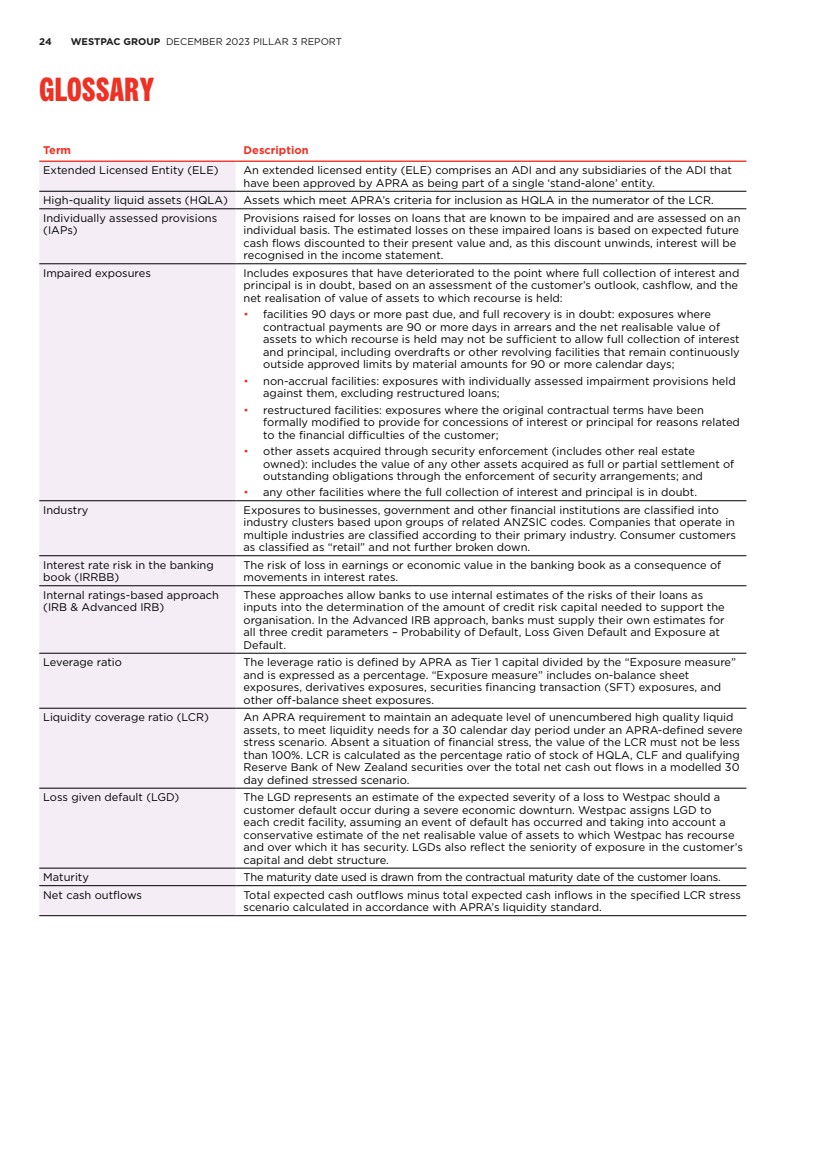
| 24 WESTPAC GROUP DECEMBER 2023 PILLAR 3 REPORT GLOSSARY Term Description Extended Licensed Entity (ELE) An extended licensed entity (ELE) comprises an ADI and any subsidiaries of the ADI that have been approved by APRA as being part of a single ‘stand-alone’ entity. High-quality liquid assets (HQLA) Assets which meet APRA’s criteria for inclusion as HQLA in the numerator of the LCR. Individually assessed provisions (IAPs) Provisions raised for losses on loans that are known to be impaired and are assessed on an individual basis. The estimated losses on these impaired loans is based on expected future cash flows discounted to their present value and, as this discount unwinds, interest will be recognised in the income statement. Impaired exposures Includes exposures that have deteriorated to the point where full collection of interest and principal is in doubt, based on an assessment of the customer’s outlook, cashflow, and the net realisation of value of assets to which recourse is held: • facilities 90 days or more past due, and full recovery is in doubt: exposures where contractual payments are 90 or more days in arrears and the net realisable value of assets to which recourse is held may not be sufficient to allow full collection of interest and principal, including overdrafts or other revolving facilities that remain continuously outside approved limits by material amounts for 90 or more calendar days; • non-accrual facilities: exposures with individually assessed impairment provisions held against them, excluding restructured loans; • restructured facilities: exposures where the original contractual terms have been formally modified to provide for concessions of interest or principal for reasons related to the financial difficulties of the customer; • other assets acquired through security enforcement (includes other real estate owned): includes the value of any other assets acquired as full or partial settlement of outstanding obligations through the enforcement of security arrangements; and • any other facilities where the full collection of interest and principal is in doubt. Industry Exposures to businesses, government and other financial institutions are classified into industry clusters based upon groups of related ANZSIC codes. Companies that operate in multiple industries are classified according to their primary industry. Consumer customers as classified as “retail” and not further broken down. Interest rate risk in the banking book (IRRBB) The risk of loss in earnings or economic value in the banking book as a consequence of movements in interest rates. Internal ratings-based approach (IRB & Advanced IRB) These approaches allow banks to use internal estimates of the risks of their loans as inputs into the determination of the amount of credit risk capital needed to support the organisation. In the Advanced IRB approach, banks must supply their own estimates for all three credit parameters – Probability of Default, Loss Given Default and Exposure at Default. Leverage ratio The leverage ratio is defined by APRA as Tier 1 capital divided by the “Exposure measure” and is expressed as a percentage. “Exposure measure” includes on-balance sheet exposures, derivatives exposures, securities financing transaction (SFT) exposures, and other off-balance sheet exposures. Liquidity coverage ratio (LCR) An APRA requirement to maintain an adequate level of unencumbered high quality liquid assets, to meet liquidity needs for a 30 calendar day period under an APRA-defined severe stress scenario. Absent a situation of financial stress, the value of the LCR must not be less than 100%. LCR is calculated as the percentage ratio of stock of HQLA, CLF and qualifying Reserve Bank of New Zealand securities over the total net cash out flows in a modelled 30 day defined stressed scenario. Loss given default (LGD) The LGD represents an estimate of the expected severity of a loss to Westpac should a customer default occur during a severe economic downturn. Westpac assigns LGD to each credit facility, assuming an event of default has occurred and taking into account a conservative estimate of the net realisable value of assets to which Westpac has recourse and over which it has security. LGDs also reflect the seniority of exposure in the customer’s capital and debt structure. Maturity The maturity date used is drawn from the contractual maturity date of the customer loans. Net cash outflows Total expected cash outflows minus total expected cash inflows in the specified LCR stress scenario calculated in accordance with APRA’s liquidity standard. GLOSSARY |
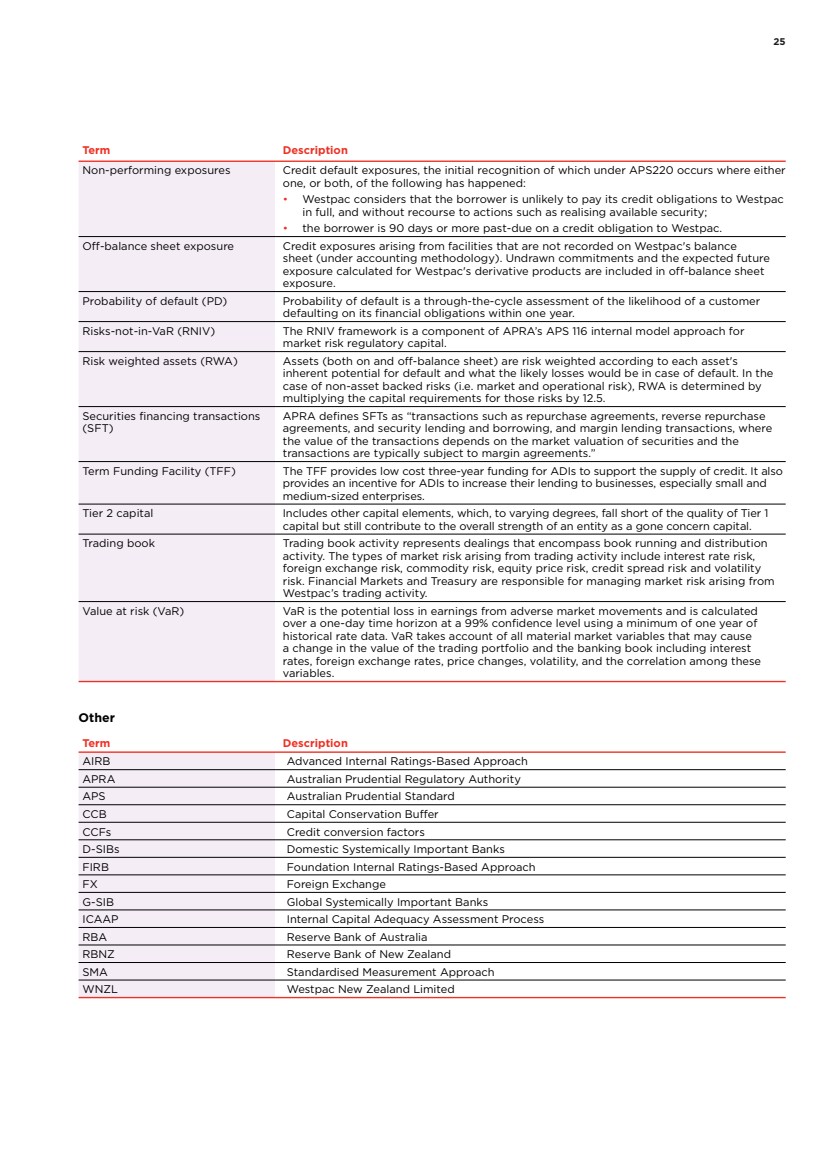
| 25 Term Description Non-performing exposures Credit default exposures, the initial recognition of which under APS220 occurs where either one, or both, of the following has happened: • Westpac considers that the borrower is unlikely to pay its credit obligations to Westpac in full, and without recourse to actions such as realising available security; • the borrower is 90 days or more past-due on a credit obligation to Westpac. Off-balance sheet exposure Credit exposures arising from facilities that are not recorded on Westpac's balance sheet (under accounting methodology). Undrawn commitments and the expected future exposure calculated for Westpac's derivative products are included in off-balance sheet exposure. Probability of default (PD) Probability of default is a through-the-cycle assessment of the likelihood of a customer defaulting on its financial obligations within one year. Risks-not-in-VaR (RNIV) The RNIV framework is a component of APRA’s APS 116 internal model approach for market risk regulatory capital. Risk weighted assets (RWA) Assets (both on and off-balance sheet) are risk weighted according to each asset's inherent potential for default and what the likely losses would be in case of default. In the case of non-asset backed risks (i.e. market and operational risk), RWA is determined by multiplying the capital requirements for those risks by 12.5. Securities financing transactions (SFT) APRA defines SFTs as “transactions such as repurchase agreements, reverse repurchase agreements, and security lending and borrowing, and margin lending transactions, where the value of the transactions depends on the market valuation of securities and the transactions are typically subject to margin agreements.” Term Funding Facility (TFF) The TFF provides low cost three-year funding for ADIs to support the supply of credit. It also provides an incentive for ADIs to increase their lending to businesses, especially small and medium-sized enterprises. Tier 2 capital Includes other capital elements, which, to varying degrees, fall short of the quality of Tier 1 capital but still contribute to the overall strength of an entity as a gone concern capital. Trading book Trading book activity represents dealings that encompass book running and distribution activity. The types of market risk arising from trading activity include interest rate risk, foreign exchange risk, commodity risk, equity price risk, credit spread risk and volatility risk. Financial Markets and Treasury are responsible for managing market risk arising from Westpac’s trading activity. Value at risk (VaR) VaR is the potential loss in earnings from adverse market movements and is calculated over a one-day time horizon at a 99% confidence level using a minimum of one year of historical rate data. VaR takes account of all material market variables that may cause a change in the value of the trading portfolio and the banking book including interest rates, foreign exchange rates, price changes, volatility, and the correlation among these variables. Other Term Description AIRB Advanced Internal Ratings-Based Approach APRA Australian Prudential Regulatory Authority APS Australian Prudential Standard CCB Capital Conservation Buffer CCFs Credit conversion factors D-SIBs Domestic Systemically Important Banks FIRB Foundation Internal Ratings-Based Approach FX Foreign Exchange G-SIB Global Systemically Important Banks ICAAP Internal Capital Adequacy Assessment Process RBA Reserve Bank of Australia RBNZ Reserve Bank of New Zealand SMA Standardised Measurement Approach WNZL Westpac New Zealand Limited |
| 26 WESTPAC GROUP DECEMBER 2023 PILLAR 3 REPORT Disclosure regarding forward-looking statements The information contained in this report contains statements that constitute “forward-looking statements” within the meaning of section 21E of the U.S. Securities Exchange Act of 1934. Forward-looking statements are statements that are not historical facts. Forward-looking statements appear in a number of places in this report and include statements regarding Westpac’s intent, belief or current expectations with respect to its business and operations, macro and micro economic and market conditions, results of operations and financial condition, capital adequacy and risk management, including, without limitation, future loan loss provisions and financial support to certain borrowers, forecasted economic indicators and performance metric outcomes, indicative drivers, climate- and other sustainability- related statements, commitments, targets, projections and metrics, and other estimated and proxy data. Words such as ‘will’, ‘may’, ‘expect’, ‘intend’, ‘seek’, ‘would’, ‘should’, ‘could’, ‘continue’, ‘plan’, ‘estimate’, ‘anticipate’, ‘believe’, ‘probability’, ‘indicative’, ‘risk’, ‘aim’, ‘outlook’, ‘forecast’, ‘f’cast’, ‘f’, ‘assumption’, ‘projection’, ‘target,’ goal’, ‘guidance’, ‘ambition’ or other similar words are used to identify forward-looking statements, or otherwise identify forward-looking statements. These forward-looking statements reflect Westpac’s current views on future events and are subject to change, certain known and unknown risks, uncertainties and assumptions and other factors which are, in many instances, beyond Westpac’s control (and the control of Westpac’s officers, employees, agents and advisors), and have been made based on management’s expectations or beliefs concerning future developments and their potential effect upon Westpac. Forward-looking statements may also be made, verbally or in writing, by members of Westpac’s management or Board in connection with this report. Such statements are subject to the same limitations, uncertainties, assumptions and disclaimers set out in this report. There can be no assurance that future developments or performance will align with Westpac’s expectations or that the effect of future developments on Westpac will be those anticipated. Actual results could differ materially from those we expect or which are expressed or implied in forward-looking statements, depending on various factors including, but not limited to, those described in the section titled ‘Risk factors’ under the section ‘Performance Review’ in Westpac’s 2023 Annual Report. When relying on forward-looking statements to make decisions with respect to Westpac, investors and others should carefully consider such factors and other uncertainties and events. Except as required by law, Westpac assumes no obligation to revise or update any forward-looking statements in this report, whether from new information, future events, conditions or otherwise, after the date of this report. Disclosure regarding forward-looking statements |
| 27 This page has been intentionally left blank. |
| WESTPAC.COM.AU |
| ASX Release 19 FEBRUARY 2024 WESTPAC 1Q24 UPDATE Following is Westpac’s 1Q24 update, for the three months ended 31 December 2023. For further information: Hayden Cooper Justin McCarthy Group Head of Media Relations General Manager, Investor Relations 0402 393 619 0422 800 321 This document has been authorised for release by Tim Hartin, Company Secretary. Level 18, 275 Kent Street Sydney, NSW, 2000 |
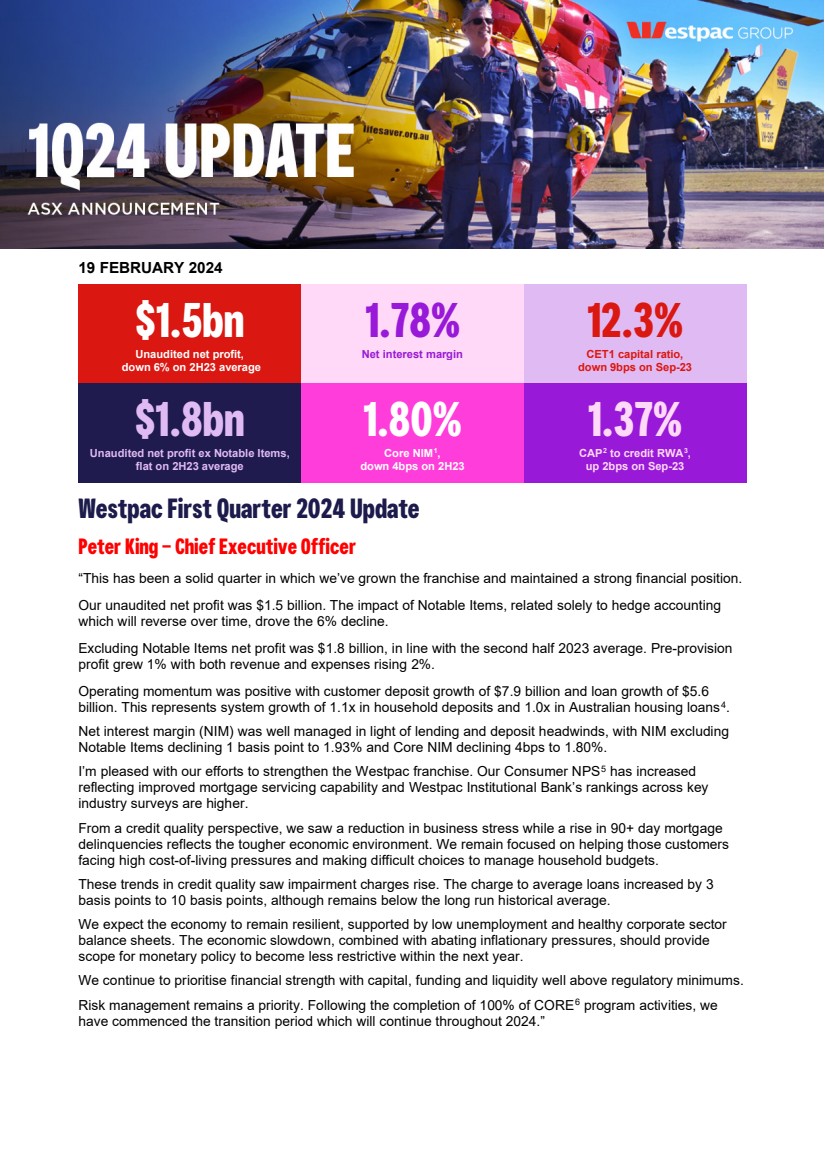
| 19 FEBRUARY 2024 $1.5bn Unaudited net profit, down 6% on 2H23 average 1.78% Net interest margin 12.3% CET1 capital ratio, down 9bps on Sep-23 $1.8bn Unaudited net profit ex Notable Items, flat on 2H23 average 1.80% Core NIM1 , down 4bps on 2H23 1.37% CAP2 to credit RWA3 , up 2bps on Sep-23 Westpac First Quarter 2024 Update Peter King – Chief Executive Officer “This has been a solid quarter in which we’ve grown the franchise and maintained a strong financial position. Our unaudited net profit was $1.5 billion. The impact of Notable Items, related solely to hedge accounting which will reverse over time, drove the 6% decline. Excluding Notable Items net profit was $1.8 billion, in line with the second half 2023 average. Pre-provision profit grew 1% with both revenue and expenses rising 2%. Operating momentum was positive with customer deposit growth of $7.9 billion and loan growth of $5.6 billion. This represents system growth of 1.1x in household deposits and 1.0x in Australian housing loans4. Net interest margin (NIM) was well managed in light of lending and deposit headwinds, with NIM excluding Notable Items declining 1 basis point to 1.93% and Core NIM declining 4bps to 1.80%. I’m pleased with our efforts to strengthen the Westpac franchise. Our Consumer NPS5 has increased reflecting improved mortgage servicing capability and Westpac Institutional Bank’s rankings across key industry surveys are higher. From a credit quality perspective, we saw a reduction in business stress while a rise in 90+ day mortgage delinquencies reflects the tougher economic environment. We remain focused on helping those customers facing high cost-of-living pressures and making difficult choices to manage household budgets. These trends in credit quality saw impairment charges rise. The charge to average loans increased by 3 basis points to 10 basis points, although remains below the long run historical average. We expect the economy to remain resilient, supported by low unemployment and healthy corporate sector balance sheets. The economic slowdown, combined with abating inflationary pressures, should provide scope for monetary policy to become less restrictive within the next year. We continue to prioritise financial strength with capital, funding and liquidity well above regulatory minimums. Risk management remains a priority. Following the completion of 100% of CORE6 program activities, we have commenced the transition period which will continue throughout 2024.” |
| ASX announcement I Westpac 1Q24 Update Operating trends The NIM was 1.78% and comprised: • Core NIM of 1.80%, down 4 basis points, reflecting prudent management in the context of ongoing mortgage competition. In addition, further deposit mix shift towards lower spread savings and term deposits was offset by higher earnings on capital and hedged deposits; • Treasury and Markets income of 13 basis points, up 3 basis points; and • Hedging items, that will reverse over time, which detracted 15 basis points. Expenses were down 6% and excluding Notable Items were up 2%. The rise in expenses excluding Notable Items reflected higher amortisation expense and ongoing inflationary pressures. These outweighed benefits from the 2% reduction in FTE and ongoing Cost Reset actions. Stressed assets reduced by 4 basis points in the quarter to 1.22% of total committed exposures, with the reduction in watchlist and substandard exposures more than offsetting the rise in 90+ day mortgage delinquencies. Financial strength The CET1 capital ratio was 12.3% as at 31 December 2023, compared to the target operating range of 11.0% to 11.5%. The 9 basis point decline in the quarter reflects the 2H23 dividend payment more than offsetting earnings for the quarter and the RWA reduction which was mainly related to IRRBB7. The quarterly average liquidity coverage ratio of 133% and net stable funding ratio of 114% remain above regulatory minimums. Wholesale funding is well progressed with more than $17 billion raised in the financial year to date, compared to the planned FY24 funding of $35-40 billion. Credit impairment provisions were $5.1 billion as at 31 December 2023, $1.5 billion above expected losses of the base case economic scenario. The ratio of CAP to credit RWA was up 2 basis points to 1.37%. The Group has completed 31%8 of the $1.5 billion on market share buyback announced in November 2023. Refer to the 1Q24 Investor Discussion Pack slides for further details. Financial summary Excluding Notable Items $m 2H23 qtr average % movement 1Q24 - 2H23 qtr ave 2H23 qtr average % movement 1Q24 - 2H23 qtr ave Net interest income 4,602 (7) 4,606 1 Non-interest income 719 3 730 3 Net operating income 5,321 (5) 5,336 2 Operating expenses (2,852) (6) (2,622) 2 Pre-provision profit 2,469 (4) 2,714 1 Impairment charges (129) 47 (129) 47 Net profit 1,597 (6) 1,773 - Return on equity 8.9% (61bps) 9.9% (7bps) Return on tangible equity 10.1% (69bps) 11.2% (9bps) Further information Hayden Cooper Group Head of Media Relations +61 402 393 619 Justin McCarthy General Manager, Investor Relations +61 422 800 321 |
| ASX announcement I Westpac 1Q24 Update 1 Core net interest income is calculated by excluding Notable Items and Treasury and Markets. 2 Collectively assessed provisions. 3 Risk weighted assets. 4 Multiples are based on ADI system as published in the Monthly ADI statistics by APRA for the 3 months ending 31 December 2023. 5 Consumer Net Promoter Score, Source: Fifth Dimension (5D), 6MR. Main financial institution customers. 6 Customer Outcomes and Risk Excellence 7 Interest Rate Risk in the Banking Book. 8 As at 19 February 2024. Content in this announcement principally covers and compares the 1Q24 and 2H23 quarterly average periods unless otherwise stated. All amounts are in Australian dollars. Certain amounts and ratios, including amounts and ratios excluding Notable Items are not defined by Australian Accounting Standards (AAS). These non-AAS measures are identified and described in the ‘Reading this report’ section of the Performance Review in the 2023 Annual Report. This announcement contains ‘forward-looking statements’ and statements of expectation reflecting Westpac’s current views on future events. They are subject to change without notice and certain risks, uncertainties and assumptions which are, in many instances, beyond its control. They have been based upon management's expectations and beliefs concerning future developments and their potential effect on Westpac. Should one or more of the risks or uncertainties materialise, or should underlying assumptions prove incorrect, actual results may differ materially from those expressed or implied in such statements. Investors should not place undue reliance on forward-looking statements and statements of expectation. Except as required by law, Westpac is not responsible for updating, or obliged to update, any matter arising after the date of this announcement. The information in this announcement is subject to the information in Westpac’s ASX filings, including in its 2023 Annual Report. Also refer to the disclaimer on page 13 of the Westpac 1Q24 Investor Discussion Pack. |
| ASX Release 19 February 2024 WESTPAC 1Q24 INVESTOR DISCUSSION PACK Following is Westpac’s 1Q24 slides covering capital, credit quality, funding and financial performance for the three months ended December 2023. For further information: Hayden Cooper Justin McCarthy Group Head of Media Relations General Manager, Investor Relations 0402 393 619 0422 800 321 This document has been authorised for release by Tim Hartin, Company Secretary. Level 18, 275 Kent Street Sydney, NSW, 2000 |
| 1Q24 INVESTOR DISCUSSION PACK FOR THE 3 MONTHS ENDED 31 DECEMBER 2023 WESTPAC BANKING CORPORATION ABN 33 007 457 141 This document should be read in conjunction with Westpac’s December 2023 Pillar 3 Report. All amounts are in Australian dollars. |
| 1Q24 SUMMARY1 SUMMARY 1 31 December 2023 compared to 30 September 2023 unless otherwise stated. 2 Level 2 common equity tier 1 (CET1). 3 Target operating range is 11.0-11.5%. 4 Risk weighted assets (RWA). 5 Interest rate risk in the banking book (IRRBB). 6 Total committed exposure (TCE). 7 Collectively assessed provisions (CAP). 8 1Q24 compared to 2H23. 9 Individually assessed provisions (IAP) includes new IAPs, write-backs and recoveries. 10 Liquidity coverage ratio (LCR). 11 Net stable funding ratio (NSFR). • Stressed assets to TCE6 1.22%, down 4bps • Mortgage 90+ day delinquencies: - Australia 0.95%, up 9bps - New Zealand 0.40%, up 7bps • CAP7 to credit RWA 137bps, up 2bps • Impairment charge to average loans of 10bps, up 3bps8 - IAP9 charge of $55m mainly from a single exposure - CAP charge of $134m Capital above operating range Well provisioned • CET12 capital ratio of 12.3%, above target operating range3 • RWA4 $8.0bn or 1.8% lower mainly due to IRRBB5 decrease • LCR10 quarterly average 133% • NSFR11 114% • Deposit to loan ratio 83.3%, up 0.4 ppts • Well progressed on wholesale funding plans Funding and liquidity above required levels 2 Westpac Group 1Q24 Investor Discussion Pack |
| RWA details on page 4 CET1 CAPITAL RATIO 12.3% 3 Level 2 CET1 capital ratio movements (%) Westpac Group 1Q24 Investor Discussion Pack CAPITAL 1 Capital deductions and other items including FX translation impacts. 2 Assumes completion of remaining $1.3bn on market share buyback. 3 Internationally comparable methodology references the Australian Banking Association (ABA) study on the comparability of APRA’s new capital framework and finalised reform released on 10 March 2023. 12.38 34bps 20bps 12.29 11.99 (57bps) (4bps) (2bps) (30bps) Sep-23 Net profit 2H23 dividend RWA Share buyback Other Dec-23 Previously announced share buyback Dec-23 Pro forma Key capital ratios (%) Dec-22 Sep-23 Dec-23 Level 2 CET1 capital ratio 11.1 12.4 12.3 Additional Tier 1 capital ratio 2.1 2.2 2.4 Tier 1 capital ratio 13.2 14.6 14.7 Tier 2 capital ratio 4.9 5.9 6.3 Total regulatory capital ratio 18.1 20.5 21.0 Risk weighted assets (RWA)($bn) 480 451 443 Leverage ratio 5.5 5.5 5.4 Level 1 CET1 capital ratio 11.1 12.6 12.5 Internationally comparable ratios3 Leverage ratio (internationally comparable) 5.9 6.0 5.9 CET1 capital ratio (internationally comparable) 17.4 18.7 18.4 1 2 |
| 4 RWA ($bn) Credit RWA1 ($bn) IRRBB RWA1 ($bn) Westpac Group 1Q24 Investor Discussion Pack RISK WEIGHTED ASSET MOVEMENTS CAPITAL 1 Chart may not add due to rounding. 2 Mark to market (MTM). 2 451.4 - 0.2 443.4 (1.8) (6.2) (0.2) Sep-23 Credit Market IRRBB Operational Other Dec-23 339.8 2.0 0.6 337.9 (1.5) (2.1) (0.8) Sep-23 Credit quality Lending Counter-party credit & MTM risk Data refinement FX translation Dec-23 Down $8.0bn or 1.8% 13 16 9 17 20 20 5 5 5 35 40 34 3.41 4.26 3.78 -4.00 -3.00 -2.00 -1.00 0.00 1.00 2.00 3.00 4.00 -10 0 10 20 30 40 50 60 Mar-23 Sep-23 Dec-23 Embedded loss/(gain) Repricing and yield curve risk Optionality and basis risk 3y Swap rate (in %) Down $1.8bn or 0.5% |
| 398 382 407 351 442 981 1,011 1,035 1,061 1,109 1,837 1,980 2,200 2,405 2,410 870 830 809 692 708 706 720 647 432 403 4,792 4,923 5,098 4,941 5,072 Dec-22 Mar-23 Jun-23 Sep-23 Dec-23 Overlay Stage 1 CAP Stage 2 CAP Stage 3 CAP Stage 3 IAP 5 Key ratios Forecasts used in economic scenarios Total provisions for expected credit losses1 ($m) Westpac Group 1Q24 Investor Discussion Pack PROVISION COVERAGE PROVISIONING 1 Includes provisions for debt securities. 2 These key economic indicators represent trough or peak values that characterise the scenarios considered in setting downside severity. Residential and commercial forecasts represent cumulative reduction over a two-year period. Dec-22 Sep-23 Dec-23 Provisions to gross loans (bps) 64 63 65 Impaired asset provisions to impaired assets (%) 44 43 47 Collectively assessed provisions to credit RWA (bps) 121 135 137 Forecasts for base case ECL Base case Downside 2024 2025 Trough / peak2 GDP growth 1.6% 2.5% (6%) Unemployment 4.5% 4.7% 11% Residential property prices 6% 4% (27%) Commercial property prices (0.5%) 5.4% (32%) Reduction in mortgage overlay for risks now increasingly reflected in modelled CAP Increase driven by single name Increase in 90+ day mortgage delinquency |
| 6 Australian mortgage delinquencies (%) Australian consumer finance 90+ delinquencies (%) Stressed exposures as a % of TCE Westpac Group 1Q24 Investor Discussion Pack STRESSED EXPOSURES AND DELINQUENCIES CREDIT QUALITY 1 Portfolio has been in run off since March 2022. 1 0.12 0.12 0.12 0.11 0.11 0.30 0.32 0.35 0.39 0.42 0.22 0.23 0.23 0.22 0.22 0.42 0.43 0.46 0.54 0.47 1.06 1.10 1.16 1.26 1.22 Dec-22 Mar-23 Jun-23 Sep-23 Dec-23 0.58 2.21 3.06 0.0 1.5 3.0 4.5 6.0 Dec-21 Jun-22 Dec-22 Jun-23 Dec-23 Credit cards Personal loans Auto loans (consumer - portfolio in run off) 1.70 0.95 0.74 0.0 1.0 2.0 3.0 4.0 Dec-21 Jun-22 Dec-22 Jun-23 Dec-23 30+ day delinquencies 90+ day delinquencies 90+ dpd excl. 6 months serviceability hold-out period Impaired Non-performing, 90+ days Non-performing, <90 days Watchlist & substandard |
| 0.0 1.0 2.0 3.0 4.0 5.0 6.0 7.0 8.0 Property Wholesale & retail trade Manufacturing Agriculture, forestry & fishing Services Property & business services Transport & storage Utilities Construction Accommodation cafes & restaurants Mining Dec-22 Sep-23 Dec-23 Corporate and business stressed exposures by industry sector (%) Exposure and credit quality by sector Sector Finance & Insurance1 Property2 Wholesale & retail trade Manufacturing Agriculture, forestry & fishing Services3 Property & business services Transport & storage Utilities Construction4 Accomm, cafes & restaurants Mining TCE ($bn) Dec-23 201.9 80.3 30.8 24.5 24.4 26.3 23.1 19.0 20.5 12.9 11.5 7.5 Sep-23 202.1 80.7 31.0 24.7 24.1 26.4 23.0 18.3 18.9 12.9 10.8 8.0 Stressed (%) 5,6 Dec-23 0.1 2.5 3.7 3.1 4.8 2.6 2.7 1.1 0.1 6.4 3.3 4.9 Sep-23 0.1 2.6 3.3 3.1 4.6 4.1 2.9 1.1 0.1 6.9 3.7 5.2 Impaired (%) 6 Dec-23 0.0 0.1 0.7 0.6 0.2 0.4 0.5 0.1 0.0 0.6 0.3 0.1 Sep-23 0.0 0.1 0.4 0.4 0.2 0.4 0.5 0.1 0.0 0.6 0.4 0.1 CREDIT QUALITY ACROSS SECTORS CREDIT QUALITY 1 Finance and insurance includes banks, non-banks, insurance companies and other firms providing services to the finance and insurance sectors. Includes assets held for liquidity portfolio. 2 Property includes both residential and non-residential property investors and developers and excludes real estate agents. 3 Services includes education, health & community services, cultural & recreational and personal & other services. 4 Construction includes building and non-building construction, and industries serving the construction sector. 5 Includes impaired exposures. 6 Percentage of portfolio TCE. 7 Lower watchlist driven by upgrade of single name Westpac Group 1Q24 Investor Discussion Pack |
| Australian mortgage portfolio Mar-23 balance Sep-23 balance Dec-23 balance Total portfolio ($bn) 472.7 485.6 490.9 Owner occupied (OO) (%) 66.4 67.1 67.5 Investment property loans (IPL) (%) 32.2 31.6 31.3 Portfolio loan/line of credit (LOC) (%) 1.4 1.3 1.2 Variable rate / Fixed rate (%) 67/33 76/24 81/19 Interest only (I/O) (%) 13.3 12.8 12.5 Proprietary channel (%) 51.5 50.8 50.2 First home buyer (%) 10.8 10.8 11.0 Mortgage insured (%) 14.2 13.1 12.9 Mar-23 Sep-23 Dec-23 Average loan size1 ($’000) 292 301 306 Customers ahead on repayments including offset account balances (%) By accounts 74 75 76 By balances 69 71 72 Mortgage losses net of insurance ($m) 11 21 9 Annual mortgage loss rate2 (bps) 0.5 0.7 0.7 Hardship3 balances (% of portfolio) 0.50 0.71 0.86 8 AUSTRALIAN MORTGAGE PORTFOLIO COMPOSITION MORTGAGE CREDIT QUALITY 1 Includes amortisation. Calculated at account level, where split loans represent more than one account. 2 Mortgage loss rates for March are annualised, based on losses for the 6 months. Mortgage loss rates for September are actual losses for the 12 months ending. Mortgage loss rates for December are annualised, based on losses for the 3 months. 3 Financial hardship assistance is available to customers experiencing temporary financial difficulty, including changes in income due to illness, a relationship breakdown or natural disasters. Hardship assistance often takes the form of a reduction or deferral of repayments for a short period. 4 Dynamic LVR is the loan-to-value ratio taking into account the current loan balance, changes in security value, offset account balances and other loan adjustments. Property valuation source CoreLogic. Westpac Group 1Q24 Investor Discussion Pack Fixed rate mortgage expiry schedule ($bn, for the 6mths to) 17 21 19 20 19 51 37 31 21 14 10 Mar-22 Sep-22 Mar-23 Sep-23 Mar-24 Sep-24 Mar-25 Sep-25 >Sep-25 Expired Yet to expire 22 17 42 12 6 1 64 15 13 6 1 0.4 0.6 0 10 20 30 40 50 60 70 80 90 100 0<=60 60<=70 70<=80 80<=90 90<=95 95<=100 >100 Portfolio LVR at origination Portfolio dynamic LVR Loan-to-value ratios (LVRs) (%) N/A 4 Chart may not add due to rounding |
| Loans ‘on time’ and <1mth ahead 9 Offset account balances2 Customers ahead on repayments ($bn) 1 (% by accounts) Customers ahead on repayments1 (% by balances) Buffer to balance ratio3 (%) Westpac Group 1Q24 Investor Discussion Pack AUSTRALIAN MORTGAGE PORTFOLIO REPAYMENT BUFFERS MORTGAGE CREDIT QUALITY 1 Customer loans ahead on payments exclude equity/line of credit products as there are no scheduled principal payments. Includes mortgage offset accounts. ‘Behind’ is more than 30 days past due. ‘On time’ includes up to 30 days past due. 2 Includes RAMS from Sep-20 onwards. 3 Excludes Line of Credit. 14 8 6 17 Dec-23 45 Investment property loans – (generally maintain higher balances for tax purposes) Accounts opened in the last 12 months Structural restrictions on repayments e.g. fixed rate Residual – <1 month repayment buffer Buffer = Current Limit - Outstanding Balance + Offset Balance 39 41 46 51 53 57 59 Sep-18 Sep-19 Sep-20 Sep-21 Sep-22 Sep-23 Dec-23 32 13 15 16 23 1 >2yrs >6mths <2yrs <6mths <1mth On time Behind 16.8 18.2 18.9 19.4 19.3 19.3 Sep-19 Sep-20 Sep-21 Sep-22 Sep-23 Dec-23 1 30 19 16 12 21 2 28 19 17 13 22 2 26 19 17 14 22 Behind On time < 1mth < 6mths >2yrs Mar-23 Sep-23 Dec-23 Chart does not add due to rounding >6mths to <2yrs |
| 52% 21% 20% 5% 3% 0<=60 60<=70 70<=80 80<=90 90+ 10 Mortgage delinquencies (%) Mortgage portfolio LVR1 (% of portfolio) Business stressed exposures to business TCE (%) Unsecured Consumer delinquencies (%) Westpac Group 1Q24 Investor Discussion Pack NEW ZEALAND CREDIT QUALITY NEW ZEALAND CREDIT QUALITY 1 LVR based on current exposure and property valuation at the latest credit event. 92% of mortgage portfolio has an LVR less than 80% Chart may not add due to rounding 0.40 0.84 0.0 0.5 1.0 1.5 2.0 Dec-21 Jun-22 Dec-22 Jun-23 Dec-23 90+ day delinquencies 30+ day delinquencies 0.1 0.1 0.1 0.1 0.1 0.2 0.3 0.4 0.3 0.3 1.2 1.9 2.0 2.1 2.2 1.5 2.2 2.4 2.5 2.5 Dec-22 Mar-23 Jun-23 Sep-23 Dec-23 Impaired Non-performing, not impaired Watchlist & substandard 0.89 2.06 0.0 1.5 3.0 4.5 6.0 Dec-21 Jun-22 Dec-22 Jun-23 Dec-23 90+ day delinquencies 30+day delinquencies Chart may not add due to rounding |
| 11 Term debt issuance and maturity profile1 ($bn) FUNDING AND LIQUIDITY FUNDING AND LIQUIDITY 1 Based on residual maturity and FX spot currency translation. Includes all debt issuance with contractual maturity greater than 13 months excluding US Commercial Paper and Yankee Certificates of Deposit. Contractual maturity date for Additional Tier 1 and callable Tier 2 instruments is the first scheduled conversion date or call date for the purposes of this disclosure. Maturities exclude securitisation amortisation. 2 Year to date is 1 October 2023 to 19 February 2024. 18 12 12 34 31 35 43 35 9 33 32 31 24 27 8 25 FY19 FY20 FY21 FY22 FY23 1Q24 FY24 FY25 FY26 FY27 FY28 FY29 >FY29 Funding for Lending Programme (NZ) Term Funding Facility (Aus) Tier 2 capital Additional Tier 1 capital Covered bond Senior/Securitisation Issuance Maturities 58 2 10 15 15 Senior bonds Covered bonds Additional Tier 1 capital Tier 2 capital Securitisation 139 135 134 133 Dec-22 Mar-23 Sep-23 Dec-23 Key funding and liquidity measures Liquidity coverage ratio (LCR) (%) Quarterly average 122 119 115 114 Dec-22 Mar-23 Sep-23 Dec-23 Net stable funding ratio (NSFR) (%) 84.0 83.7 82.9 83.3 Dec-22 Mar-23 Sep-23 Dec-23 Customer deposits to net loans ratio (D2L) (%) • Quarterly LCR movement reflects lower liquid asset holdings, partly offset by lower average net cash outflows • Lower NSFR reflects growth in lending and further increases in required stable funding for mortgages under APS 112, partly offset by higher deposits • Increase in D2L ratio due to growth in deposits, with some seasonal moderation in lending growth remaining Term debt issuance by program year to date2 (%) $17.3bn YTD Westpac Group 1Q24 Investor Discussion Pack |
| APPENDIX 1: FINANCIAL SUMMARY APPENDIX Excluding Notable Items $m 2H23 qtr average % movement 1Q24 - 2H23 qtr average 2H23 qtr average % movement 1Q24 - 2H23 qtr average Net interest income 4,602 (7) 4,606 1 Non-interest income 719 3 730 3 Net operating income 5,321 (5) 5,336 2 Expenses (2,852) (6) (2,622) 2 Pre-provision profit 2,469 (4) 2,714 1 Impairment charges (129) 47 (129) 47 Tax and non-controlling interests (NCI) (743) (10) (812) (3) Net profit 1,597 (6) 1,773 - Return on equity (ROE) 8.9% (61bps) 9.9% (7bps) Return on tangible equity (ROTE) 10.1% (69bps) 11.2% (9bps) 12 Westpac Group 1Q24 Investor Discussion Pack |
| Table may not add due to rounding APPENDIX 2: NET PROFIT APPENDIX Excluding Notable Items $b 3Q23 4Q23 2H23 qtr average 1Q24 3Q23 4Q23 2H23 qtr average 1Q24 Net interest income 4.8 4.4 4.6 4.3 4.6 4.6 4.6 4.7 Non-interest income 0.8 0.6 0.7 0.7 0.8 0.7 0.7 0.8 Net operating income 5.6 5.0 5.3 5.0 5.4 5.2 5.3 5.4 Expenses (2.7) (3.0) (2.9) (2.7) (2.7) (2.6) (2.6) (2.7) Pre-provision profit 2.9 2.0 2.5 2.4 2.8 2.7 2.7 2.7 Impairment charges (0.3) - (0.1) (0.2) (0.3) - (0.1) (0.2) Tax and non-controlling interests (NCI) (0.8) (0.7) (0.7) (0.7) (0.8) (0.9) (0.8) (0.8) Net profit 1.8 1.4 1.6 1.5 1.7 1.8 1.8 1.8 ROE 10.3% 7.5% 8.9% 8.3% 9.6% 10.2% 9.9% 9.8% ROTE 11.7% 8.5% 10.1% 9.4% 10.9% 11.5% 11.2% 11.1% 13 Westpac Group 1Q24 Investor Discussion Pack |
| INVESTOR RELATIONS TEAM 14 Contact us Westpac Group 1Q24 Investor Discussion Pack INVESTOR RELATIONS CONTACT SHARE REGISTRY CONTACT Justin McCarthy General Manager, Investor Relations Arthur Petratos Manager, Shareholder Services Rebecca Plackett Head of Corporate Reporting and ESG Jacqueline Boddy Head of Debt Investor Relations James Wibberley Manager, Investor Relations Catherine Garcia Head of Investor Relations, Institutional For all shareholding enquiries relating to: – Address details and communication preferences – Updating bank account details, and participation in the dividend reinvestment plan For all matters relating to Westpac’s strategy, performance and results 1800 804 255 westpac@linkmarketservices.com.au investorcentre.linkmarketservices.com.au +61 2 9178 2977 investorrelations@westpac.com.au westpac.com.au/investorcentre |
| DISCLAIMER The material contained in this presentation is intended to be general background information on Westpac Banking Corporation (Westpac) and its activities. The information is supplied in summary form and is therefore not necessarily complete. It is not intended that it be relied upon as advice to investors or potential investors, who should consider seeking independent professional advice depending upon their specific investment objectives, financial situation or particular needs. The material contained in this presentation may include information derived from publicly available sources that have not been independently verified. No representation or warranty is made as to the accuracy, completeness or reliability of the information. All amounts are in Australian dollars unless otherwise indicated. This presentation contains statements that constitute “forward-looking statements” within the meaning of Section 21E of the US Securities Exchange Act of 1934. Forward-looking statements are statements that are not historical facts. Forward-looking statements appear in a number of places in this presentation and include statements regarding our intent, belief or current expectations with respect to our business and operations, macro and micro economic and market conditions, results of operations and financial condition, capital adequacy and risk management, including, without limitation, future loan loss provisions and financial support to certain borrowers, forecasted economic indicators and performance metric outcomes, indicative drivers, climate- and other sustainability-related statements, commitments, targets, projections and metrics, and other estimated and proxy data. We use words such as ‘will’, ‘may’, ‘expect’, ‘intend’, ‘seek’, ‘would’, ‘should’, ‘could’, ‘continue’, ‘plan’, ‘estimate’, ‘anticipate’, ‘believe’, ‘probability’, ‘indicative’, ‘risk’, ‘aim’, ‘outlook’, ‘forecast’, ‘f’cast’, ‘f’, ‘assumption’, ‘projection’, ‘target’, ‘goal’, ‘guidance’, ‘ambition’, or other similar words to identify forward-looking statements, or otherwise identify forward-looking statements. These forward-looking statements reflect our current views on future events and are subject to change, certain known and unknown risks, uncertainties and assumptions and other factors which are, in many instances, beyond our control (and the control of our officers, employees, agents and advisors), and have been made based on management’s expectations or beliefs concerning future developments and their potential effect upon us. Forward-looking statements may also be made, verbally or in writing, by members of Westpac’s management or Board in connection with this presentation. Such statements are subject to the same limitations, uncertainties, assumptions and disclaimers set out in this presentation. There can be no assurance that future developments or performance will align with our expectations or that the effect of future developments on us will be those anticipated. Actual results could differ materially from those we expect or which are expressed or implied in forward-looking statements, depending on various factors including, but not limited to, those described in the section titled ‘Risk factors' under the section ‘Performance Review’ in our 2023 Annual Report available at www.westpac.com.au. When relying on forward-looking statements to make decisions with respect to us, investors and others should carefully consider such factors and other uncertainties and events. Except as required by law, we assume no obligation to revise or update any forward-looking statements contained in this presentation, whether from new information, future events, conditions or otherwise, after the date of this presentation. DISCLAIMER 15 Westpac Group 1Q24 Investor Discussion Pack |
1 Year Westpac Banking (PK) Chart |
1 Month Westpac Banking (PK) Chart |

It looks like you are not logged in. Click the button below to log in and keep track of your recent history.
Support: +44 (0) 203 8794 460 | support@advfn.com
By accessing the services available at ADVFN you are agreeing to be bound by ADVFN's Terms & Conditions
 Hot Features