We could not find any results for:
Make sure your spelling is correct or try broadening your search.
| Share Name | Share Symbol | Market | Type |
|---|---|---|---|
| ViaDerma Inc (PK) | USOTC:VDRM | OTCMarkets | Common Stock |
| Price Change | % Change | Share Price | Bid Price | Offer Price | High Price | Low Price | Open Price | Shares Traded | Last Trade | |
|---|---|---|---|---|---|---|---|---|---|---|
| 0.0009 | 5.29% | 0.0179 | 0.0179 | 0.0188 | 0.0186 | 0.017 | 0.0179 | 4,096,593 | 20:02:38 |
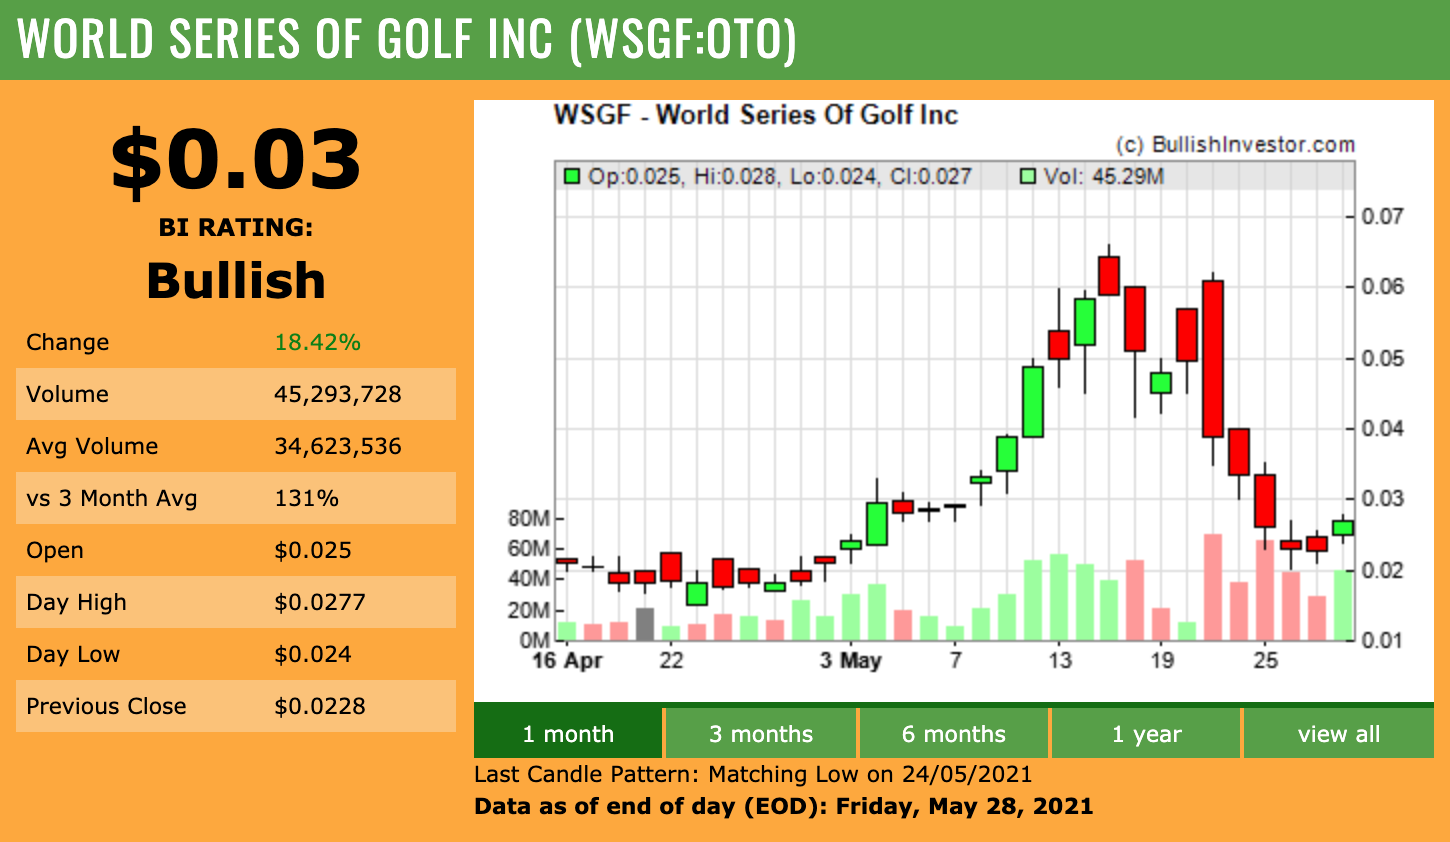
June 1, 2021 -- InvestorsHub NewsWire -- via BullishInvestor.com/WSGF

The stock price direction for the day for WSGF is UP. The stock is experiencing a downtrend as of late, with a decrease of more than 15 percent in the last five days. However, a trend reversal is possible as the stock has experienced a minor share price increase today. Based on BullishInvestor.com’s proprietary algorithms, WSGF is currently signalling BULLISH.
The most recent Candle Stick pattern for WSGF is the Belt-hold. Overall the technical indicators are signaling a bullish reading for WSGF. As such, it may be a wise decision to consider WSGF at these price levels. The last BEARISH rating was registered on May 24, 2021 when WSGF was trading at $ 0.03.
This stock now finds itself with a new BULLISH rating and is worthy of a new look from a technical analysis perspective.
Other stocks on the move include EATR, AVVH and VDRM.
SOURCE: BullishInvestor.com/WSGF
1 Year ViaDerma (PK) Chart |
1 Month ViaDerma (PK) Chart |

It looks like you are not logged in. Click the button below to log in and keep track of your recent history.
Support: +44 (0) 203 8794 460 | support@advfn.com
By accessing the services available at ADVFN you are agreeing to be bound by ADVFN's Terms & Conditions